

Abstract
A time frame in which newly diagnosed hypertensive patients attain blood pressure (BP) goal would guide patients through uncertainty associated with initiating drug therapy for hypertension control. This study estimates time to BP goal resulting from drug therapy initiation among real‐world hypertensive patients and identifies factors associated with variations in time to BP goal. The study uses a historical cohort design. Hypertensive patients who had initiated antihypertensive drug therapy between July 1, 2002, and December 31, 2003, were followed up to 12 months until the end of 2004. Electronic medical records from a medical group were linked with pharmacy claims, as well as with medical claims. Survival analyses were used to compare lengths of time needed to reach BP goals. A total of 223 patients from a real world practice setting had initiated antihypertensive drug therapy. The patients took 3.25 months (95% CI: 2.49–4.82) to reach BP goal. The patient‐centric time to BP goal was 7.1 weeks longer than those reported in controlled experimental settings. This finding highlights the gap between results of controlled clinical trials and their application to clinical practice, and informs healthcare practitioners of the importance of setting a patient‐centric goal in pharmacological treatment of hypertension. Clin Trans Sci 2012; Volume #: 1–6
Keywords: patient‐centered practice, hypertension control, drug therapy initiation, patient preference
Introduction
The suboptimal management of hypertension continues to be a challenge to the U.S. healthcare system. The National Health and Nutrition Examination Survey (NHANES) reported that approximately 70% of hypertensive patients do not have their hypertension controlled (<140/90 mmHg) at time of blood pressure (BP) measurement.1 The pharmacological treatment offers one of most effective tools to control hypertension, as described by the Seventh Report of the Joint National Committee on Prevention, Detection, Evaluation, and Treatment of High Blood Pressure (JNC 7).2 The JNC 7, while recommending lifestyle modifications for prehypertensive patients, recommends initiating drug therapy for hypertensive patients.
For patients with chronic diseases, it is important to set realistic goals to guide through the lifelong journey associated with chronic disease management.3 Patients who are initiated on drug therapy for hypertension control are anxious of knowing how long it would take to reach BP goal. When goals are set too low, patients lack drive and are likely to fail in managing chronic diseases. At the other extreme, patients are tense and feel it takes longer than they had planned. Neither situation is likely to prove successful in managing chronic disease.
Information on time to reach BP goal from the initiation of drug therapy offers important benefits in setting realistic goals. Most importantly, it helps alleviate patient anxiety originating from uncertainty associated with attaining a BP goal. It is well known that people, regardless of disease, have difficulty making effective decisions in an uncertain environment.
The timeframe is considered one of important elements required for setting realistic goals. According to Bovend'Eerdt, achieving goals begins with writing specific, measurable, achievable, realistic/relevant, and timed (SMART) goals.4 Several studies have reported positive effects of writing SMART goals in areas of rehabilitation.5, 6
However, time to reach BP goal has rarely been used as an endpoint measure of hypertension control, i.e., popular endpoint measures for hypertension control have been systolic BP and diastolic BP.7 Further, the studies that have examined time to reach BP goal as an endpoint measure are based on randomized controlled experiments.8, 9 One controlled experiment reported that it took 8.1 weeks for hypertensive patients to reach BP goal from the first use of an antihypertensive drug.8 The time to BP goal decreased further with stronger drug doses, as well as after adding hydrochlorothiazide.
While a time to BP endpoint established from controlled experimental settings offers a benchmark for idealistic environments, it may not be applicable for most real‐world patients. The benchmark based on controlled experiments cannot be patient‐centric. Endpoints measured in controlled experiments are rarely achieved in real‐world settings.10 For example, medication adherence is optimum in controlled experiments but not in real‐world settings. Controlled experiments offer idealistic environments for patients who get full support from experimental resources. In real‐world settings, it is entirely up to patients to adhere to a medication as recommended.
Information on a real‐world timeframe in which newly diagnosed hypertensive patients reach BP goal from initiating drug therapy will help set a patient‐centric goal for hypertension control. Such information can help patients and healthcare practitioners better address concerns associated with the first steps of drug therapy for hypertension control. This study estimated time to BP goal among real‐world hypertensive patients from the initiation of drug therapy and identified factors associated with variations in time to reach BP goal.
Patients and Methods
Research design
This study used a historical cohort (Figure 1). Hypertensive patients were retrospectively identified from electronic medical records and pharmacy claims abstracted for the 3‐year period January 1, 2002, to December 31, 2004. Two cohorts of hypertensive patients were defined based on the exposure to different types of antihypertensive drug therapy initiated, i.e., monotherapy and combination drug therapy. For each subject, BP levels were observed for a maximum of 12 months following initiation of antihypertensive drug therapy. For each study subject who was lost to follow‐up, the number of month the subject had stayed in the follow‐up was recorded. This study used survival analyses that control for the problem of right censoring.11
Figure 1.
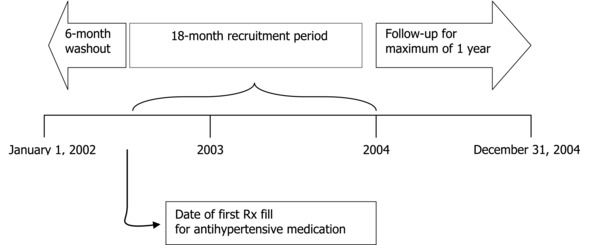
Schematic of study design.
Subjects and study settings
The study subjects were hypertensive patients who had initiated antihypertensive drug therapy between July 1, 2002, and December 31, 2003 (Figure 2). The patients were from a multispecialty medical group in a Southeastern state. The medical group, consisting of more than 70 physicians, specialists, and other midlevel providers, provided physician services for beneficiaries of various health plans. The medical group had an electronic medical record system and provided information on BP readings and dates of clinic visits. For this study, the medical group procured pharmacy and medical claims data along with insurance eligibility for the beneficiaries of two major health plans (Plan A and Plan B). The claims data spanned 3 years from January1, 2002, to December 31, 2004.
Figure 2.
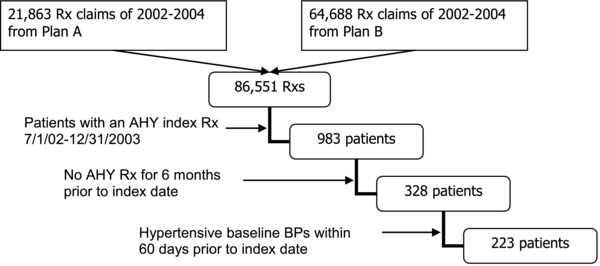
Sample selection process.
To be included in the study, patients met all of the following criteria: (1) receive an index prescription fill for antihypertensive agent(s) during the period July 1, 2002, to December 31, 2003; (2) continuous insurance eligibility for 6 months prior to the index date; (3) no prescriptions for antihypertensive agents filled in the 6 months preceding the index date; (4) at least one BP measurement was available in the 60 days prior to or on the index date as the baseline BP; (5) the baseline BP measurement was greater than or equal to 130/80 mmHg in patients with diabetes or renal disease and greater than or equal to 140/90 mmHg otherwise; and (6) at least one follow‐up BP measurement was available within 12 months following the index date.
Measurements
Time to BP goal: BP goal was attained when both systolic/diastolic BP readings of a follow‐up BP measurement first went below 140/90 mmHg (or 130/80 in patients with diabetes or renal disease) within 12 months of the index date. Time to BP goal was then defined as the time between the index date and the date when the BP goal was first reached.
Baseline BP: Baseline BP measurements were those BP readings in electronic medical records on the index antihypertension prescription or within 60 days prior to the index date. They consisted of systolic BP and diastolic BP. Hypertensive BPs were further classified as stage 2 if baseline systolic BP was greater than or equal to 160 or if baseline diastolic BP was greater than or equal to 100. Otherwise, hypertensive BPs were classified as stage 1. If more than one baseline BP reading was available, the BP reading closest to the index date was used as the baseline BP measurement.
Diabetes/renal diseases: Patients with diabetes or renal diseases were identified from the existence of ICD9 codes in the medical claims database in the 6 months preceding the index date. The ICD9 codes for diabetes included 250.00–250.33, 250.40–250.73, and 250.90–250.93.10, 12 ICD9 codes for renal diseases included 403.11, 403.91, 404.12, 404.92, 582–582.9, 583–583.7, 585, 586, 588–588.9, V42.0, V45.1, V56.0, and V56.8.11, 13 Diabetic patients were also identified based on the use of insulin or an oral hypoglycemic medication documented in the pharmacy claims database.
Comorbidity, prior healthcare utilization, and demographics: Prior healthcare expenditures were measured by summing all prescription drug expenditures and medical care expenditures that had occurred during the 6 months prior to initiating antihypertensive drug therapy. Comorbidity was measured using Charlson index with ICD9 codes in medical claims data during the 6‐month period. The inclusion of Charlson index may capture additional time to BP goal associated with presence of comorbid conditions other than BP staging and diabetes/renal diseases. Demographics (age, gender) came from electronic medical records.
Combination drug therapy: Hypertensive patients may have initiated their drug therapy using one drug or a combination of two or more drugs. To identify the type of initial drug therapy, all antihypertensive drugs were classified into either single agent or multiple agent drugs. The type of initial antihypertensive therapy was “one” if the first prescription was filled with a single agent drug. The type was “combination” if the first prescription was filled with a drug containing multiple agents or if multiple prescriptions were filled on the initiation date. The type of initial drug therapy could be modified later during the follow‐up period. This study used the approach of “intent to treat” that considers the modification as an outcome of the initial drug therapy choice. The initiation date was defined as no history of prescription fills with antihypertensive drugs for 6 months prior to the date.
Data analysis
The outcome variable of this study, time to BP goal, had the characteristics of right censoring. Data on time to BP goal did not exist for those patients whose BP goals had not been reached at the 1‐year follow‐up nor for those patients who were lost to follow‐up. Economic literature documents this problem as right‐censoring11 and requires specific techniques for unbiased estimates. This study used the nonparametric Kaplan–Meier survival analysis to produce a survival curve along with 95% confidence limits of median survival time to reach BP goal. Semiparametric proportional hazard model was also run to estimate hazard ratios for the time to BP goal. All analyses were done using SAS statistical software.14
Results
The study sample consisted of hypertensive patients who had initiated antihypertensive drug therapy between July 1, 2002, and December 31, 2003. The total number of prescription drug claims made for two health plan beneficiaries for the 3‐year period 2002–2004 was 86,851. The number of patients who had had an antihypertensive drug filled during the period July 1, 2002, and December 31, 2003, was 983. Of those, excluding the patients who had a history of a prescription fill for any antihypertensive drugs for 6 months prior to the index date based on the continuous insurance eligibility and pharmacy claims data reduced the number to 328. Finally, excluding the patients with nonhypertensive baseline BP yielded the final sample size of 223 (N).
Baseline characteristics of the study sample
Of the total of 223 patients who met the sample selection criteria, the number of patients younger than 40 was 33 (14.80%), and the number of patients 60 years or above was 67 (30.04%) (Table 1). Older patients had higher baseline systolic BPs, comorbidity index, and prior healthcare expenditures. About 52% were female, and baseline BPs, comorbidity, and prior health expenditures were similar between males and females. The number of patients who had stage 1 hypertension was 88 (39.46%) according to their baseline BP. The percentage who had diabetes or renal disease was 21% (47 patients). Those who had diabetes had a higher level of prior healthcare utilization ($2,680 vs. $1,974), although they had baseline systolic BPs similar to those with no diabetes (158.4 vs. 158.0 mmHg).
Table 1.
Description of study patients
| Subjects N (%) | Systolic/Diastolic BP mmHg (STD) | Charlson comorbidity index (STD) | Prior healthcare expenditure $ (STD) | |
|---|---|---|---|---|
| Age | p = 0.0003/p = 0.0007 | p = 0.0043 | p = 0.0916 | |
| <40 | 33 (14.80) | 153.5 (13.3)/95.3 (11.3) | 0.18 (0.58) | 1,173 (1,163) |
| 40–60 | 123 (55.16) | 155.8 (16.8)/95.7 (9.6) | 0.21 (0.87) | 2,069 (3,214) |
| ≥60 | 67 (30.04) | 165.2 (18.0)/88.6 (16.5) | 0.70 (1.33) | 2,664 (3,728) |
| Gender | p = 0.2207/p = 0.0974 | p = 0.7689 | p = 0.3693 | |
| Female | 115 (51.57) | 159.7 (17.8)/92.1 (12.0) | 0.33 (1.03) | 2,304 (2,919) |
| Male | 108 (48.43) | 156.8 (16.5)/95.0 (13.2) | 0.37 (1.02) | 1,915 (3,529) |
| Hypertension Staging† | p = 0.0001/p = 0.0001 | p = 0.1638 | p = 0.6471 | |
| Stage 1 | 88 (39.46) | 145.0 (7.7)/87.0 (7.8) | 0.47(1.09) | 2,238 (2,809) |
| Stage 2 | 135 (60.35) | 166.9 (16.3)/97.8 (13.5) | 0.28(0.97) | 2,035(3,480) |
| Diabetes/renal disease | p = 0.9111/p = 0.0075 | p = 0.0001 | p = 0.1772 | |
| No | 176 (78.92) | 158.4 (16.9)/94.7 (12.7) | 0.14 (0.72) | 1,964 (3,044) |
| Yes | 47 (21.08) | 158.0 (18.7)/89.1 (11.7) | 1.14 (1.50) | 2,680 (3,821) |
| Drug therapy option | p = 0.0117/p = 0.9668 | p = 0.8090 | p = 0.3135 | |
| One | 177 (79.37) | 156.8 (17.1)/93.5 (12.5) | 0.36 (1.06) | 2,004 (2,970) |
| Two or More | 46 (20.63) | 164.0 (16.9)/93.6 (13.3) | 0.32 (0.84) | 2,544 (4,080) |
| Total | 223 (100.00) | 158.3 (17.2)/93.5 (12.7) | 0.35 (1.02) | 2,115 (3,227) |
†
Stage is 1 if baseline systolic BP less than 160 mmHg and/or diastolic BP less than 100 mmHg. Otherwise, Stage = 2. P‐values are from one‐way ANOVA (analysis of variance).
It is likely for hypertensive patients to initiate a combination drug therapy when they have hypertension more severe than stage 1. The number of patients who took two or more drugs was 46 (20.63%), which is a much smaller number compared to the number of stage 2 hypertensive patients (135). In other words, physicians were not yet receptive to JNC 7 guidelines that recommend two or more drugs as first‐line drug therapy for stage 2 hypertension. Although stage 2 hypertensive patients had higher baseline BPs than did stage 1 hypertensive patients, they had lower comorbidity (0. 28 vs. 0.47) and prior healthcare utilization ($2,035 vs. $2,238). However, the patients who took two or more drugs had higher prior healthcare utilizations ($2,544 vs. $2,004). They also had higher baseline systolic BPs (164 vs. 156.8).
Median time to reach BP goal
Major aims of this study were to compare time to reach BP goal and to identify factors associated with time to BP goal. According to Kaplan–Meier survival analyses (Table 2), the median number of months that patients took to reach BP goal was 3.25 months (95% CI: 2.49–4.82). The survival curves revealed that patients with stage 2 hypertension were less likely to reach BP goal than were those with stage 1 hypertension (Figure 3). In fact, patients with stage 2 hypertension took significantly longer than did those with stage 1 hypertension (3.81 vs. 2.82 months). Further, patients with diabetes/renal disease took more than twice long as did those without the condition (6.60 vs. 2.85 months). There were no significant differences between gender and age groups. Neither initial drug therapy option had significant impact on median times to reach BP goal.
Table 2.
Comparative analyses of time to BP goals (Kaplan–Meier methods)
| Variables | Median months to BP goals | 95% confidence interval |
|---|---|---|
| Initial drug therapy | ||
| One drug | 3.18 | 2.20–4.82 |
| Two or more drugs | 4.01 | 2.23–7.62 |
| Age | ||
| <40 years | 2.79 | 2.06–3.64 |
| 40–60 | 4.46 | 0.95–N/A |
| 60 or older | 6.01 | 2.92–7.95 |
| Gender | ||
| Male | 4.46 | 2.23–6.43 |
| Female | 2.92 | 1.97–3.81 |
| Hypertension staging | ||
| Stage 1 | 2.82 | 1.54–4.46 |
| Stage 2 | 3.81 | 2.59–6.43 |
| Diabetes/renal diseases | ||
| No | 2.85 | 2.06–3.81 |
| Yes | 6.60 | 3.25–9.55 |
| Total | 3.25 | 2.49–4.82 |
Figure 3.
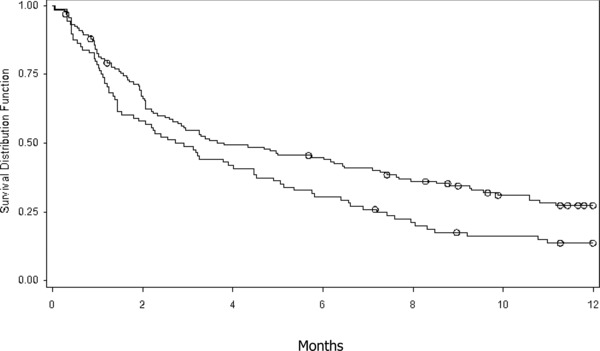
Time to BP goal controlling for BP stages. Top line = stage 2 hypertension; bottom line = stage 1 hypertension circle = censored observations.
Proportional hazard model
To identify characteristics of patients who were less likely to reach BP goal, this study performed a proportional hazard survival analysis (Table 3 and Figure 4). We expected comorbidity and disease severity to affect the likelihood of reaching BP goal. As expected, patients with diabetes/renal diseases were less likely to reach BP goal; the hazard ratio (HR) was 0.65 (p = 0.04). Further, patients with higher comorbidity indices and higher baseline systolic BPs were less likely to reach BP goal than were the respective comparison groups. Patients with more comorbid conditions were less like to reach BP goal; i.e., the HR for Charlson comorbidity index was 0.82 (p = 0.026). Patients were also less likely to reach BP goal with increased systolic baseline BP (HR = 0.84, p < 0.001). Interestingly, baseline diastolic BPs were not significantly associated with the likelihood of reaching BP goal. On the other hand, an increase in prior healthcare utilization was associated with a slightly higher likelihood of reaching BP goal (HR = 1.01, p = 0.008). Factors that were not significantly associated with time to BP goal were initial drug therapy options, gender, and age.
Table 3.
Factors associated with time to BP goals
| Factors | Parameter estimate | SE | Chi‐square | p | Hazard ratio |
|---|---|---|---|---|---|
| Age | |||||
| 40–60 (Reference) | |||||
| Age < 40 | –0.355 | 0.256 | 1.93 | 0.164 | 0.701 |
| Age ≥ 60 | –0.105 | 0.199 | 0.28 | 0.595 | 0.900 |
| Gender | |||||
| Male (Reference) | |||||
| Female | 0.150 | 0.160 | 0.88 | 0.345 | 1.163 |
| Initial drug therapy options | |||||
| Mono (Reference) | |||||
| Two or more | –0.209 | 0.200 | 1.09 | 0.294 | 0.811 |
| Charlson comorbidity | –0.195 | 0.088 | 4.95 | 0.026 | 0.822 |
| Prior healthcare expenditure | 0.007 | 0.002 | 7.03 | 0.008 | 1.007 |
| Diabetes/renal diseases | |||||
| No (Reference) | |||||
| Yes | –0.434 | 0.216 | 4.02 | 0.044 | 0.648 |
| BP at baseline | |||||
| Systolic | –0.180 | 0.054 | 11.12 | 0.001 | 0.835 |
| Diastolic | –0.068 | 0.064 | 1.14 | 0.284 | 0.934 |
Cox Proportional Hazard Model. SE = standard error.
Figure 4.
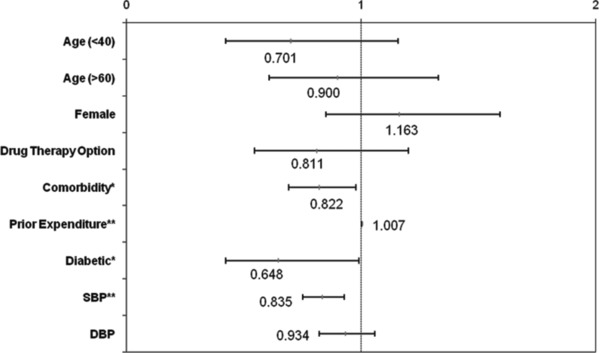
Hazard ratios and their 95% confidence intervals for various risk factors. *p <0.05, **p <0.01.
Discussion
Patients participating in this study took 3.25 months (15.2 weeks) to reach BP goal. The median time to BP goal was substantially longer than 8.1 weeks reported from a controlled clinical trial.8 The difference may have resulted from different study settings. Patients in this study were from a real‐world practice setting, in which it is entirely up to patients to get prescriptions filled and to take medicine as prescribed. They may have certain beliefs and preferences that affect drug therapy options and medication adherence. They also may have limited access to medication and thus be forced to skip medication. Further, they simply forget taking pills in certain circumstances. Subsequently, they can suffer from poor medication adherence and thus may have longer times to BP goal than do those participating in controlled clinical trials. Study participants in controlled clinical trials do not have the medication non‐adherence problem because they are monitored to take medications as required. It is well known that findings of controlled clinical trials often do not translate into real‐world practice.10
Often, physicians expect their patients to achieve the same result that has been documented in a controlled clinical trial. However, the expectation can be unrealistic for real‐world patients. Physicians who change treatment plans frequently based on unrealistic expectations are likely to put their patients at risk of adverse outcomes. Patients may not be able to accrue treatment benefits when they lose motivation to continue potentially beneficial treatment plans.
While this study found a longer time to BP goal than in the controlled clinical trial, patients could be better served. Our approach is more patient‐centric, because it better reflects real‐world conditions facing patients. It helps patients and physicians alike set realistic timeframes in reaching BP goal. Patient‐centric timeframes in reaching BP goal from drug therapy initiation are useful to improve quality of medication therapy.
This study found that comorbidity and disease severity play important roles in the likelihood of reaching BP goal. Patients with comorbid conditions such as diabetes had a lower likelihood of reaching BP goal than did those without the conditions (HR = 0.648, p = 0.044). Likewise, the likelihood was lower as hypertension became more severe (HR = 0.835, p = 0.001). Further, prior healthcare utilization was also associated with the likelihood of reaching BP goal (HR = 1.007, p = 0.008). These findings suggest that setting a patient‐centric timeline in reaching BP goal should reflect different patient characteristics.
We found that time to BP goal was associated with systolic BP but not with diastolic BP. Traditionally, guidelines and practices have placed greater importance on controlling diastolic rather than systolic BP.15 However, recent evidence indicates that high systolic BPs are associated with increased risks of cardiovascular diseases and mortalities.16, 17 The significant association with systolic BP but not with diastolic BP goal may suggest the importance of controlling systolic BP. However, it is far from disputing the importance of controlling diastolic BPs. It may simply mean that study participants have certain characteristics favoring significant findings on systolic BP. In fact, the study patients were hypertensive because of higher systolic BPs, not because of higher diastolic BPs. Among patients with stage 1 hypertension, the average diastolic BP was normal while average systolic BP was 5 mmHg above normal. Therefore, time to BP goal would have had a significant association with systolic BP rather than with diastolic BP.
JNC 7 now recommends two or more drugs for patients with stage 2 hypertension.2 We were interested in examining whether combining two or more drugs for initial drug therapy reduced time to BP goal. Our study found that the combination drug therapy did not have a significant association with time to BP goal, a finding that does not coincide with other studies.8, 9, 18 We can only speculate that patients who believed their hypertension harder to control might have asked their physician to prescribe the combination drug therapy. Or conversely, physicians might have prescribed the combination drug therapy for patients who they perceived would take longer times to reach BP goal. It is also possible that patients who believed they could control hypertension with lifestyle modification might have asked for a single drug therapy over a combination therapy. When patients adhere strictly to lifestyle modification, they can certainly control hypertension without much help from drug therapy, i.e., lifestyle modification is the most effective way to control hypertension.19, 20 This study did not control for variables related to lifestyle modification. Future studies should take into consideration lifestyle modification when assessing factors associated with patient‐centric time to BP goal.
Limitations
The study population came from a medical group in a Southeastern state, so the study findings may not be generalized to other settings. Although it is difficult to find reasons why different medical groups and regions have different impacts on the way patients control hypertension, it is always possible that a particular medical group could generate idiosyncratic data. For example, the study population all had private health insurance as well as prescription drug benefits. Thus, generalizing the study findings to other populations such as Medicare and Medicaid should be limited.
The AHA scientific statement of 2007 updated the guidelines on pharmacological treatment of hypertension.21 No changes were made to the BP goals for high‐risk patients with diabetes or chronic kidney diseases. However, the category of high risk patients who need aggressive drug therapy was expanded to include patients with left ventricular dysfunction, patients with coronary artery disease (CAD) risk equivalents, patients with documented CAD, and patients with a 10‐year Framingham risk assessment score of 10% or greater. The data of this study could not answer whether the changes in guidelines have translated into clinical practice because they were generated before the guideline changes. Future studies need to examine what impact the guideline changes would have on patient‐centric time to BP goals when the expanded category of high‐risk patients was controlled for.
The JNC 7 recommended thiazide diuretics as the gold standard for noncomplicated hypertension. It would have been worthwhile to control for different drug classes of initial drug therapy such as thiazide diuretics. However, it would have required a larger sample size to find statistical significance; use of thiazide diuretics was not prevalent among the study sample. Further, the 2007 AHA scientific statement no longer recommends any single agent as preferred first‐line drug therapy.
Hypertension can be controlled not only through drug therapy but also through lifestyle changes such as diet, exercise, and stress management. Estimating time to BP goal could lead to bias when the effects of lifestyle changes are not controlled. Future studies need to include variables related to lifestyle modification to accurately identify the contributions each factor makes to time to BP goal.
Conclusions
This study found that hypertensive patients in a real‐world practice setting had longer times to reach BP goal than did those in a controlled experimental setting. Therefore, in making drug therapy decisions to control hypertension, healthcare practitioners need to be mindful of expecting faster time to BP goal based on controlled clinical trials. Patients in real‐world settings are likely to face difficulties adhering to medication therapy.
Source of Funding
Holston Medical Group located in East Tennessee provided funding for this study.
References
- 1. Hajjar I, Kotchen TA. Trends in prevalence, awareness, treatment, and control of hypertension in the United States, 1988–2000. JAMA. 2003; 290: 199–206. [DOI] [PubMed] [Google Scholar]
- 2. The Seventh Report of the Joint National Committee on Prevention , Detection, Evaluation, and Treatment of High Blood Pressure: The JNC 7 Report. JAMA. 2003; 289: 2560–2572. [DOI] [PubMed] [Google Scholar]
- 3. Weber Cullen K, Baranowski T, Smith SP. Using goal setting as a strategy for dietary behavior change. J Am Diet Assoc. 2001; 101(5): 562–566. [DOI] [PubMed] [Google Scholar]
- 4. Bovend'Eerdt TJ, Botell R, Wade DT. Writing SMART rehabilitation goals and achieving goal attainment scaling: a practical guide. Clin Rehabil. 2009; 23(4): 352–361. [DOI] [PubMed] [Google Scholar]
- 5. Steenbeek D, Gorter JW, Ketelaar M, Galama K, Lindeman E. Responsiveness of goal attainment scaling in comparison to two standardized measures in outcome evaluation of children with cerebral palsy. Clin Rehabil. 2011; 25(12): 1128–1139. [DOI] [PubMed] [Google Scholar]
- 6. Zedlitz AM, Fasotti L, Geurts AC. Post‐stroke fatigue: a treatment protocol that is being evaluated. Clin Rehabil. 2011; 25(6): 487–500. [DOI] [PubMed] [Google Scholar]
- 7. Hansson L. Evaluation of endpoints in hypertension. Blood Press Suppl. 1997; 2: 76–80. [PubMed] [Google Scholar]
- 8. Weir MR, Levy D, Crikelair N, Rocha R, Meng X, Glazer R. Time to achieve blood‐pressure goal: influence of dose of valsartan monotherapy and valsartan and hydrochlorothiazide combination therapy. Am J Hypertens. 2007; 20(7): 807–815. [DOI] [PubMed] [Google Scholar]
- 9. Nash DT, Crikelair N, Zappe D. Achieving BP goals with valsartan and HCTZ alone and in combination: pooled analysis of two randomized, double‐blind, placebo‐controlled studies. Curr Med Res Opin. 2008; 24(9): 2617–2626. [DOI] [PubMed] [Google Scholar]
- 10. Laupacis A. What are the advantages and disadvantages of randomized controlled trials for guiding health policy?. International Society of Technology Assessment in Health Care Meet. 1993; 9: 27. [Google Scholar]
- 11. Maddala,GS . Limited‐Dependent and Qualitative Variables in Econometrics. New York: Cambridge University Press; 1983. [Google Scholar]
- 12. Martin BC, Miller LS, Dorfman J, Kotzan JA. Advancing risk adjustment for schizophrenia. Presented at the Annual International Society for Pharmacoeconomics and Outcomes Research European Conference, Barcelona, Spain: November 10, 2003. [Google Scholar]
- 13. Curkendall SM, Mo J, Glasser DB, Rose Stang M Jones JK. Cardiovascular disease in patients with schizophrenia in Saskatchewan, Canada. J Clin Psychiatry. 2004; 65(5): 715–720. [DOI] [PubMed] [Google Scholar]
- 14. Statistical Analysis System (SAS) . [computer program]. Version 9.3. Cary, NC: SAS Institute; 2012. [Google Scholar]
- 15. Report of the Joint National Committee on Detection , Evaluation, and treatment of high blood pressure: a cooperative study. JAMA. 1977; 237: 255–261. [PubMed] [Google Scholar]
- 16. He J, Whelton PK. Elevated systolic blood pressure as a risk factor for cardiovascular and renal disease. J Hypertens Suppl. 1999; 17: S7–S13. [PubMed] [Google Scholar]
- 17. Tin LL, Beevers DG, Lip GYH. Systolic vs diastolic blood pressure and the burden of hypertension. J Hum Hypertens. 2002; 16: 147–150. [DOI] [PubMed] [Google Scholar]
- 18. Jamerson KA, Nwose O, Jean‐Louis L, Schofield L, Purkayastha D, Baron M. Initial angiotensin‐converting enzyme inhibitor/calcium channel blocker combination therapy achieves superior blood pressure control compared with calcium channel blocker monotherapy in patients with stage 2 hypertension. Am J Hypertens. 2004; 17: 495–501. [DOI] [PubMed] [Google Scholar]
- 19. Whelton SP, Chin A, Xin X, He J. Effect of aerobic exercise on blood pressure: a meta‐analysis of randomized, controlled trials. Ann Intern Med. 2002; 136: 493–503. [DOI] [PubMed] [Google Scholar]
- 20. Appel LJ, Moore TJ, Obarzanek E, Vollmer WM, Svetkey LP, Sacks FM, Bray GA, Vogt TM, Cutler JA, Windhauser MM, et al. A clinical trial of the effects of dietary patterns on blood pressure. DASH Collaborative Research Group. N EngI J Med. 1997; 336: 1117–1124. [DOI] [PubMed] [Google Scholar]
- 21. Rosendorff C, Black HR, Cannon CP, Gersh BJ, Gore J, Izzo JL Jr Kaplan, NM , O‘Connor CM, O‘Gara PT, Oparil S. Treatment of hypertension in the prevention and management of ischemic heart disease: a scientific statement from the American Heart Association Council for High Blood Pressure Research and the Councils on Clinical Cardiology and Epidemiology and Prevention. Circulation. 2007; 115(21): 2761–2788. Available at: http://www.ncbi.nlm.nih.gov/pubmed/17502569. Accessed July 20, 2012. [DOI] [PubMed] [Google Scholar]