Abstract
Glaucoma is the second leading cause of blindness worldwide. Physicians often use surrogate endpoints to monitor the progression of glaucomatous neurodegeneration. These approaches are limited in their ability to quantify disease severity and progression due to inherent subjectivity, unreliability, and limitations of normative databases. Therefore, there is a critical need to identify specific molecular markers that predict or measure glaucomatous neurodegeneration. Here, we demonstrate that growth differentiation factor 15 (GDF15) is associated with retinal ganglion cell death. Gdf15 expression in the retina is specifically increased after acute injury to retinal ganglion cell axons and in a murine chronic glaucoma model. We also demonstrate that the ganglion cell layer may be one of the sources of secreted GDF15 and that GDF15 diffuses to and can be detected in aqueous humor (AH). In validating these findings in human patients with glaucoma, we find not only that GDF15 is increased in AH of patients with primary open angle glaucoma (POAG), but also that elevated GDF15 levels are significantly associated with worse functional outcomes in glaucoma patients, as measured by visual field testing. Thus, GDF15 maybe a reliable metric of glaucomatous neurodegeneration, although further prospective validation studies will be necessary to determine if GDF15 can be used in clinical practice.
Keywords: Ophthalmology
Growth differentiation factor 15 is associated with retinal ganglion cell death and is increased in aqueous humor of patients with primary open angle glaucoma.
Introduction
Glaucoma is the second leading cause of blindness around the world (1). It is a group of heterogeneous diseases characterized by neuroretinal degeneration associated with death of retinal ganglion cells (RGCs), which in turn leads to optic neuropathy. In glaucoma, progressive optic neuropathy, if left untreated, leads to visual field (VF) defects that may ultimately result in irreversible blindness.
Numerous factors — including genetics and race, as well as ocular characteristics such as intraocular pressure (IOP) and central corneal thickness — have been identified as risk factors in the development and progression of glaucoma (2). Currently, all medical and surgical therapies for glaucoma focus on lowering IOP as a strategy to protect RGCs from cell death. Although neuroprotection for glaucoma would be highly desirable, therapeutic strategies that have focused on neuroprotection have thus far failed to demonstrate efficacy in clinical trials, with no agents currently approved by regulatory authorities (3).
Another impediment for effective glaucoma treatment is the paucity of molecular markers that predict progression of glaucomatous neurodegeneration that results in optic neuropathy (4). Treating physicians have generally relied on VF testing, IOP measurement, and optic nerve monitoring as metrics for assessing whether disease is adequately controlled (5). However, the nature of VF testing, lack of precise correlation of IOP with disease risk, and lack of validated normative databases for optic nerve imaging techniques, such as optical coherent tomography (OCT), contribute to the persistent challenges of glaucoma management. Of significant concern, these evaluations presently form the basis for treatment decisions regarding additional medical and surgical interventions to prevent disease progression and vision loss (6). Therefore, there is an acute need to identify specific molecular markers that quantify glaucomatous neurodegeneration by accurately and objectively measuring RGC-specific cell death.
In this study, we have, to our knowledge, characterized in mice and rats a novel molecular marker of glaucomatous neurodegeneration. We have further validated our findings in human glaucoma patients with varying degrees of disease severity. These results highlight a protein with potential use as a marker of glaucomatous neurodegeneration.
Results
Gdf15 expression is selectively increased in the retina following RGC axonal injury.
Our goal was to identify specific markers of RGC death that could potentially be used to accurately and reliably predict or measure glaucomatous neurodegeneration. Given the strong association between neuroinflammation and glaucomatous optic neuropathy (7), we performed a retinal cytokine/growth factor–focused PCR array consisting of 88 genes (ILs, TNF and TGF superfamilies, growth factors, interferons, chemokines, and others) to identify factors whose expression correlates specifically with RGC death. In order to identify factors unique to RGC death, we used 3 different murine models of disease: optic nerve crush (ONC) as a model of axonal injury and RGC-specific death as seen in glaucoma, light-induced retinal degeneration (RD) as a model of photoreceptor-specific cell death, and endotoxin-induced uveitis (EIU) as a model of ocular inflammation (8–10). By comparing the retinal gene expression profiles associated with these 3 murine models of disease and focusing specifically on factors that are uniquely identified in the ONC model but not the RD and EIU models, we could identify the factors that were uniquely associated with RGC death.
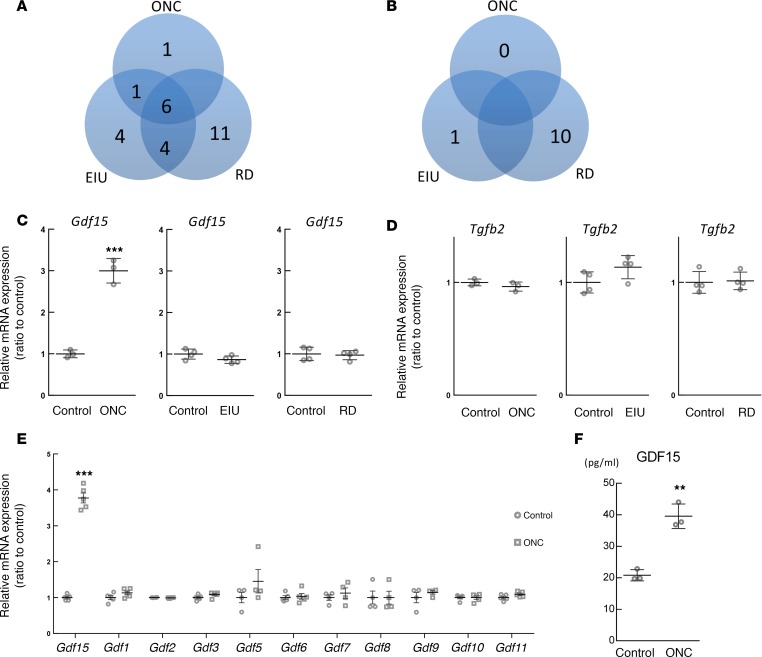
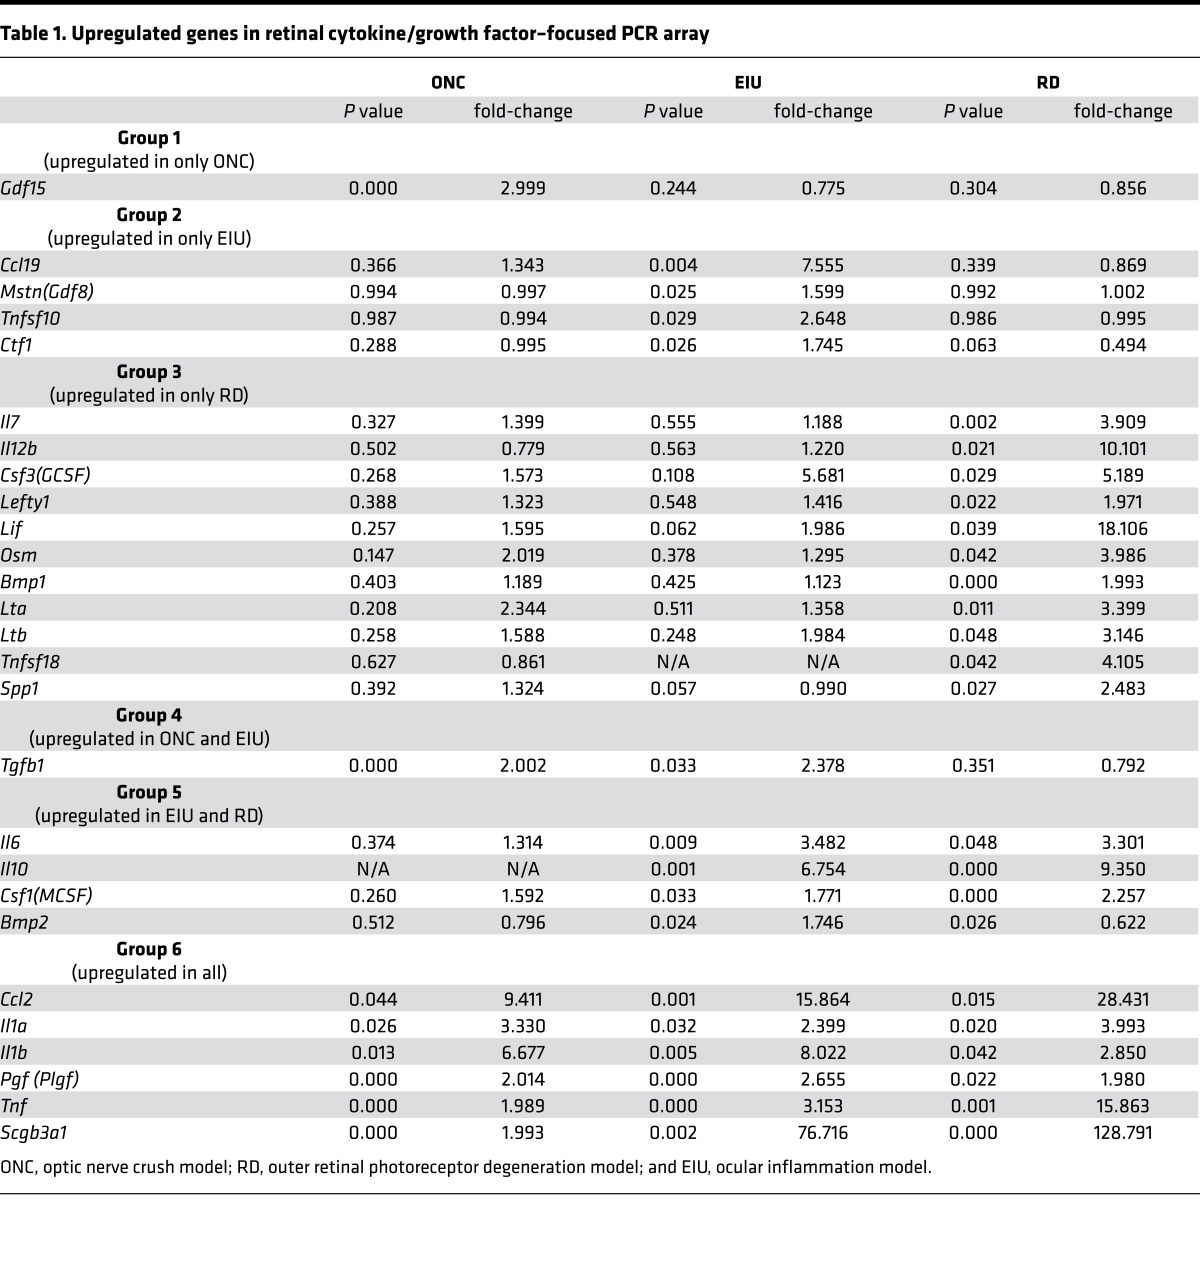
The results from the retinal cytokine/growth factor–focused array revealed that growth differentiation factor-15 (Gdf15), a member of the transforming growth factor-β (TGF-β) superfamily, was the only gene that was significantly altered in retinas 24 hours after ONC but not after RD and EIU (Figure 1, A–C, Table 1, and Supplemental Table 1; supplemental material available online with this article; https://doi.org/10.1172/jci.insight.91455DS1). We also examined Gdf15 gene expression in the retina at time points later than 24 hours in all 3 disease models. The results showed that there was no significant increase of Gdf15 in the retina of both EIU and RD models (Supplemental Figure 1, B and C), while Gdf15 expression in ONC model retina was significantly increased even at 72 hours (Supplemental Figure 1A).
Figure 1. Gdf15 expression is selectively increased in the retina following retinal ganglion cell (RGC) axonal injury.
(A) Venn diagram of upregulated genes in retinal cytokine/growth factor–focused PCR array (n = 3 for optic nerve crush [ONC] and its control, n = 4 for endotoxin-induced uveitis [EIU] and its control, n = 4 for light-induced retinal degeneration [RD] and its control). (B) Venn diagram of downregulated genes in retinal cytokine/growth factor–focused PCR array. (C) Retinal gene expression of Gdf15 from PCR array in ONC, EIU, and RD models 24 hours after each intervention. (D) Retinal gene expression of Tgfb2 from PCR array in ONC, EIU, and RD models 24 hours after each intervention. (E) Retinal gene expressions of growth differentiation factor family members 24 hours after ONC (n = 4–5 per group). (F) GDF15 protein level in aqueous humor (AH) 24 hours after ONC (n = 3 per group). Values are mean ± SD. **P < 0.01 and ***P < 0.001 by 2-tailed unpaired t test.
Table 1. Upregulated genes in retinal cytokine/growth factor–focused PCR array.
We also examined Tgfb2 gene expression in the retina because of its previously described association with human primary open angle glaucoma (POAG) (11–13) and because GDF15 is a member of the TGF-β superfamily (14). In terms of rodent models of glaucoma, no rodent glaucoma model has convincingly demonstrated elevated Tgfb2 gene expression in the retina. However, given the reported associations with human POAG, it was important to examine the specificity of Gdf15 by using Tgfb2 as a control. The result showed that the expression of Tgfb2 in the retina was unchanged in all 3 disease models 24 hours after each treatment (Figure 1D). Of interest, expression of other growth differentiation factor family members were unchanged in the retina 24 hours after ONC (Figure 1E).
To determine whether these changes in Gdf15 gene expression after ONC led to differences in protein secretion, we analyzed GDF15 protein level in aqueous humor (AH) of eyes after ONC. ELISA measurements showed that GDF15 levels in AH were significantly increased 24 hours after ONC (Figure 1F). These results suggest that GDF15 may be a specific molecular marker of RGC death following axonal injury to the optic nerve.
GDF15 protein level in AH is not affected by aging.
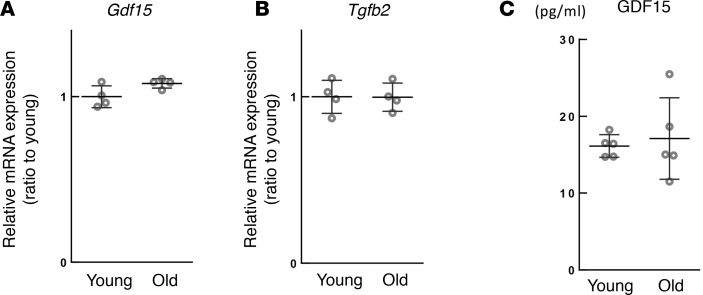
The incidence of glaucoma increases exponentially with aging (15). Therefore, an effective molecular marker of glaucomatous neurodegeneration must be able to discriminate between physiologic aging and the transition to age-associated eye diseases such as glaucoma. To determine whether Gdf15 expression changes with age, we examined the retina and AH of young (6-week-old) and old (18-month-old) mice for Gdf15 gene expression and GDF15 protein levels, respectively. We found no difference between young and old mice in the expression of Gdf15 (Figure 2A) and Tgfb2 (Figure 2B) in the retina. In addition, GDF15 protein levels in AH were also unaffected by aging (Figure 2C). These results suggest that GDF15 may be able to discriminate between aging and glaucomatous neurodegeneration and may, therefore, be useful as a molecular marker of glaucomatous neurodegeneration.
Figure 2. GDF15 in aqueous humor (AH) is not affected by aging.
(A) Retinal gene expression of Gdf15 in young (6 weeks old) and old (18 months old) mice (n = 4 per group). (B) Retinal gene expression of Tgfb2 in young and old mice (n = 4 per group). (C) GDF15 protein level in AH in young and old mice (n = 5 per group). Values are mean ± SD.
Gdf15 expression was increased only in the ganglion cell layer (GCL) following axonal injury to the optic nerve.
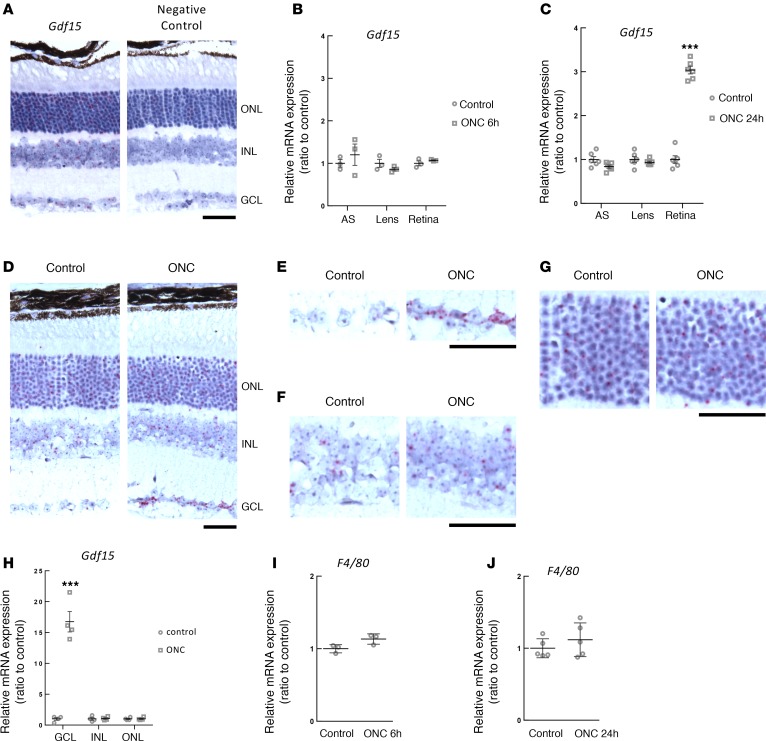
To localize Gdf15 expression in the eye, we performed in situ hybridization. The results showed that Gdf15 was minimally expressed at baseline in the retina (Figure 3A), cornea (Supplemental Figure 2A), lens (Supplemental Figure 2B), and ciliary processes (Supplemental Figure 2C). In the retina, Gdf15 expression was present in the GCL, the inner nuclear layer (INL), and the outer nuclear layer (ONL) (Figure 3A).
Figure 3. Ganglion cell layer (GCL) showed increased Gdf15 expression following axonal injury to the optic nerve.
(A) In situ hybridization of Gdf15 in the mid peripheral retina (n = 3 per group, representative pictures are shown). ONL, outer nuclear layer; INL, inner nuclear layer; GCL, ganglion cell layer. Scale bar: 50 μm. (B and C) Gene expression of Gdf15 in anterior segment (AS), lens, and retina (B) 6 hours (n = 3 per group) and (C) 24 hours after optic nerve crush (ONC) (n = 6 per group). (D) In situ hybridization of Gdf15 in the mid-peripheral retina 24 hours after ONC (n = 4 per group, representative pictures are shown). Scale bar: 50 μm. (E–G) High-magnification images from D. Scale bar: 50 μm. (E) In situ hybridization of Gdf15 24 hours after ONC in GCL. (F) In situ hybridization of Gdf15 24 hours after ONC in INL. (G) In situ hybridization of Gdf15 24 hours after ONC in ONL. (H) Gdf15 gene expression in GCL, INL, and ONL of the retina following the isolation by laser microdissection 24 hours after ONC (n = 4 per group). (I and J) F4/80 gene expression in the retina (I) 6 hours (n = 3 per group) and (J) 24 hours after ONC (n = 5 per group). Values are mean ± SD. ***P < 0.001 by 2-tailed unpaired t test.
Given these numerous potential sources of secreted GDF15, we sought to determine the cellular source of increased GDF15 in AH following axonal injury to the optic nerve. In order to do so, we analyzed different tissue compartments within the ONC eyes. We analyzed the anterior segment (AS) of the eye (including cornea, trabecular meshwork, iris, ciliary body, and ciliary processes), lens, and retina. Increased Gdf15 expression was observed only in the retina 24 hours after ONC (Figure 3, B and C), with no change in Gdf15 expression in the AS and lens (Figure 3, B and C, and Supplemental Figure 3, A–C).
To determine which cells within the retina were the sources of increased Gdf15 expression, we performed in situ hybridization of Gdf15 in the retina 24 hours after ONC. The results showed that expression of Gdf15 was increased in GCL, but not in INL and ONL (Figure 3, D–G). To obtain more accurate quantification of Gdf15 expression in specific retinal layers, we performed laser microdissection (LMD), separating the retina into GCL, INL, and ONL. As predicted, only the GCL — but not the INL and ONL — showed increased Gdf15 expression 24 hours after ONC (Figure 3H). These results indicate that GCL may be one of the sources of the increased GDF15 secretion after axonal injury to the optic nerve.
Although we found that GCL may be the source of the increased GDF15 in AH after axonal injury to the optic nerve, it has previously been reported that Gdf15 is also upregulated in macrophages in response to a variety of stimuli, including IL1B, TNFA, IL2, and TGFB (16). As some of these cytokines/growth factors were also found to be upregulated in eyes after ONC (Table 1), it remained possible that macrophages infiltrating into the retina and localizing to the GCL were the source of the secreted GDF15. To quantify the extent of macrophage infiltration into the retinas after ONC, we analyzed retinal F4/80 expression as a measure of macrophage infiltration. Quantitative PCR (qPCR) analysis, as well as IHC, demonstrated that there was no significant change in F4/80 expression or macrophage infiltration into the retina after ONC compared with controls (Figure 3, I and J, and Supplemental Figure 4). These results validated that macrophages were not the major sources of secreted GDF15 in AH following axonal injury to the optic nerve.
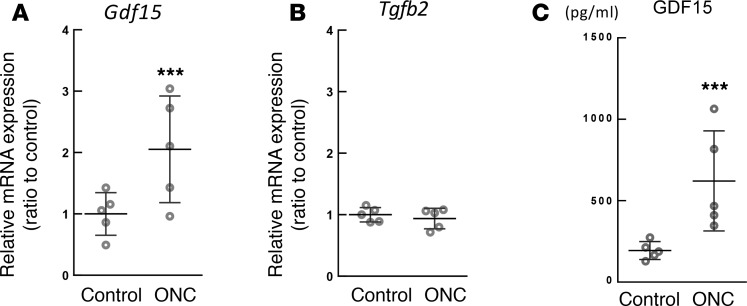
To confirm the generalizability of these results, we also measured GDF15 level in rat AH after ONC. Similar to the results obtained in mice, we found a significant increase in the expression of Gdf15 after ONC (Figure 4A) in the retina, while Tgfb2 expression in the retina remained unchanged (Figure 4B). In addition, ELISA confirmed a significant increase in GDF15 protein levels in AH after ONC (Figure 4C).
Figure 4. Elevated GDF15 level in aqueous humor (AH) of rats following optic nerve crush (ONC).
(A) Gdf15 expression in the retina of rats 24 hours after ONC (n = 5 per group). (B) Tgfb2 expression in the retina of rats 24 hours after ONC (n = 5 per group). (C) GDF15 protein level in AH of rats 24 hours after ONC (n = 5 per group). Values are mean ± SD. ***P < 0.001 by 2-tailed unpaired t test.
GDF15 level in AH is elevated in a murine chronic glaucoma model.
ONC causes acute axonal injury of RGCs, while axonal injury of RGCs in a majority of human glaucoma is chronic. As such, we were interested in validating our findings in an established model of chronic glaucoma.
We chose DBA/2J mouse strain as a model of chronic glaucoma. DBA/2J mouse strain is considered to be a model of chronic, pigmentary glaucoma that is characterized by pigment liberation throughout the AS (17–19). Iris pigment dispersion and subsequent iris stromal atrophy in DBA/2J mice are caused by mutations in the Gpnmb and Tyrp1 genes, respectively (18, 20). Pigment dispersion becomes evident at 5–6 months, and IOP elevation can be detected in most DBA/2J mice by the age of 9 months (17). These changes were followed by the death of RGCs, optic nerve atrophy, and optic nerve cupping (17). Thus, DBA/2J mouse strain is widely used to evaluate mechanisms of pressure-related chronic ganglion cell death and optic nerve atrophy. We used 1-year-old DBA/2J mice as a model for chronic glaucoma and compared them to 3-month-old DBA/2J mice with normal IOP as controls.
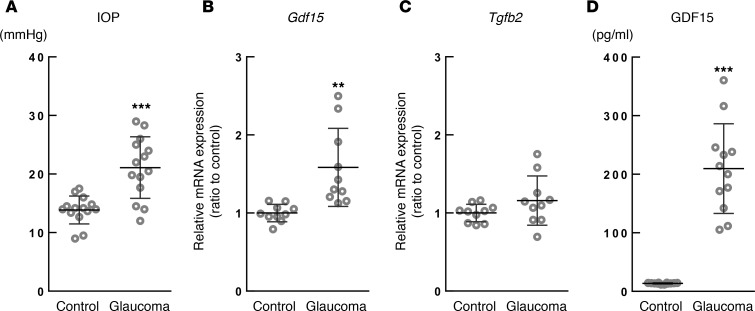
As predicted, IOP was significantly elevated in the glaucoma group (1-year-old DBA/2J mice) compared with control group (3-month-old DBA/2J mice) (Figure 5A). We also confirmed a significant decrease of RGC counts in the glaucoma group (Supplemental Figure 5, A and B). As seen in the ONC model, we found a significant increase in the expression of Gdf15 (Figure 5B) in the retina of mice with glaucoma compared with control mice, while there was no difference in retinal Tgfb2 expression (Figure 5C). In addition, ELISA confirmed a significant increase in GDF15 protein levels in AH of mice with glaucoma when compared with control mice (Figure 5D).
Figure 5. Elevated GDF15 level in aqueous humor (AH) of chronic glaucoma mouse model.
(A) Intraocular pressure (IOP) of control (3-month-old DBA/2J mice) and glaucoma (1-year-old DBA/2J mice) (n = 14 per group). (B) Gdf15 expression in the retina of control and glaucoma mice (n = 10 per group). (C) Tgfb2 expression in the retina of control and glaucoma mice (n = 10 per group). (D) GDF15 protein level in AH of control and glaucoma mice (n = 12 per group). Values are mean ± SD. **P < 0.01 and ***P < 0.001 by 2-tailed unpaired t test.
These findings suggest that the increase in GDF15 protein level in AH after axonal injury to the optic nerve is potentially generalizable to mouse glaucoma and further strengthens the possibility that it may represent a valuable molecular marker of glaucomatous neurodegeneration.
GDF15 levels in AH of POAG patients are significantly associated with mean deviation measured by VF testing.
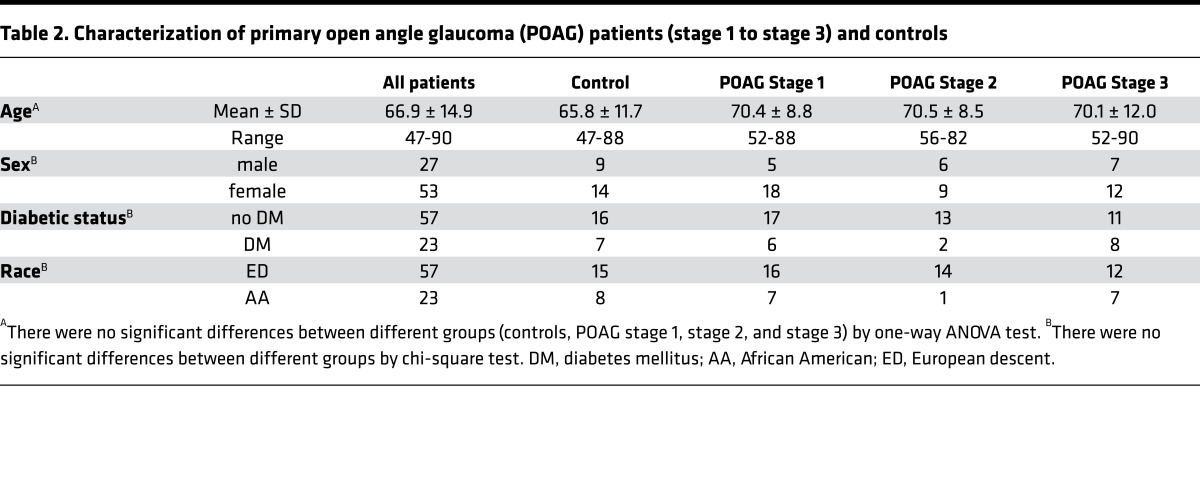
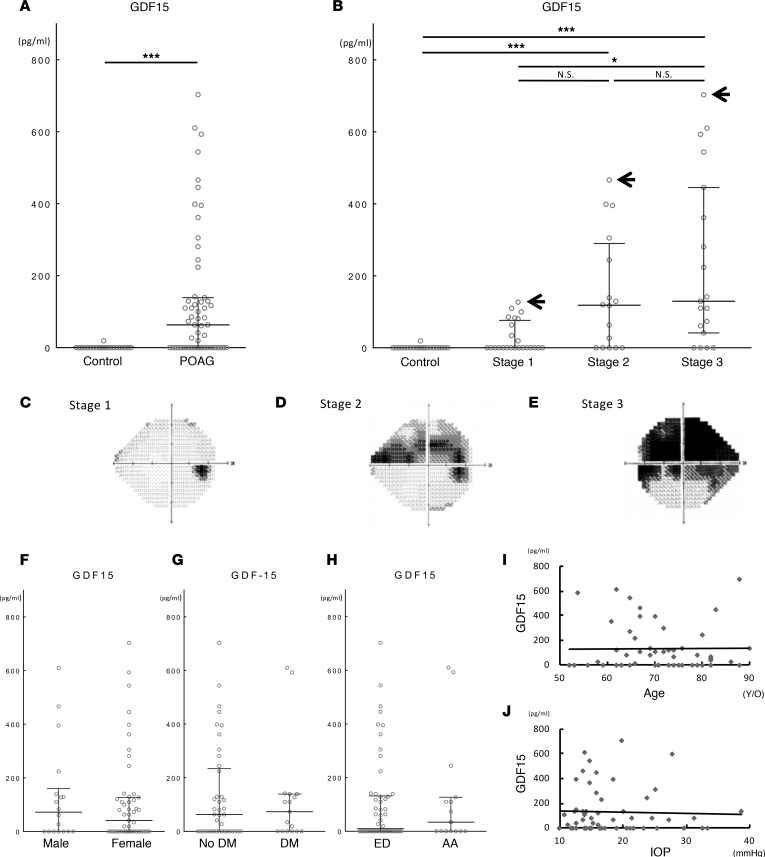
To determine how well GDF15 can quantify the glaucomatous neurodegeneration, we analyzed the GDF15 protein levels in AH of patients with POAG and controls without glaucoma. As described in the Methods, POAG patients were classified into 3 groups with increasing severity of disease using Hodapp-Parrish-Anderson (HPA) criteria (21). Demographic data for POAG patients and controls without glaucoma are shown in Table 2. There were no significant differences in age (Table 2, Supplemental Figure 6), sex, diabetic status, and race (Table 2) between the different groups (control and POAG stage 1, stage 2, and stage 3). AH was collected prior to surgical intervention as described in the Methods. Consistent with the results of animal experiments, POAG patients had significantly higher levels of GDF15 (median, 63.4 pg/ml; mean, 131.3 pg/ml) in their AH compared with controls (median, 2.0 pg/ml; mean, 2.7 pg/ml) (Figure 6A). In addition, GDF15 levels were not only higher in AH of POAG patients, but also demonstrated trends of increased levels with increasing severity of disease (Figure 6, B–E). Importantly, among all POAG patients, GDF15 levels did not differ by sex (Figure 6F), diabetic status (Figure 6G), and race (Figure 6H) and were not correlated with age (Figure 6I) and average IOP (Figure 6J). Furthermore, there were no significant differences in topical glaucoma medications prescribed for POAG patients in various categories (Supplemental Figure 7A) or the type of surgery performed for POAG patients at the time of sample collection (Supplemental Figure 7B).
Table 2. Characterization of primary open angle glaucoma (POAG) patients (stage 1 to stage 3) and controls.
Figure 6. Elevated GDF15 level in aqueous humor (AH) of primary open angle glaucoma (POAG) patients.
(A) GDF15 protein level in AH of control patients (n = 23) and POAG patients (n = 57). ***P < 0.001 by Mann Whitney U test. (B) GDF15 protein level in control patients (n = 23) and POAG stage 1 (n = 23), stage 2 (n = 15), and stage 3 (n = 19) patients. P < 0.001 by Kruskal-Wallis test. *P < 0.05 and ***P < 0.001 by Dunn’s multiple comparison. Arrows in the graph indicate an individual case for each stage of POAG with the highest GDF15 level in AH for which the visual fields are illustrated. (C–E) Representative visual field images of POAG patient for (C) stage 1: 76 y/o, male, OD, MD: –1.63, GDF15: 126.8 pg/ml; (D) stage 2: 67 y/o, male, OD, MD: –10.82, GDF15: 466.1 pg/ml; and (E) stage 3: 88 y/o, female, OS, MD: –18.01, GDF15: 703.1 pg/ml. OD, oculus dexter (right eye); OS, oculus sinister (left eye); MD, mean deviation. (F–H) GDF15 protein level in AH of POAG patients did no differ by (F) sex: male (n = 18) vs. female (n = 39), (G) diabetes status: patients without DM (no DM: n = 41) vs. with DM (DM: n = 16), or (H) race: European descent (ED: n = 42) vs. African American (AA: n = 15). (I) Correlation between age and GDF15 protein level in AH of POAG patients (n = 57, Pearson Correlation Coefficient = 0.052, 95% CI: –3.08 to 4.82, P = 0.662). (J) Correlation between average IOP and GDF15 protein level in AH of POAG patients (n = 57, Pearson Correlation Coefficient = –0.037, 95% CI: –8.72 to 6.60, P = 0.78). Values are median with interquartile range.
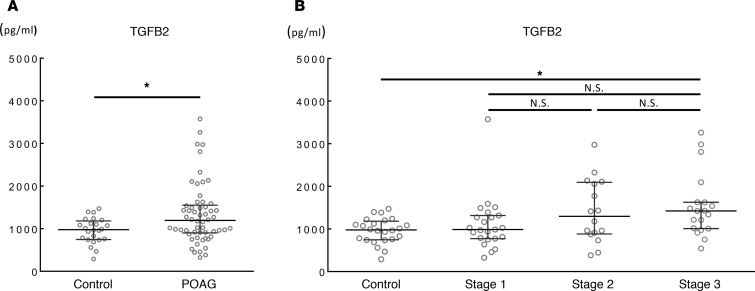
Since TGFB2 has been reported to be increased in AH of POAG patients, we also measured TGFB2 protein level in AH of the same POAG patients and controls. As predicted, TGFB2 levels were increased in AH of POAG patients compared with controls (Figure 7A). However, in contrast to GDF15, there were no significant differences in TGFB2 among different disease severity groups (Figure 7B). Among all POAG patients, although TGFB2 levels showed a significant difference by sex (Supplemental Figure 8A), they did not differ by diabetic status (Supplemental Figure 8B) and race (Supplemental Figure 8C), and they were not correlated with age (Supplemental Figure 8D) and average IOP (Supplemental Figure 8E).
Figure 7. TGFB2 level in aqueous humor (AH) of primary open angle glaucoma (POAG) patients.
(A) TGFB2 protein level in AH of control patients (n = 23) and POAG patients (n = 57). *P < 0.05 by Mann Whitney U test. (B) TGFB2 protein level in control patients (n = 23) and POAG stage 1 (n = 23), stage 2 (n = 15), and stage 3 (n = 19) patients. P < 0.05 by Kruskal-Wallis test. *P < 0.05 by Dunn’s multiple comparison. Values are median with interquartile range.
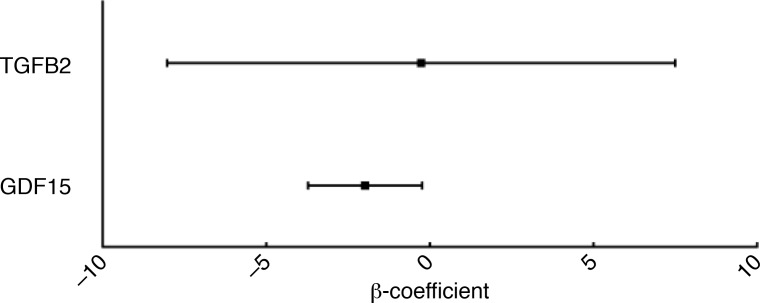
Furthermore, to investigate if GDF15 and TGFB2 levels in AH were progressively increased with increasing severity of disease or not, we generated a multivariable linear regression model (Figure 8). This model was adjusted for diabetic status (dichotomized as yes or no), IOP (averaged over last 3 visits), age (continuous variable), and race (dichotomized as European descent or African American). After controlling for these covariates, log-transformed GDF15 level was a significant predictor of worse mean deviation (β-coefficient = –2.0, 95% CI: –3.7 to –0.2; t = –2.3, P = 0.027), suggesting that a one log-unit increase in GDF15 levels is associated with a ~2.0 decrease in mean deviation. Notably, log-transformed TGFB2 levels were not a significant predictor of mean deviation (β-coefficient = –0.3, 95% CI: –8.0 to –7.5, t = –0.1, P = 0.945). The final model had an R2 = 0.384, indicating good explanatory power. Overall, these results suggest that elevated GDF15 levels are significantly associated with worse functional outcomes in glaucoma patients, as measured by VF testing.
Figure 8. GDF15 level in aqueous humor (AH) of primary open angle glaucoma (POAG) patients, but not TGFB2, is a significant predictor of worse mean deviation measured by visual field (VF) testing.
The results of multivariable linear regression model showed log-transformed GDF15 levels (β = –2.0, 95% CI: –3.7 to –0.2, t = –2.3, P = 0.027) but not log-transformed TGFB2 levels (β = –0.3, 95% CI: –8.0 to 7.5, t = –0.1, P = 0.945) predict worse mean deviations on VF testing after controlling for age, race, intraocular pressure (IOP), and diabetic status.
Discussion
In this study, we were interested in identifying a specific molecular marker that accurately predicted progression of glaucomatous neurodegeneration. We hypothesized that a protein secreted by the retina may specifically correlate with RGC death and may, thus, be a useful molecular marker that predicts progression of glaucomatous neurodegeneration. Based on this hypothesis, we performed retinal cytokine/growth factor–focused PCR array to identify factors that were associated specifically with RGC death. Our array results showed that GDF15 may be a novel and unique molecular marker of RGC death in glaucoma, as it was not elevated in models of ocular inflammation (EIU) or outer retinal photoreceptor degeneration (RD).
GDF15 is a member of TGF-β superfamily (16). GDF15 is expressed in both the CNS and the peripheral nervous system (PNS) (22). Although the precise biological function of GDF15 in the nervous system, including the retina, remain poorly understood, previous literature demonstrated its neurotrophic or neuroprotective effect in CNS (22) and PNS (23, 24). In addition, GDF15 has previously been demonstrated to be upregulated in the retina after axonal injury to the optic nerve (25). However, the magnitude and time course of RGC death after axonal injury was not different in mice that are genetically deficient in GDF15 compared with littermate controls, which suggests that it did not influence the temporal progression of RGC death (25). Of interest, it has also been reported that GDF15 provides independent prognostic information on cardiovascular events beyond previously identified cardiovascular risk factors and other markers of chronic and acute coronary disease (26, 27).
In addition to the increase of Gdf15 expression in the retina after axonal injury to the optic nerve, we detected increased Gdf15 expression only in GCL of the retina, although other parts of the eye do indeed express low levels of Gdf15 at baseline. In both mouse and rat models, GDF15 levels in AH increased after acute axonal injury to the optic nerve. The source of this secreted GDF15 may be the GCL, since GCL was the only cell population in the eye to exhibit increased gene expression after ONC. We also showed increased Gdf15 expression in the retina and increased GDF15 levels in AH of DBA/2J mice, a well-characterized murine chronic glaucoma model (17–19). Based on these results, we concluded that GDF15 secreted in to the AH by GCL may be a quantifiable measure of glaucomatous neurodegeneration.
We did not find an increase in retinal Tgfb2 gene expression in the ONC model or the murine chronic glaucoma model. As described in the results section, many studies have reported an association between TGFB2 in AH and POAG in humans. However, the main source of TGFB2 in AH is either the epithelial layer of the ciliary body (28) or the lens (29). Previous studies have shown that TGFB2 affected the trabecular meshwork, which is an important tissue for draining AH and maintaining normal IOP (30). As complex changes in the trabecular meshwork gradually affect its ability to drain AH from the anterior chamber, it can lead to elevated IOP. As such, increased TGFB2 in AH of POAG patients is not caused by the stress or damage of retinal cells induced by high IOP, and although animal models replicate some features of human POAG, they do not reproduce each facet of human glaucoma. This may be a reason TGFB2 protein levels are high in AH of POAG patients but not in the retinas after ONC or in the murine chronic glaucoma model.
We validated these findings in a well-characterized cohort of human patients either without glaucoma or with POAG. We classified POAG patients to 3 different severity groups (stage 1, 2, and 3) according to HPA criteria. As described above, we sought to identify specific markers that accurately predict progression of glaucomatous neurodegeneration. However, due to the limitation of the study design (retrospective cross-sectional study), we could not have appropriate dependent variables for glaucoma progression. Therefore, we had to use glaucoma severity as a surrogate-dependent variable for glaucoma progression in this study. Our multivariable linear regression model proved that GDF15 levels in AH of POAG patients, but not TGFB2, are significantly associated with glaucoma severity. These findings render GDF15 an attractive molecular marker of glaucomatous neurodegeneration, although further prospective study is needed in the future because glaucoma severity is no more than a surrogate-dependent variable for glaucoma progression; thus, we could not prove a direct relationship between GDF15 and glaucoma progression in this study.
We acknowledge that there are several limitations in this study. First, animal models we used in this study do not exactly reflect usual biological process of human glaucoma. The ONC model is an acute axonal injury model, whereas the majority of human glaucoma have chronic features. Although DBA/2J mouse strain is a model of chronic glaucoma, it is considered as pigmentary glaucoma model, in which DCs are known to phagocytose pigment granules in the AS of DBA/2J mice (19). Thus, when we analyze the AH of DBA/2J mice, we have to consider confounding features, including the effect of phagocytic DCs in the AS and inflammation in this model of glaucoma. Second, our human study might have selection bias. This study included stage 1 to stage 3 POAG patients classified by HPA criteria as described in the Methods section, but not stage 4 and stage 5 POAG patients that have severe or end-stage VF defect, since there was no surgical case in these categories during the study period. With this limitation of study design, it could be possible that GDF15 levels are low in stable but severe glaucoma patients that are not signed up for surgeries; this leads to different conclusion about the correlation between GDF15 and glaucoma severity. Third, although our multivariable linear regression model statistically proved that GDF15 levels in AH of POAG patients are significantly associated with glaucoma severity, GDF15 failed to detect glaucoma in some cases at all stages of the disease. As discussed above, due to the limitation of the study design, we had to use glaucoma severity as a surrogate-dependent variable for glaucoma progression in this study. However, based on our results of animal experiments, GDF15 in AH has strong potential to be associated with RGC death in the retina or glaucoma progression. Thus, future prospective validation studies will be necessary to determine if GDF15 in AH is associated with glaucoma progression and whether the measurement of GDF15 in AH can be used in clinical practice.
In conclusion, our data suggest that measurement of GDF15 in AH might give us quantitative information about glaucomatous neurodegeneration. In addition to conventional IOP measurements, VF test, and disc appearance, this information may enhance current treatment algorithms for glaucoma. Further prospective validation studies will be necessary to determine if GDF15 in AH is correlated with glaucoma progression and can be used in clinical practice.
Methods
Animals.
All mice (The Jackson Laboratory) and rats (Charles Rivers Laboratories) were housed in a temperature-controlled room under a 12-hour light/dark cycle, with free access to food and water. Six-week-old C57BL/6J mice were used for ONC and EIU experiments. Six-week-old 129S1/SvImJ mice were used for RD experiment. Six-week-old and 18-month-old C57BL/6J mice were used for young and old mice comparison. Three-month-old and 1-year-old DBA/2J mice were used as a chronic glaucoma model and its control. Eight-week-old Sprague Dawley rats were used for rat ONC experiment.
ONC model for mice.
We performed ONC in mice as previously described to examine the effect of axonal injury on RGC survival (8). Briefly, we anesthetized 6-week-old C57BL/6J mice with an i.p. injection of anesthetic cocktail (86.9 mg/kg ketamine and 13.4 mg/kg xylazine diluted in PBS). After ensuring adequate anesthesia, we incised the nasal/ventral conjunctiva and pulled away connective tissue using forceps. Then, we pinched and held the optic nerve for 10 seconds using the Dumont #N7 self-closing curved forceps (Fine Science Tools) 1–2 mm behind the bulbus. The left eye of each mouse served as the sham surgery control: conjunctiva of the left eye was incised without an ONC. After euthanasia by CO2 inhalation at various time points following ONC, we collected eye tissues (retinas, ASs, and lens) for further analyses. Eyes that demonstrated significant hemorrhage during the procedure were excluded from further analysis.
ONC model for rats.
We performed ONC in rats to induce axonal injury to RGC as previously described (31). Briefly, 8-week-old Sprague Dawley rats were anesthetized with isoflurane (Henry Schein) in oxygen (5% for induction and 2% for maintenance respectively, 2 l/min). The conjunctiva was dissected away from the orbit using spring scissors. The left optic nerve was then exposed and crushed for 10 seconds using Dumont #5 forceps (Fine Science Tools). The conjunctiva of the right eye served as the sham surgery control and was incised; the optic nerve was exposed, but no injury was performed. Rats were sacrificed at various time points after the crush by CO2 inhalation, and the retinas were harvested for downstream analyses. The eyes with intravitreal inflammation or severe hemorrhage were excluded from the study.
Light-induced RD model.
Light exposure to induce RD was performed as previously described (9). Briefly, 6-week-old 129S1/SvImJ mice were dark adapted overnight. Pupils were dilated with 2.5% phenylephrine hydrochloride (Akorn), and the mice were exposed to 13,000 lux of white light for 1 hour. The mice were then returned to normal light/dark cycle and sacrificed by CO2 inhalation at various time points after light exposure in order to harvest the retinas for analyses. We used 129S1/SvImJ mice for the RD model because C57BL/6J mouse strain is resistant against light-induced RD due to the gene mutation of RPE65 gene (32).
EIU model.
The EIU model was performed as described previously (10). Briefly, 6-week-old C57BL/6J mice received a single i.p. injection of 6.0 mg/kg body weight lipopolysaccharide from E. coli (Sigma-Aldrich) diluted in PBS. Control mice were injected with PBS alone. Mice were sacrificed by CO2 inhalation at various time points after EIU induction, and the retinas were harvested for analyses.
RNA isolation and real-time PCR.
Total RNA was extracted from eye tissues with TRIzol reagent (Thermo Fisher Scientific) following manufacturer’s instructions. For the samples collected by LMD, total RNA was extracted using RNeasy Micro Plus kit (Qiagen) according to the manufacturer’s instructions. To synthesize cDNA, total RNA was added to the High Capacity cDNA Reverse Transcription Kits (Thermo Fisher Scientific) and reverse-transcribed according to manufacturer’s instructions. qPCR was performed with duplicate using the StepOnePlus Real Time PCR system (Thermo Fisher Scientific) using TaqMan Real-Time PCR Assays (Thermo Fisher Scientific), and the mRNA was quantified using the ΔΔCT method with Actb or Gapdh as the internal control. The primers used in this study are shown in Supplemental Table 2.
PCR array.
Cytokine/growth factor–focused PCR array was performed with duplicate using 96-well Taqman Gene Expression Array plate (Thermo Fisher Scientific) according to manufacturer’s instructions with Actb as the internal control. The primers used in this cytokine/growth factor–focused PCR array are shown in Supplemental Table 3.
LMD.
Laser-capture microdissection was performed as described previously (33). Briefly, eyeballs were embedded in OCT compound (Sakura Finetek) and immediately flash frozen on dry ice. Cryo blocks were cut into 10-μm sections and placed on membrane slides (Leica). The slides were kept on dry ice and then fixed with 100% ethanol following Hematoxylin staining. LMD was performed using Leica LMD6000 LMD system (Leica). The GCL, INL, and ONL were separately collected.
In situ hybridization.
To detect Gdf15 mRNA expression in the eye, we performed in situ hybridization using the RNAscope 2.5 HD Detection Kit (Advanced Cell Diagnostics) according to the manufacturer’s instructions. Briefly, eyes from 6-week-old C57BL/6J mice were fixed with 10% neutral buffered formalin for 24 hours and then embedded in paraffin. The paraffin-embedded samples were then cut into 4-μm slices on glass slides. In addition to the Gdf15 probe (catalog 318521), the Dapb probe (catalog 301143) was used as a negative control. Hematoxylin was used as a counter stain.
IHC.
Eyeballs were embedded in OCT compound (Sakura Finetek) and immediately flash frozen on dry ice. Cryo blocks were cut into 10-μm sections and placed on superfrost plus microscope slides (Thermo Fisher Scientific). Slides were postfixed for 15 minutes in 10% Neutral Buffered Formalin (catalog 305-510; Protocol), washed in 4 changes of PBS and blocked in 10% BSA in PBS for 30 min at room temperature. Anti–mouse F4/80 primary antibody (catalog 14-4801-82; Thermo Fisher Scientific) was applied overnight using a dilution of 1:200 in blocking solution. Following 3 washes of PBS for 3 minutes each, Alexa 546–conjugated goat anti-rat secondary antibody (Thermo Fisher Scientific) was applied to the slides at 1:500 for 1 hour at room temperature. Slides were washed with PBS 3 times for 3 minutes each and mounted using SlowFade Gold with Dapi (Thermo Fisher Scientific). All incubations were performed in a humidified chamber. Images were obtained on a fluorescence microscope (Olympus BX51).
ELISA.
GDF15 in mouse and rat AH was measured using Quantikine Mouse/Rat GDF15 ELISA Kit (R&D Systems) according to the manufacturer’s instructions. GDF15 in human AH was measured by using human GDF15 Quantikine ELISA Kit (R&D Systems) according to the manufacturer’s instructions. Human GDF15 levels below the limit of detection of 4 pg/ml were replaced by a nonzero value (i.e., 1, 2, or 3 pg/ml), using a random integer generator (www.random.org). To measure TGFB2 in human AH, we used Quantikine ELISA Human TGFB2 (R&D Systems) according to manufacturer’s instructions. Briefly, 1/5 volume of 1 N HCl was added to the samples and incubated 10 minutes at room temperature. After the incubation, 1/5 volume of 1.2 N NaOH/HEPES was added, and total TGFB2 was measured immediately.
Collection of the AH from mice and rats.
AH was collected from enucleated eyes using syringe with a 34-gauge needle (Hamilton). A total of 2–3 μl of AH was collected from each mouse, and 2–3 samples were pooled for ELISA. A total of 10–15 μl of AH was collected from each rat, and individual samples were measured by ELISA.
IOP measurement of mice.
To measure IOP of the mice, we used TONOLAB (Colonial Medical Supply) following manufacturer’s instructions after anesthetizing the mice with an i.p. injection of anesthetic cocktail (86.9 mg/kg ketamine and 13.4 mg/kg xylazine diluted in PBS).
Immunostaining of RGCs.
We used RNA-binding protein with multiple splicing (RBPMS) as a selective marker of mice RGCs (34). The eyes were enucleated, and the posterior segments were immediately dissected and fixed with 4% paraformaldehyde in PBS for 1 hour. After being washed with PBS, the samples were blocked with 1% Triton and 5% BSA in PBS for 2 hours and then incubated with rabbit polyclonal antibody against RBPMS (1:200, catalog ab194213, Abcam) overnight at 4°C. Binding of primary antibody was localized with Alexa Fluor 488 goat anti-rabbit secondary antibody (1:500, Thermo Fisher Scientific). Finally, retinas were removed and mounted with mounting medium (ProLong Diamond Antifade Mountant, Invitrogen), and they were viewed with a fluorescence microscope (Olympus BX51). RGC density was determined as previously described with slight modification (35). Briefly, 4 standard areas (0.58 × 0.43 mm) of each whole-mounted retina at the point of 0.2 mm from the optic disc were randomly chosen, the labeled cells were counted, and the average number of RGCs/mm2 was calculated and used for the further analysis.
Inclusion and exclusion criteria for human AH analysis.
AH was collected from the patients undergoing cataract and/or glaucoma surgery from December 2007 to November 2015. We selected POAG patients without history of past pars plana vitrectomy (PPV) and ischemic diabetic retinopathy (DR). Patients without glaucoma, past PPV, and ischemic DR undergoing cataract surgery were selected as controls. Patients with Fuchs’ corneal dystrophy (2 cases), congenital cataract (1 case), retinal detachment (1 case), and high myopia > 31 mm axial length (1 case) were excluded.
Collection of the AH from human patients.
Prior to the planned surgical procedure, a peripheral corneal paracentesis was performed with a 15-degree blade near the limbus for entry into the anterior chamber. Via a 30-gauge blunt cannula introduced on a 1-ml tuberculin syringe, 50–100 μl of AH was withdrawn and immediately placed into a receptacle of dry ice and then transferred to a liquid nitrogen tank for storage at –70oC until further analysis.
Classification of glaucoma patients.
HPA criteria were used to classify glaucoma patients (20). In this study, all POAG patients were classified into stage 1 to stage 3 based on HPA criteria.
Statistics.
All statistical tests except for Fisher’s exact test were performed using GraphPad prism 6. Fisher’s exact test was performed by R-3.3.1. For the data that are normally distributed, values represent mean ± SD. For the data that are not normally distributed, values represent median with interquartile range. P < 0.05 was considered statistically significant.
Kolmogorov-Smirnov test was used to check if the data is normally distributed. For the data that are normally distributed, 2-tailed unpaired t test was used to compare 2 groups, and one-way ANOVA followed by Tukey’s HSD test for post-hoc analysis was used to compare 3 groups or more. For the data that are not normally distributed, Mann Whitney U test was used to compare 2 samples, and Kruskal-Wallis test followed by Dunn’s multiple comparison test for post-hoc analysis were used to compare 3 and more samples. Pearson correlation analysis was used to analyze the correlation between 2 groups. The χ2 test was used to compare the proportion of sex, diabetic status, and race in each group. Fisher’s exact test was used to compare the proportion of type of surgery for POAG patients. To determine the relationship between GDF15 and TGFB2 levels in AH and the extent of neurodegeneration in glaucoma patients as measured by mean deviation on VF testing (average of up to 2 last visits), we generated a multivariable linear regression model. Our model included the following predictor variables: log10-transformed GDF15 levels, log10-transformed TGFB2 levels, diabetic status (dichotomized as yes or no based on treating physician’s diagnosis), age (continuous variable), race (dichotomized as European descent or African American), and IOP (averaged over last 3 visits). We performed model diagnostics on the final model as appropriate. Finally, the final reported model omitted a single case with a standardized residual of –2.99 based on the results of the sensitivity analysis.
Study approval.
All animal experiments were conducted in accordance with Washington University in St. Louis School of Medicine Animal Care and Use guidelines after approval by the Animal Studies Committee.
The research protocol for human study was approved by the Washington University School of Medicine Human Research Protection Office and the IRB in compliance with HIPAA guidelines and the tenets of the Declaration of Helsinki. Written Informed consent was obtained from the patients prior to inclusion in the study.
Author Contributions
NB, CJS, JY, and RSA designed and analyzed the experiments. NB, YBS, WPT, RL, and ZD conducted the experiments. JS provided assistance in collecting the patient information. SCK provided technical support for human sample analysis. A. Sene, A. Santeford, WPT, and VC provided technical support for animal experiments and reviewed the manuscript. JBL performed statistical analysis. MG provided assistance in statistics and critically reviewed the manuscript. NB, JBL, and RSA wrote the manuscript.
Supplementary Material
Acknowledgments
This work was supported by NIH grants R01 EY019287 (RSA), UL1 KL2TR000450 (JY), P30DK56341 (JY), P30DK02057 (JY), DK104995 (JY), R01EY021515 (CS), R01DE022000 (VC), R01NS0824446 (VC), and P30EY02687 (Vision Core Grant); the Schulak Family Gift Fund for Retinal Research (RSA); the Jeffrey Fort Innovation Fund (RSA); the Kuzma Family Gift Fund; the Central Society for Clinical and Translational Research (JY); RPB Physician Scientist Award (RSA); and Washington University Institute of Clinical and Translational Sciences (MG), along with an unrestricted grant from Research to Prevent Blindness Inc. NY to the Department of Ophthalmology, Washington University in St. Louis School of Medicine. JBL was supported by the Washington University in St. Louis Medical Scientist Training Program (NIH grant T32GM007200), the Washington University in St. Louis Institute of Clinical and Translational Sciences (NIH grants UL1TR000448, TL1TR000449), the Washington University Diabetic Cardiovascular Disease Center, the American Federation for Aging Research, and the Vitreoretinal Surgery Foundation. Washington University has intellectual property filed based on these studies on which the authors (RSA and JY) are listed as inventors. We thank Kota Sato (Tohoku University, Japan) and Tae Jun Lee (Washington University in St. Louis) for technical support.
Version 1. 04/26/2017
Electronic publication
Footnotes
Conflict of interest: Washington University has filed intellectual property based on these findings, with RSA and JY listed as inventors.
Reference information: JCI Insight. 2017;2(9):e91455. https://doi.org/10.1172/jci.insight.91455.
Contributor Information
Norimitsu Ban, Email: bann@vision.wustl.edu.
Ying-Bo Shui, Email: shui@vision.wustl.edu.
Julia Sein, Email: seinj@vision.wustl.edu.
Wolfgang Pita-Thomas, Email: pitathomasd@wustl.edu.
Abdoulaye Sene, Email: abd.sene@gmail.com.
Andrea Santeford, Email: santeforda@vision.wustl.edu.
Mae Gordon, Email: Gordon.mae@wustl.edu.
Rachel Lamb, Email: rachelrlamb85@gmail.com.
Zhenyu Dong, Email: dongz@wustl.edu.
Valeria Cavalli, Email: cavalli@wustl.edu.
Jun Yoshino, Email: JYOSHINO@DOM.wustl.edu.
Rajendra S. Apte, Email: apte@vision.wustl.edu.
References
- 1.Kingman S. Glaucoma is second leading cause of blindness globally. Bull World Health Organ. 2004;82(11):887–888. [PMC free article] [PubMed] [Google Scholar]
- 2.Gordon MO, Gao F, Beiser JA, Miller JP, Kass MA. The 10-year incidence of glaucoma among patients with treated and untreated ocular hypertension. Arch Ophthalmol. 2011;129(12):1630–1631. doi: 10.1001/archophthalmol.2011.337. [DOI] [PubMed] [Google Scholar]
- 3.Chang EE, Goldberg JL. Glaucoma 2.0: neuroprotection, neuroregeneration, neuroenhancement. Ophthalmology. 2012;119(5):979–986. doi: 10.1016/j.ophtha.2011.11.003. [DOI] [PMC free article] [PubMed] [Google Scholar]
- 4. Bhattacharya SK, Lee RK, Grus FH, Seventh ARVO/Pfizer Ophthalmics Research Institute Conference Working Group. Molecular biomarkers in glaucoma. Invest Ophthalmol Vis Sci. 2013;54(1):121–131. [DOI] [PMC free article] [PubMed] [Google Scholar]
- 5.Medeiros FA. Biomarkers and surrogate endpoints in glaucoma clinical trials. Br J Ophthalmol. 2015;99(5):599–603. doi: 10.1136/bjophthalmol-2014-305550. [DOI] [PMC free article] [PubMed] [Google Scholar]
- 6.Moyer VA. U.S. Preventive Services Task Force. Screening for glaucoma: U.S. Preventive Services Task Force Recommendation Statement. Ann Intern Med. 2013;159(7):484–489. doi: 10.7326/0003-4819-159-6-201309170-00686. [DOI] [PubMed] [Google Scholar]
- 7.Mac Nair CE, Nickells RW. Neuroinflammation in Glaucoma and Optic Nerve Damage. Prog Mol Biol Transl Sci. 2015;134:343–363. doi: 10.1016/bs.pmbts.2015.06.010. [DOI] [PubMed] [Google Scholar]
- 8.Allcutt D, Berry M, Sievers J. A qualitative comparison of the reactions of retinal ganglion cell axons to optic nerve crush in neonatal and adult mice. Brain Res. 1984;318(2):231–240. doi: 10.1016/0165-3806(84)90028-2. [DOI] [PubMed] [Google Scholar]
- 9.Schimel AM, et al. N-acetylcysteine amide (NACA) prevents retinal degeneration by up-regulating reduced glutathione production and reversing lipid peroxidation. Am J Pathol. 2011;178(5):2032–2043. doi: 10.1016/j.ajpath.2011.01.036. [DOI] [PMC free article] [PubMed] [Google Scholar]
- 10.Li Q, Peng B, Whitcup SM, Jang SU, Chan CC. Endotoxin induced uveitis in the mouse: susceptibility and genetic control. Exp Eye Res. 1995;61(5):629–632. doi: 10.1016/S0014-4835(05)80056-9. [DOI] [PubMed] [Google Scholar]
- 11.Wordinger RJ, Sharma T, Clark AF. The role of TGF-β2 and bone morphogenetic proteins in the trabecular meshwork and glaucoma. J Ocul Pharmacol Ther. 2014;30(2-3):154–162. doi: 10.1089/jop.2013.0220. [DOI] [PMC free article] [PubMed] [Google Scholar]
- 12.Jampel HD, Roche N, Stark WJ, Roberts AB. Transforming growth factor-beta in human aqueous humor. Curr Eye Res. 1990;9(10):963–969. doi: 10.3109/02713689009069932. [DOI] [PubMed] [Google Scholar]
- 13.Inatani M, Tanihara H, Katsuta H, Honjo M, Kido N, Honda Y. Transforming growth factor-beta 2 levels in aqueous humor of glaucomatous eyes. Graefes Arch Clin Exp Ophthalmol. 2001;239(2):109–113. doi: 10.1007/s004170000241. [DOI] [PubMed] [Google Scholar]
- 14.Böttner M, Suter-Crazzolara C, Schober A, Unsicker K. Expression of a novel member of the TGF-beta superfamily, growth/differentiation factor-15/macrophage-inhibiting cytokine-1 (GDF-15/MIC-1) in adult rat tissues. Cell Tissue Res. 1999;297(1):103–110. doi: 10.1007/s004410051337. [DOI] [PubMed] [Google Scholar]
- 15.Klein R, Klein BE. The prevalence of age-related eye diseases and visual impairment in aging: current estimates. Invest Ophthalmol Vis Sci. 2013;54(14):ORSF5–ORSF13. doi: 10.1167/iovs.13-12789. [DOI] [PMC free article] [PubMed] [Google Scholar]
- 16.Bootcov MR, et al. MIC-1, a novel macrophage inhibitory cytokine, is a divergent member of the TGF-beta superfamily. Proc Natl Acad Sci USA. 1997;94(21):11514–11519. doi: 10.1073/pnas.94.21.11514. [DOI] [PMC free article] [PubMed] [Google Scholar]
- 17.John SW, et al. Essential iris atrophy, pigment dispersion, and glaucoma in DBA/2J mice. Invest Ophthalmol Vis Sci. 1998;39(6):951–962. [PubMed] [Google Scholar]
- 18.Anderson MG, et al. Mutations in genes encoding melanosomal proteins cause pigmentary glaucoma in DBA/2J mice. Nat Genet. 2002;30(1):81–85. doi: 10.1038/ng794. [DOI] [PubMed] [Google Scholar]
- 19.Mo JS, et al. By altering ocular immune privilege, bone marrow-derived cells pathogenically contribute to DBA/2J pigmentary glaucoma. J Exp Med. 2003;197(10):1335–1344. doi: 10.1084/jem.20022041. [DOI] [PMC free article] [PubMed] [Google Scholar]
- 20.Chang B, et al. Interacting loci cause severe iris atrophy and glaucoma in DBA/2J mice. Nat Genet. 1999;21(4):405–409. doi: 10.1038/7741. [DOI] [PubMed] [Google Scholar]
- 21. Hodapp EP, Parrish II RK, Anderson DR. Clinical Decisions in Glaucoma. St. Louis, MO: Mosby; 1993. [Google Scholar]
- 22.Strelau J, et al. Growth/differentiation factor-15/macrophage inhibitory cytokine-1 is a novel trophic factor for midbrain dopaminergic neurons in vivo. J Neurosci. 2000;20(23):8597–8603. doi: 10.1523/JNEUROSCI.20-23-08597.2000. [DOI] [PMC free article] [PubMed] [Google Scholar]
- 23.Wang X, et al. Growth/differentiation factor-15 and its role in peripheral nervous system lesion and regeneration. Cell Tissue Res. 2015;362(2):317–330. doi: 10.1007/s00441-015-2219-3. [DOI] [PubMed] [Google Scholar]
- 24.Mensching L, Börger AK, Wang X, Charalambous P, Unsicker K, Haastert-Talini K. Local substitution of GDF-15 improves axonal and sensory recovery after peripheral nerve injury. Cell Tissue Res. 2012;350(2):225–238. doi: 10.1007/s00441-012-1493-6. [DOI] [PubMed] [Google Scholar]
- 25.Charalambous P, Wang X, Thanos S, Schober A, Unsicker K. Regulation and effects of GDF-15 in the retina following optic nerve crush. Cell Tissue Res. 2013;353(1):1–8. doi: 10.1007/s00441-013-1634-6. [DOI] [PubMed] [Google Scholar]
- 26.Wollert KC, et al. Growth differentiation factor 15 for risk stratification and selection of an invasive treatment strategy in non ST-elevation acute coronary syndrome. Circulation. 2007;116(14):1540–1548. doi: 10.1161/CIRCULATIONAHA.107.697714. [DOI] [PubMed] [Google Scholar]
- 27.Wollert KC, et al. Prognostic value of growth-differentiation factor-15 in patients with non-ST-elevation acute coronary syndrome. Circulation. 2007;115(8):962–971. doi: 10.1161/CIRCULATIONAHA.106.650846. [DOI] [PubMed] [Google Scholar]
- 28.Helbig H, Kittredge KL, Coca-Prados M, Davis J, Palestine AG, Nussenblatt RB. Mammalian ciliary-body epithelial cells in culture produce transforming growth factor-beta. Graefes Arch Clin Exp Ophthalmol. 1991;229(1):84–87. doi: 10.1007/BF00172268. [DOI] [PubMed] [Google Scholar]
- 29.Gordon-Thomson C, de Iongh RU, Hales AM, Chamberlain CG, McAvoy JW. Differential cataractogenic potency of TGF-beta1, -beta2, and -beta3 and their expression in the postnatal rat eye. Invest Ophthalmol Vis Sci. 1998;39(8):1399–1409. [PubMed] [Google Scholar]
- 30.Fuchshofer R, Tamm ER. The role of TGF-β in the pathogenesis of primary open-angle glaucoma. Cell Tissue Res. 2012;347(1):279–290. doi: 10.1007/s00441-011-1274-7. [DOI] [PubMed] [Google Scholar]
- 31.Usher LC, et al. A chemical screen identifies novel compounds that overcome glial-mediated inhibition of neuronal regeneration. J Neurosci. 2010;30(13):4693–4706. doi: 10.1523/JNEUROSCI.0302-10.2010. [DOI] [PMC free article] [PubMed] [Google Scholar]
- 32.Wenzel A, Reme CE, Williams TP, Hafezi F, Grimm C. The Rpe65 Leu450Met variation increases retinal resistance against light-induced degeneration by slowing rhodopsin regeneration. J Neurosci. 2001;21(1):53–58. doi: 10.1523/JNEUROSCI.21-01-00053.2001. [DOI] [PMC free article] [PubMed] [Google Scholar]
- 33.Sene A, et al. Impaired cholesterol efflux in senescent macrophages promotes age-related macular degeneration. Cell Metab. 2013;17(4):549–561. doi: 10.1016/j.cmet.2013.03.009. [DOI] [PMC free article] [PubMed] [Google Scholar]
- 34.Rodriguez AR, de Sevilla Müller LP, Brecha NC. The RNA binding protein RBPMS is a selective marker of ganglion cells in the mammalian retina. J Comp Neurol. 2014;522(6):1411–1443. doi: 10.1002/cne.23521. [DOI] [PMC free article] [PubMed] [Google Scholar]
- 35.Harada T, et al. The potential role of glutamate transporters in the pathogenesis of normal tension glaucoma. J Clin Invest. 2007;117(7):1763–1770. doi: 10.1172/JCI30178. [DOI] [PMC free article] [PubMed] [Google Scholar]
Associated Data
This section collects any data citations, data availability statements, or supplementary materials included in this article.


