Abstract
First line treatment for recurrent and metastatic prostate cancer is androgen deprivation therapy (ADT). Use of ADT has been increasing in frequency and duration, such that side effects increasingly impact patient quality of life. One of the most significant side effects of ADT is sarcopenia, which leads to a loss of skeletal muscle mass and function, resulting in a clinical disability syndrome known as obese frailty. Using aged mice, we developed a mouse model of ADT-induced sarcopenia that closely resembles the phenotype seen in patients, including loss of skeletal muscle strength, reduced lean muscle mass, and increased adipose tissue. Sarcopenia onset occurred about 6 weeks after castration and was blocked by a soluble receptor (ActRIIB-Fc) that binds multiple TGFβ superfamily members, including myostatin, growth differentiation factor 11, activin A, activin B, and activin AB. Analysis of ligand expression in both gastrocnemius and triceps brachii muscles demonstrates that each of these proteins is induced in response to ADT, in 1 of 3 temporal patterns. Specifically, activin A and activin AB levels increase and decline before onset of strength loss at 6 weeks after castration, and myostatin levels increase coincident with the onset of strength loss and then decline. In contrast, activin B and growth differentiation factor 11 levels increase after the onset of strength loss, 8–10 weeks after castration. The observed patterns of ligand induction may represent differential contributions to the development and/or maintenance of sarcopenia. We hypothesize that some or all of these ligands are targets for therapy to ameliorate ADT-induced sarcopenia in prostate cancer patients.
The mainstay treatment for recurrent or metastatic prostate cancer (PrCa) is a reduction of male hormones by androgen deprivation therapy (ADT) (1). These cancers progress relatively slowly, and patients often receive ADT for years, such that any side effects of ADT have a significant impact on the health of the PrCa patient. One of the most frequent and disabling side effects is progressive loss of muscle mass (sarcopenia). Age-related declines in circulating androgen levels lead to loss of skeletal muscle, changing lean body mass (LBM) (2). In men, age-related sarcopenia typically begins with a 1%–2% loss in skeletal muscle mass per decade between the ages of 30 and 50, and thereafter, skeletal muscle wasting increases to a rate of 10% per decade (3–5). Androgen deprivation, as studied in hypogonadal men and 10-week orchiectomized mice, leads to similar reductions in skeletal muscle mass and function (6–9). Alarmingly, the LBM of PrCa patients receiving ADT for as brief as 6–12 months has been reported to decrease by approximately 3% (10–13) and correlates with significant declines in measures of muscular strength, performance status, and overall quality of life (10, 14, 15). Sarcopenia is most likely the underlying mechanism for the clinical disability syndrome of “obese frailty” described by Dale and coworkers in older men receiving ADT for PrCa (5). The syndrome name reflects the decrease in muscle mass accompanied by elevated fat mass as well as increased falls and fractures. Although testosterone supplementation may be effective in treating age-induced sarcopenia, it is of course contraindicated in men with advanced PrCa (16–19). The only current treatment for ADT-induced muscle wasting is exercise (15, 20, 21). However, the intensity of exercise required, coupled with susceptibility to fractures due to bone metastasis and ADT-induced acceleration in osteoporosis, emphasizes the need for novel therapies for ADT-induced sarcopenia (10, 11, 15, 22–24). The magnitude of the patient population is significant: approximately 400 000 United States men receive ADT each year (1), with more than 50% of these men age 75 or older and already experiencing some degree of age-related sarcopenia before ADT. Thus, we estimate that more than 200 000 individuals might suffer from this treatment side effect.
The molecular basis for ADT-induced sarcopenia is uncertain. Inflammatory cytokines (IL-1, IL-6, and TNF) have historically been associated with muscle wasting, but attempts to inhibit cancer cachexia-associated sarcopenia with specific blocking agents (eg, anti-TNF or anti-IL-6 antibodies) in human trials have failed (25). Recent evidence has linked a subgroup of TGFβ superfamily members including myostatin and the activins to the negative regulation of skeletal muscle mass and strength in normal, aging, and cachectic mouse models (25–28). These cytokines bind to a heterodimeric activin receptor complex composed of ActRII (also known as ActRIIA) and ActRIIB (25, 28). Each type II receptor binds to and then phosphorylates a type I receptor (29). Binding induces conformational change, allowing phosphorylation of Smad2 and Smad3, which then dimerize, bind Smad4, and modulate transcription (30). Smad3 phosphorylation hinders recovery of skeletal muscle fiber size in models of skeletal muscle atrophy (31), confirming the importance of this signaling pathway. In the present study, we establish a mouse model of castration-induced sarcopenia that accurately mimics the human response to ADT, confirm the primary role of ActRIIB TGFβ family ligands and identify candidate ligands that may mediate the effects of ADT on muscle.
Materials and Methods
Animals
All animal studies were performed in accordance with the National Institute of Health Guidelines for the Care and Use of Laboratory Animals and subject to institutional review and approval. Six- to 9-month-old male C57BL6 mice were purchased from The Jackson Laboratory. All mice were maintained on a 12-hour light, 12-hour dark cycle and had regular chow ad libitum. Mice were assigned randomly to either sham-castrated or castrated groups. Surgical castration was performed as previously described (32). For ligand blockade experiments, the castrated mice were randomly assigned to either vehicle or ActRIIB-Fc treatment groups. ActRIIB-Fc administered biweekly has maximal pharmacokinetic efficacy (27), and the homologous human ActRIIB-Fc has a half-life of 4–5 days in c57BL/6 mice after ip injection (33). These mice were therefore treated on the day of castration and subsequently biweekly for 10 weeks with vehicle (Tris buffered saline) or with 10-mg/kg ActRIIB-Fc (RAP-031; Acceleron) by ip injection. During the course of treatment, prostate volume was assessed by ultrasound imaging at the indicated times, and grip strength and body mass were measured biweekly. At the prespecified end point, mice were imaged by microcomputed tomography (micro-CT) to assess tissue composition and then killed. Mice were deeply anesthetized, and blood was collected by cardiac puncture for serum cytokine levels. The hindlimb and forelimb skeletal muscles were quickly dissected, weighed, snap frozen in liquid nitrogen, and stored at −80°C until analysis.
Three-dimensional ultrasound imaging acquisition
High-frequency ultrasound images of the prostate were acquired with a Vevo 770 microultrasound imaging system using an RMV-704 scan head (60-MHz maximal broadband frequency; 40-MHz average frequency, 40-μm axial resolution, 80-μm lateral resolution, 14.6-mm maximal lateral field of view) as previously described (34). Briefly, mice were anesthetized with isofluorane and restrained on a heated stage in the Vevo Integrated Rail System (VisualSonics, Inc) during image acquisition. The abdomen was depilated to eliminate the air bubble in the fur before ultrasound transmission gel was applied to the abdomen of the mice. Three-dimensional images of the prostate were reconstructed from 2 dimensional section images and ventral prostate (VP) volumes were computed using Amira 3D visualization software (FEI Visualization Sciences Group), as previously described (34).
Micro-CT
Before killing, mice were anesthetized with a continuous 1% isofluorane in oxygen mixture (1 L/min) and hindlimbs were scanned by micro-CT (VivaCT 40; Scanco USA, Inc) at a 17.5-μm isotropic resolution with an integration time of 200 ms, energy of 55 kVp, and intensity of 145 μA. Binning of 2 × 2 detectors was employed to increase detection sensitivity, increasing the effective pixel size to 35 μm and the integration time to 800 ms, which allowed improved contrast and clarity. Soft tissue composition was analyzed using Scanco μCT Evaluation Program v.6.5–1, and three-dimensional reconstruction using Scanco μCT Ray v.4.0–1. Total volume of soft tissue was calculated by adjusting threshold values to exclude bone from the total volume imaged. Similarly, fat volume was calculated by adjusting the threshold value to exclude muscle. The percentage of fat in soft tissue was calculated as: Vf/Vt × 100%. The percentages of muscle and tendon in soft tissue were calculated as: (Vt − Vf)/Vt × 100%, where Vf is the fat volume and Vt is the total volume of soft tissue.
Physiologic measurements of grip strength
Mice were assessed before the start of the experiments and were monitored biweekly thereafter, in the morning, usually on the same day of the week, in the same environment by the same experimenter in order to minimize variability. Total body mass was measured with a digital balance (Ohaus) and grip strength was assessed with digital grip strength meter (Columbus Instruments). Briefly, mice were allowed to grab a wire grid attached to the meter while being gently pulled parallel away by the tail. The mean maximum force (in Newtons) of 3 consecutive trials with 3 minutes rest between trials was taken as an index of grip strength.
ELISA assays
Tissue extracts were prepared by pulverizing dissected frozen gastrocnemius (GAS) or triceps (TRI) muscles from individual mice with a pestle and mortar containing liquid nitrogen to obtain a fine powder. Frozen muscle powder was resuspended in Nonidet P-40 (NP-40) cell lysis buffer (30mM Tris-hydrochloride [pH 7.4], 150mM sodium chloride; 1% NP-40, 1mM sodium vanadate, 100mM sodium fluoride, 2.5μM zinc chloride, 10% glycerol, 400μM phenylmethylsulfonyl fluoride, and 1× protease inhibitor cocktail; Sigma) and sonicated for 8 seconds at 10 W. Insoluble proteins were removed via centrifugation. The soluble supernatant was collected and stored at −80°C until analysis. Protein concentration was determined using bicinchoninic acid reagent (Pierce). TGFβ superfamily protein levels were determined by ELISA and assayed spectrophotometrically, according to the manufacturer's protocol. Commercial ELISA kits were: human/mouse/rat activin A ELISA kit (Quantikine DAC00B; R&D Systems), activin B ELISA kit (E15932m; Cusabio Biotech Co, LTD), and activin AB and growth differentiation factor (GDF)11 ELISA kits (SEA158Mu and SEC113Mu, respectively; Cloud-Clone Corp).
Immunoblot analysis
Soluble muscle tissue extract samples (30–100 μg) were separated on 12% SDS-PAGE under reducing conditions and transferred to nitrocellulose membranes. All antibodies employed are described in Table 1. Chemiluminescent (Supersignal West Pico; Pierce) signal was captured using a cooled charge-coupled digital camera system (Kodak 4000R) and quantitated using Molecular Imaging software. Myostatin, phospho-Smad2, and total Smad2 signals were first normalized to β-actin (for myostatin) or elongation factor 2 (EF2) (for Smad2) and then to the internal standard control on each gel/filter to allow comparison across different blots.
Table 1.
Antibody Table
| Peptide/Protein Target | Antigen Sequence (if Known) | Name of Antibody | Manufacturer, Catalog Number, and/or Name of Individual Providing the Antibody | Species Raised in; Monoclonal or Polyclonal | Dilution Used |
|---|---|---|---|---|---|
| Myostatin | Mouse GDF8 Asn25-Ser376 | MAb (clone 84214) | R&D Systems, MAB788 | Monoclonal; rat IgG2B | 1:1000 |
| Phospho-Smad2 | Smad3S423/5 | MAb (clone EP823Y) | Abcam, 52903 | Monoclonal; rabbit | 1:2000 |
| Smad2 | Amino terminus hSmad2 | L16D3 | Cell Signaling, 3103 | Monoclonal; mouse | 1:2000 |
| Eukaryotic EF2 | Complete protein | G270 | Nastiuk (Ref. 63) | Rabbit | 1:2000 |
| β-Actin | β-Actin aa 1–14 | AC15 | Sigma, A5441 | Monoclonal; mouse | 1:5000 |
| Rat IgG (H+L) | Rabbit antirat unconjugated | Pierce, 31218 | Rabbit | 1:20 000 | |
| Rabbit IgG (H+L) | Goat antirabbit HRP-conjugated secondary | Pierce, 31460 | Goat | 1:20 000 | |
| Mouse IgG (H+L) | Goat antimouse HRP-conjugated secondary | Pierce, 31430 | Goat | 1:20 000 |
Data analysis
Skeletal muscle masses and TGFβ superfamily protein concentrations were compared by one-way ANOVA followed by Dunnett's test. Body weight or grip strength was analyzed by two-way ANOVA followed by Tukey's HSD test. ANOVA two-tailed P < .05 was considered significant, and if reached, post hoc testing was then carried out, as reported. All statistical analyses were performed in JMP Pro 11 software.
Results
Castration induces sarcopenia and fat gain
Unlike young mice, which gain weight after castration (27), total body mass decreases 10%–20% after castration in 1-year-old mice (33). To establish reproducible measures of castration-induced sarcopenia in older mice, as a model for humans undergoing ADT for PrCa, male C57BL/6 retired breeder mice (6–9 mo of age) were castrated (or sham castrated) and then monitored for 15 weeks. Total body mass was measured biweekly, and castrated mouse values compared with both starting mass and sham-castrated controls. In older mice, no change in total body mass, relative to starting mass, was seen after castration, whereas sham-castrated mice gained mass, leading to a significant divergence of the mass of the castrated group from the sham group by 10 weeks after castration (Figure 1A). Prostate volume changes after castration are an acutely sensitive biological measure of circulating androgen elimination (34, 35). We previously developed a high frequency three-dimensional ultrasound imaging protocol to measure VP volumes (34). Castrated mice showed a rapid reduction in VP volume relative to starting volume (Figure 1B), indicating biologically effective castration of these animals.
Figure 1. Castration induces prostate regression and affects body mass.
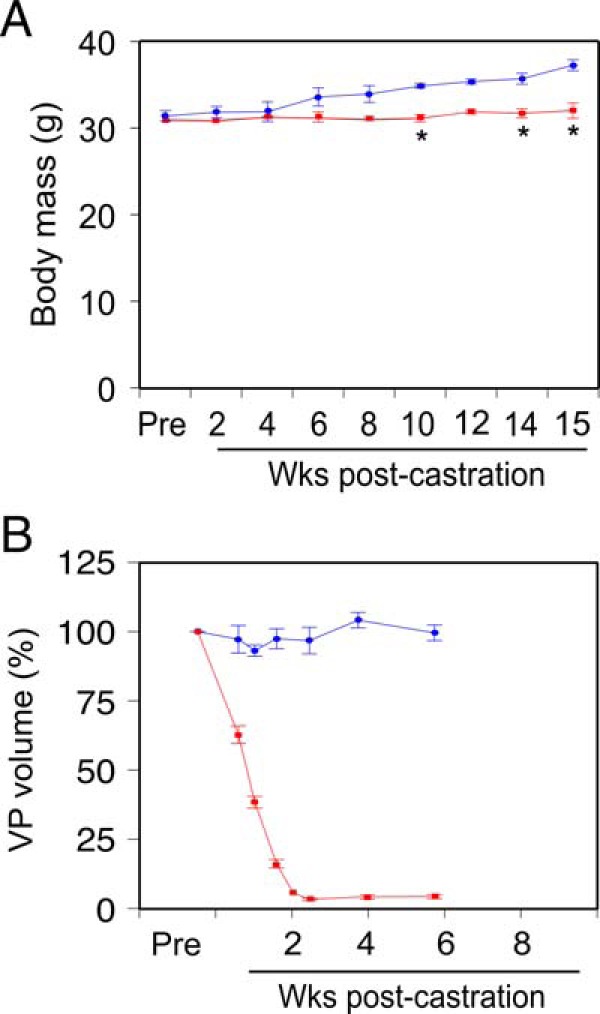
A, Total body mass in castrated (n = 4, red) or sham-castrated (n = 4, blue) mice, determined weekly. Mean (grams) ± SEM. B, Prostate glands were imaged by high frequency ultrasound before castration (Pre), and at the indicated times postcastration (n = 4, red) or postsham operation (n = 4, blue). Ventral prostate (VP) lobe volume was determined from ultrasound image reconstruction using Amira software and is shown as percent precastration volume (mean [%] ± SEM). Sham-castrated and castrated groups were compared using two-way ANOVA with Tukey's honest significant difference testing; *, P < .05 vs sham-castrated group.
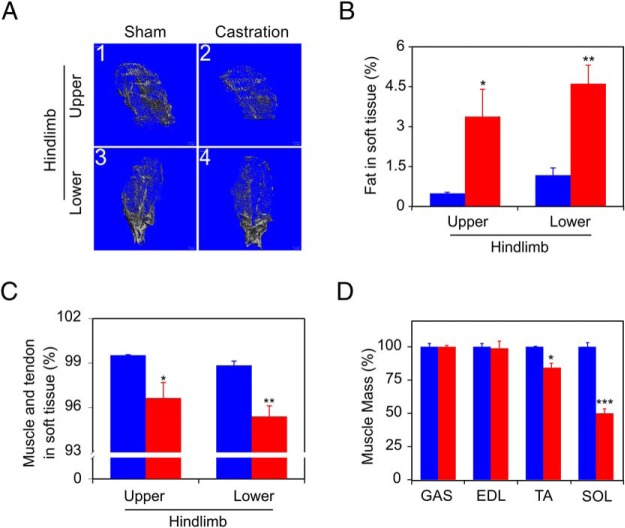
As noted, PrCa patients receiving ADT show a decrease in muscle mass accompanied by elevated fat mass (5). To determine whether the mouse model mimicked the response of human PrCa patients, mice were imaged using micro-CT scanning 14 weeks after castration, to assess the effects of castration on body mass composition (Figure 2A). Castration increased hindlimb fat content 3-fold relative to sham-castrated mice (Figure 2B). Coordinately, lean muscle decreased in both the upper (thigh) and lower (calf) hindlimb compartments of the castrated mouse (Figure 2C). After imaging, mice were killed and individual muscles were isolated and weighed (Figure 2D). The mass of the soleus (SOL) and tibialis anterior (TA) muscles were significantly reduced after 15 weeks of androgen deprivation. Neither GAS nor extensor digitorum longus (EDL) mass were affected.
Figure 2. Castration induces sarcopenia.
A, Micro-CT images of mice from Figure 1 showing lean muscle (gray) and fat (empty area within lean tissue) tissue from upper hindlimb (1, sham femur; 2, castrated femur) and lower hindlimb (3, sham tibialis; 4, castrated tibialis) 14 weeks after castration. B, Fat in total soft tissue (mean fat mass, % of total; determined following subtraction of bone compartment volumes) is shown for sham-castrated (blue) and castrated (red) groups. C, Muscle and tendon in soft tissue (mean lean mass, % of total) were determined from analysis of micro-CT images for sham-castrated (blue) and castrated (red) groups. D, Muscle mass was determined at killing 15 weeks after castration for the indicated muscles (GAS, EDL, TA, and SOL), for sham-castrated (blue, set to 100% for each muscle type) and castrated (red) groups. Columns are mean (%), bars are SEM; n = 4 for each group. Groups were compared using unpaired t tests; *, P < .05; **, P < .01; ***, P < .001 vs sham-castrated group.
Castration induces coordinate skeletal muscle sarcopenia and loss of strength
To confirm and extend this initial characterization of castration-induced body composition changes, a larger cohort of 6- to 9-month-old mice was castrated (or sham castrated), and killed in groups of 4, biweekly, over a 10-week period. As in Figure 1, above, there was no change in the total body mass of the castrated animals over 10 weeks, and the VP regressed by 2 weeks after castration, relative to the sham-castrated mice (data not shown). Mouse grip strength was measured biweekly in all mice, and steadily declined, reaching significance by 6 weeks after surgery in castrated vs sham-castrated mice (Figure 3). Next, muscles were collected from sham-castrated and castrated mice at 2, 4, 6, 8, and 10 weeks after castration, and the mass for each was determined (Figure 4, A–D), similar to Figure 2D. In these experiments, 2 additional muscle groups were collected: the quadriceps (QUA) femoris from the upper hindlimb (Figure 4E, QUA) and the TRI brachii from the upper forelimb (Figure 4F, TRI). Overall, there was significant muscle loss beginning at week 6 in 5 of the 6 muscles (GAS, TA, SOL, QUA, and TRI, corresponding to Figure 4, A and C–F, respectively). Notably, loss of muscle mass closely paralleled the time course for loss of muscle strength (compare Figures 3 and 4). Castration-induced sarcopenia in the GAS muscles in this cohort (Figure 4A), but this was not detected in the first cohort (Figure 2D, GAS).
Figure 3. Grip strength declines after castration.
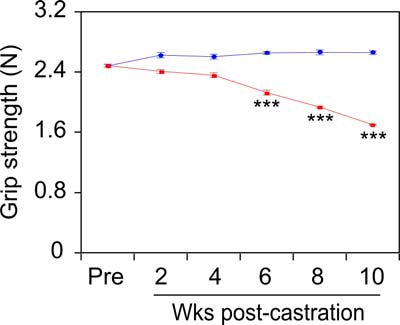
Grip strength was measured using a digital grip strength meter every 2 weeks after castration. Sham-castrated (n = 4, blue) and castrated (n = 20 at wk 2, n = 16 at wk 4, n = 12 at wk 6, n = 8 at wk 8, n = 4 at wk 10, red) groups were compared by two-way ANOVA with Tukey's honest significant difference testing. Mean force (Newtons) ± SEM; ***, P < .001 vs sham-castrated group.
Figure 4. Castration induces time-dependent sarcopenia in multiple muscles.
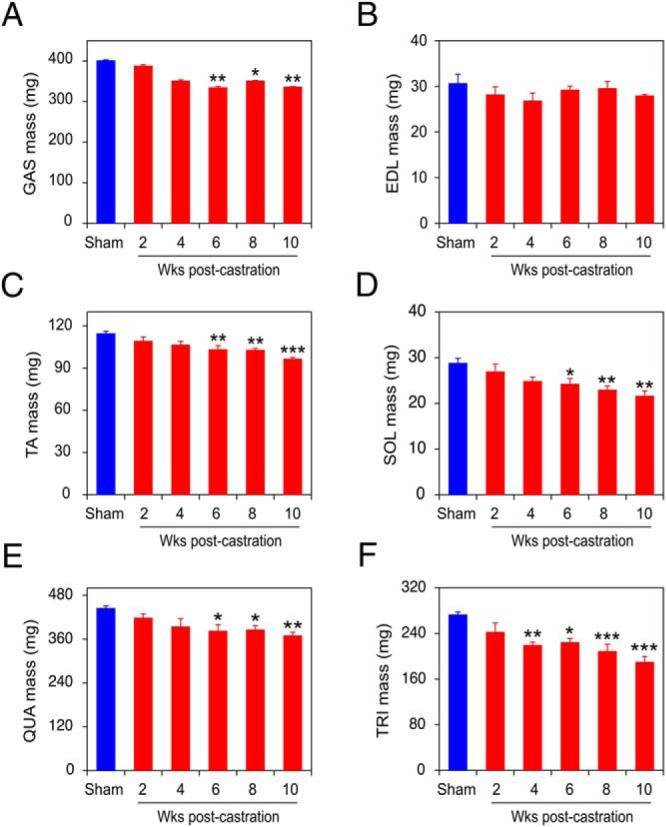
GAS (A), EDL (B), TA (C), SOL (D), QUA (E), and TRI (F) muscles from sham-castrated mice (blue) and from mice killed 2–10 weeks after castration (red) were dissected and weighed. Sham-castrated and castrated groups (n = 4 each) were compared by one-way ANOVA with Dunnett's testing. Columns are mean (milligrams), bars are SEM; *, P < .05; **, P < .01; ***, P < .001 vs sham-castrated group.
ActRIIB ligand blockade reverses castration-induced loss of body mass and strength
The ActRIIB-Fc soluble receptor, composed of the extracellular portion of the ActRIIB receptor fused to the immunoglobulin Fc region, acts as a ligand trap, blocking signaling of the cognate ligands (36). Surface plasmon resonance and affinity precipitation with ActRIIB-Fc have identified the TGFβ superfamily members myostatin, activin A, activin B, and activin AB, as well as bone morphogenic protein (BMP)-9, BMP-10, and GDF11 as likely physiological ligands for ActRIIB (37, 38). With the exception of BMP-9 and BMP-10, these ligands were found to negatively regulate muscle mass in vitro (38), and in vivo (39, 40), and are therefore strong candidates to function as soluble effectors of ADT-induced sarcopenia. We treated castrated mice with 10-mg/kg ActRIIB-Fc (or vehicle) over a period of 10 weeks and monitored for the development of sarcopenia endpoints, similar to Figures 1–3. Ultrasound imaging demonstrated that the prostates of ActRIIB-Fc-treated mice regressed to the same degree as vehicle control-treated castrated mice, indicating elimination of circulating androgens (Figure 5A). We observed a small, but significant, delay of about a week in prostate regression for the ActRIIB-Fc-treated mice relative to the vehicle-treated mice, which may be due to the complex effects of ligand inhibition on prostate growth (41). Similar to Figure 1B, relative body mass is reduced somewhat in the castrated animals and ActRIIB-Fc treatment reverses this effect (Figure 5B). More importantly, castration induced a steady decline in mouse grip strength (Figure 5C, red), almost identical to that observed in Figure 3, and this decline was completely abrogated in castrated animals treated with ActRIIB-Fc (Figure 5C, green).
Figure 5. ActRIIB decoy receptor (ActRIIB-Fc) inhibits castration-induced sarcopenia.
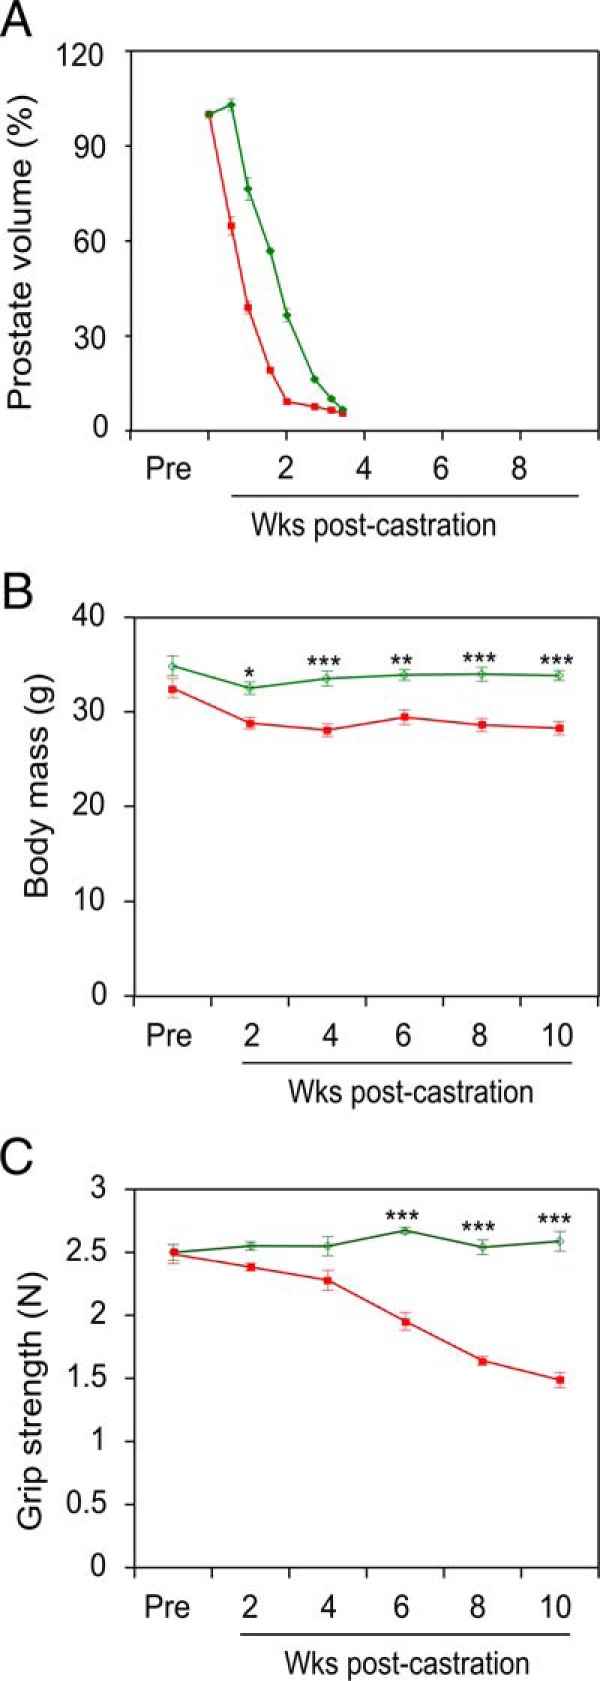
VP volume (A), body mass (B) and grip strength (C) were measured postcastration in vehicle (red)- vs ActRIIB-Fc (green)-treated mice. Vehicle- and ActRIIB-Fc-treated groups (n = 5 each) were compared by two-way ANOVA with Tukey's honest significant difference testing. Mean ± SEM, *, P < .05; **, P < .01; ***, P < .001 vs vehicle-treated group.
ActRIIB ligand blockade reverses castration-induced skeletal muscle regression
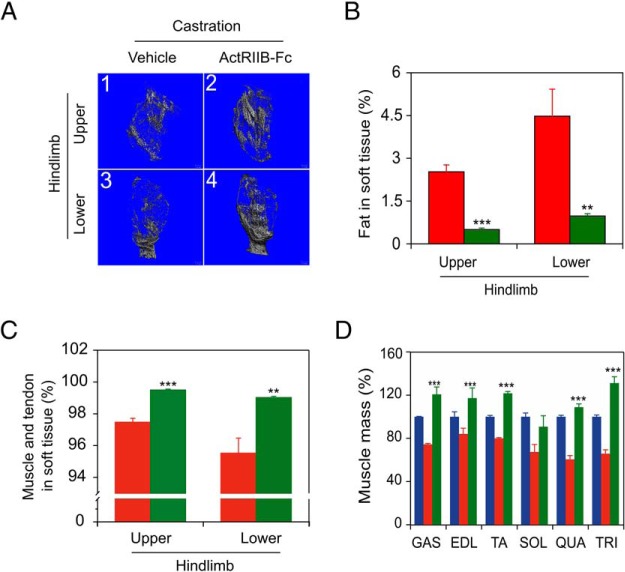
Micro-CT imaging was performed at 10 weeks after castration to assess the effect of ActRIIB-Fc treatment on body mass composition of castrated mice (Figure 6A). Vehicle-treated mice postcastration had a 5- to 10-fold increase in fat outside of the bone compartment (Figure 6B), and this increase was blocked by ActRIIB-Fc treatment, to levels seen in intact mice (cf Figure 2B). Coordinately, ActRIIB-Fc treatment reversed castration-induced loss of lean muscle in both the upper (thigh) and lower (calf) compartments of the castrated mouse hindlimb (Figure 6C).
Figure 6. ActRIIB-Fc prevents castration-induced sarcopenia.
Mice from Figure 5 were analyzed by micro-CT. A, Images of lean (gray) and fat (empty area among lean tissue) tissue from upper hindlimb (1, vehicle-treated femur; 2, ActRIIB-Fc-treated femur) and lower hindlimb (3, vehicle-treated tibialis; 4, ActRIIB-Fc-treated tibialis) of castrated mice. B, Fat in total soft tissue (mean fat mass, % of total). C, Muscle and tendon in soft tissue (mean lean mass, % of total) analyzed and calculated from micro-CT results. D, Mass of dissected muscle 10 weeks after castration, % of sham-castrated group (blue, sham data from Figure 4); GAS, EDL, TA, SOL, QUA, and TRI. Vehicle (red)- and ActRIIB-Fc (green)-treated castrated groups (n = 5 each) were compared by one-way ANOVA with Dunnett's testing. Columns are mean (%), bars are SEM; ***, P < .001 vs vehicle-treated castrated group.
Immediately after micro-CT imaging, vehicle and ActRIIB-Fc-treated mice were killed, and individual muscles were isolated and weighed (Figure 6D). Comparison of the mass of muscles from sham-castrated controls with the masses from the castrated plus vehicle administration mice (Figure 6D, blue vs red, sham data from Figure 4), revealed that castration resulted in a significant (P < .05) loss of muscle mass for most of the muscles (GAS, TA, SOL, QUA, and TRI) examined, with the exception of the EDL, essentially identical to the observations for the separate sets of castrated animals examined in Figures 2D and 4. ActRIIB-Fc treatment of castrated mice dramatically reversed (P < .001) this castration-induced loss of the muscle mass (Figure 6D, green vs red), paralleling the observed reversal of grip strength loss in these mice (Figure 5C). The only exception was the SOL muscle. ActRIIB-Fc treatment further increased the mass of the GAS, TA, and TRI muscles significantly beyond the intact (noncastrated) control (Figure 6D, green vs blue). It is uncertain why these muscles grew to exceed normal, but the key observation is that the effects of castration on muscle mass are reversed by ActRIIB-Fc treatment.
Castration induces TGFβ superfamily cytokines in skeletal muscle
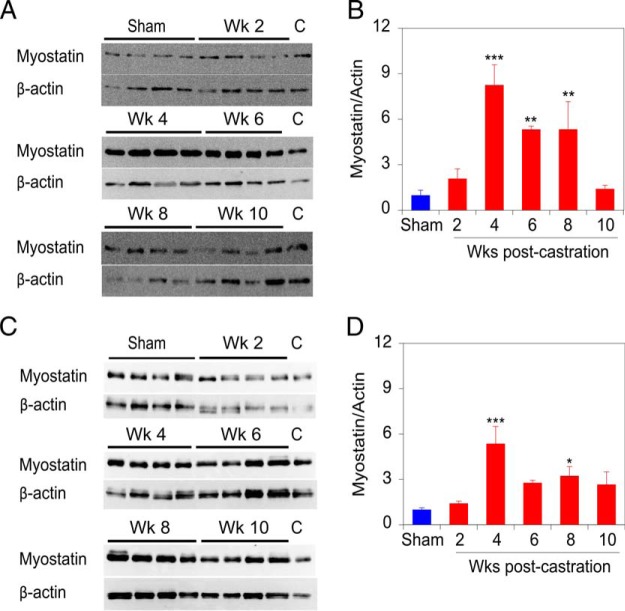
Reversal of ADT-induced sarcopenia by the ActRIIB-Fc implies a requirement for 1 or more of the cognate ligands. To determine which TGFβ superfamily ligand might be responsible for strength changes and to determine whether a temporal connection exists between ligand expression and strength loss, we examined the expression of TGFβ superfamily ligands that bind this receptor. Myostatin levels in the mouse muscle samples were quantitated by immunoblotting NP-40 lysates of the dissected muscles. The predominant myostatin protein species detected on the immunoblot has an apparent molecular weight of 25 kDa (Supplemental Figure 1), corresponding to a reducing and denaturant resistant dimer of apparent molecular weight 25 kDa, which represents the biologically relevant form of myostatin (42). Immunoblotting of GAS muscle extracts from 4 mice (Figure 7A) and quantification of triplicate determinations indicates that myostatin levels significantly increase from 4 to 8 weeks after castration, concordant with strength loss (Figure 7B). Immunoblotting analysis of TRI muscle extracts reveals a very similar expression profile for myostatin postcastration (Figure 7, C and D).
Figure 7. Castration induces myostatin protein levels in skeletal muscle.
A, Representative immunoblots of myostatin and β-actin (reprobing of the myostatin blot) expression in GAS muscle. B, Quantification of mean myostatin levels in GAS muscles from 4 mice at each time, assessed by 3 independent measurements. C, Representative immunoblot of myostatin and β-actin (reprobing of the myostatin blot) expression level in TRI muscle. Lanes of immunoblots marked (C) contain identical control sample for interblot comparison. D, Quantification of mean myostatin levels in TRI muscles from 4 mice at each time, assessed by 3 independent measurements. The values shown in B and D are relative to the sham-castrated (0-wk castrate) animals. Sham-castrated (blue) and castrated groups (red) were compared by one-way ANOVA with Dunnett's testing. Bars are SEM; *, P < .05; **, P < .01; ***, P < .001 vs sham-castrated group.
In order to discriminate among the 3 activin isoforms, soluble extracts from crushed GAS and TRI muscles (Figure 4) were assayed by ELISA to quantitate A or B chain homodimers, or the AB heterodimer. There was no detectable cross-reaction among the ELISA assays for activins A, AB, and B (data not shown). Activin A levels rise before the onset of strength loss, increasing almost 2-fold in both GAS and TRI muscles at 2 and 4 weeks after castration, and then declining to sham-castrated levels (Figure 8, A and E). Similarly, activin AB levels rise before the onset of strength loss, increasing almost 2-fold in GAS and 4-fold in TRI muscles only at 2 weeks after castration, and again return to sham-castrated levels (Figure 8, C and G). Activin B levels show a more variable, but generally late increase, with increases in the level in both GAS and TRI observed at only 8 weeks after castration (Figure 8, B and F). Finally, the levels of GDF11 were also assessed by ELISA as no suitable antibodies for immunoblotting were identified. The levels of GDF11 are also variable but recapitulate the pattern of activin B, up 6-fold in GAS and 5-fold in TRI muscles at 10 weeks after castration (Figure 8, D and H). In summary, ADT induces the expression of 5 ActRIIB ligands in muscle, with 3 distinct temporal patterns induction postcastration: activins A and AB are up before the onset of strength loss (Figure 8, A and E, and C and G), myostatin increases coincident with strength loss (Figures 3 and 7), and activin B and GDF11 increase after the onset of strength loss (Figure 8, B and F, and D and H).
Figure 8. Activin and GDF11 protein levels increase postcastration in mouse skeletal muscles.
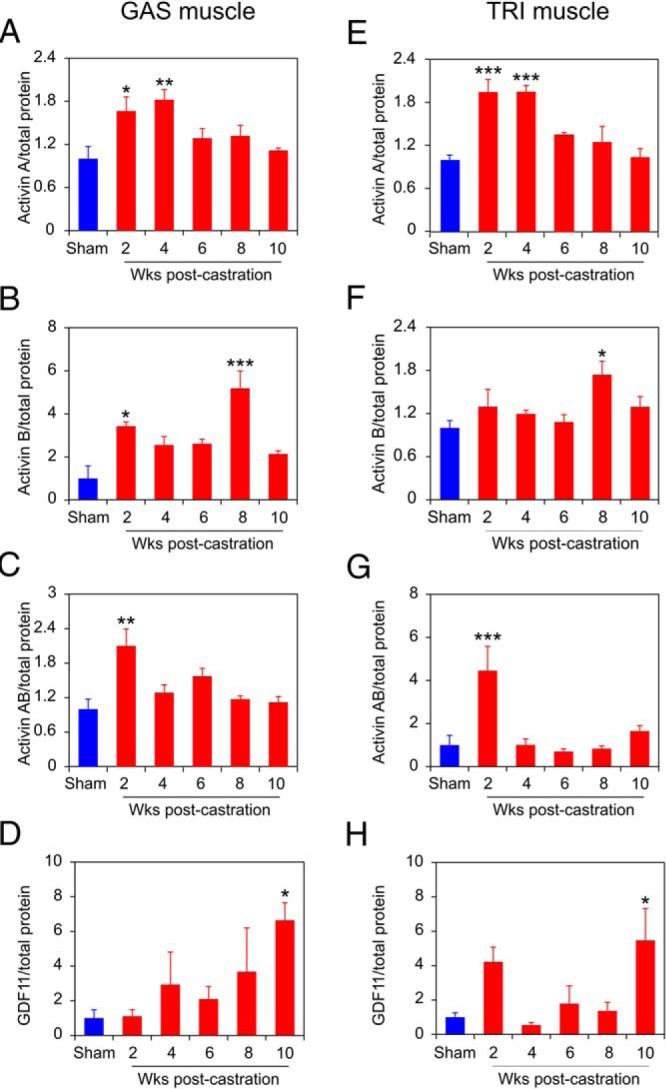
Protein levels of activin A (A), activin B (B), activin AB (C), and GDF11 (D), respectively, in GAS muscles from 4 mice at each time, assessed by 3 independent measurements. Protein levels of activin A (E), activin B (F), activin AB (G), and GDF11 (H), respectively, in TRI muscles from 4 mice at each time, assessed by 3 independent measurements. ELISA quantification of cytokine concentration was normalized to total protein concentration of each sample, and then normalized to sham-castrated control. Sham-castrated (blue) and castrated (red) groups were compared by one-way ANOVA with Dunnett's testing. Columns are normalized means, bars are SEM; *, P < .05; **, P < .01; ***, P < .001 vs sham-castrated group.
Castration induces Smad phosphorylation in skeletal muscle
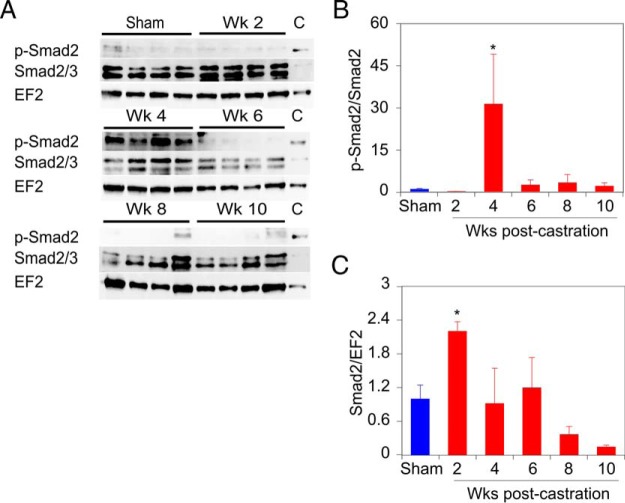
To determine whether the induction of TGFβ superfamily ligands activated signaling in skeletal muscle, extracts of TRI muscles examined in Figure 7 were interrogated for phosphorylation of the receptor activated Smad2 protein. Phospho-Smad and total Smad2 levels in the mouse muscle samples were quantitated by immunoblotting NP-40 lysates of the dissected muscles. The anti-phospho-Smad antibody detects both phospho-Smad3 (S423/S425) and phospho-Smad2 (S465/S467), but immunoblots of the same muscle extracts examined for myostatin expression show only a band of approximately 60 kDa, the size of Smad2 (Figure 9A and Supplemental Figure 2). The anti-Smad2 antibody similarly detects both Smad2 at 60 kDa and Smad3 at 52 kDa (Figure 9A and Supplemental Figure 2), and only the 60-kDa band was quantitated. The overall proportion of phosphorylated Smad2 increases dramatically at 4 weeks after castration (Figure 9B), whereas the relative level of total Smad2 protein increases modestly in the 2-week sample (Figure 9C). The dramatic increase in phospho-Smad2 at 4 weeks after castration suggests that the increase in myostatin at that time is primarily responsible for the increase in phospho-Smad2 and may lead to the loss of muscle mass and strength seen 6 weeks after castration.
Figure 9. Phosphorylation of Smad2 increases at 4 weeks after castration in mouse skeletal muscle.
A, Representative immunoblots of phospho-Smad2, total Smad2 (upper band), and EF2 (reprobing of phospho-Smad2 blot) expression level in TRI muscle. Lanes of immunoblots marked (C) contain identical control sample for interblot comparison. B, Quantification of phospho-Smad2 levels, relative to total Smad2, in TRI muscles from 4 mice at each time, assessed by 3 independent measurements. C and B, Quantification of Smad2 levels, relative to EF2, in TRI muscles from 4 mice at each time, assessed by 3 independent measurements. Expression levels of phospho-Smad2 and total Smad2 were first normalized to EF2 expression in each sample and then to the internal standard on each gel/filter. The values shown in B and C are relative to the sham-castrated (0-wk castrate) animals. Sham-operated and castrated groups compared by one-way ANOVA with Dunnett's testing. Bars are SEM; *, P < .05 vs sham-operated group.
Discussion
Many PrCa patients receiving ADT are affected by a syndrome of obese frailty, and the constituent sarcopenia dramatically reduces their quality of life (10–15). Although other ADT comorbidities can be addressed medically (11), the need for novel therapies to address ADT-induced sarcopenia remains unmet (10, 11, 15, 22–24). The loss of androgen signaling induces a set of TGFβ ligands, which in turn regulate muscle homeostasis. Identification of the causative cytokines regulated by ADT would provide clinical biomarkers to confirm the onset of sarcopenia and identify targets for therapy. Given the general success in delivering either neutralizing monoclonal antibodies or soluble receptors that act as ligand traps, future application of ligand-targeted therapies lies in the precise identification of the relevant ligands.
We describe the first mouse model of ADT-induced sarcopenia that closely resembles the phenotype seen in PrCa patients, including loss of skeletal muscle strength, a reduction in lean muscle mass, and increased adipose tissue, which results in a syndrome of obese frailty. This syndrome in humans is not the result of tumor cachexia, which as part of the loss in total body mass, includes loss of both lean muscle mass and fat. Rather, the ADT-induced obese frailty syndrome results specifically from sarcopenic loss of skeletal muscle mass and function and does not include tumor-induced lipolysis nor the generalized wasting characteristic of cachexia. Indeed, our mouse model showed little change in overall total body mass postcastration (Figures 1 and 5). At 15 weeks after castration, we were able to discern a specific increase in fat mass, a decrease in both overall lean mass and individual muscle masses (Figure 2) and a loss of grip strength in the castrated mice (Figure 3). These characteristics are all indicative of obese frailty and sarcopenia. Temporally dissecting this castration-induced sarcopenia by examining both strength and individual muscle mass change biweekly, we were able to detect significant muscle loss by 6 weeks after castration (Figure 4), corresponding exactly to the onset of strength loss (Figure 3). These changes were reversed after activin receptor IIB signaling blockade (Figures 5 and 6).
Two other groups have studied activin receptor IIB signaling blockade of ADT-induced sarcopenia, but neither of these studies fully recapitulated the characteristics of the clinical syndrome. Koncarevic et al (27) found that castration led to fat gain and increased total body mass, but no change in overall lean mass, nor in the mass of the individual muscles (GAS, femoris, pectoralis) examined. Signaling blockade did increase muscle mass above castrate levels while reversing the fat gain (27). In contrast to our study, they did not demonstrate loss of lean mass overall nor of individual muscle masses, likely because of the abundance of developmentally regulated GHs in the relatively young (9-wk-old) mice they studied. These younger mice are not likely to be an accurate reflection of the typical PrCa patient, typically in their sixties or seventies. Chiu et al also demonstrate that activin receptor IIB blockade reversed castration-induced muscle mass loss (in 1 muscle) and in situ strength loss (33). It is uncertain whether their limited study fully recapitulates the human obese frailty syndrome, because they did not examine body composition (LBM and fat content) after castration. Notably, neither study examined strength in live animals in the context of castration-induced sarcopenia. Thus, a key contribution of our study is the demonstration of the relevant characteristics of the obese frailty syndrome, and their longitudinal development, in a cohort of moderately aged mice that are physiologically analogous to the population of PrCa patients undergoing ADT.
Multiple lines of evidence indicate that TGFβ superfamily cytokines related to myostatin are key regulators of muscle development and homeostasis. Myostatin itself has a profound effect on muscle development, germline knockout animals have approximately double the muscle mass of littermate controls in mice (43), dogs (44), cows (42), and a human (45). Blocking myostatin with an antimyostatin peptibody or monoclonal antibody reduced muscle loss and fat accumulation in human clinical studies of ADT-induced sarcopenia, normal volunteers, aging, or muscular dystrophies, but this blockade failed to reliably increase strength measures in these patients (46–48). In contrast, ActRIIB-Fc, a more promiscuous ligand trap capable of binding myostatin, activin A, activin B, and activin AB, as well as BMP-9, BMP-10, and GDF11, has robust effects on both muscle mass and strength gains, indicating that blockade of at least 1 additional TGFβ family member is required to reverse sarcopenia (36, 49, 50). ActRIIB-Fc has been shown to promote the effective maintenance and integrity of skeletal muscle in aging mice, and in multiple cancer cachexia models, as well as in castrated mice (25–28, 33). Many of these preclinical studies of ActRIIB-Fc on body mass, muscle size, and muscle strength failed to account for the continued growth of younger mice vs older mice (which had already attained their mature mass), where a reduction due to castration has been reported (51). Despite this focus on early events in younger (∼3-mo-old) mice, these studies nonetheless suggest that myostatin and at least 1 other TGF superfamily member are required for the production of the complete sarcopenic phenotype (52).
Using the temporally defined sarcopenic muscle samples (Figure 4), we examined the expression of plausible candidate drivers of muscle loss in extracts of the muscle tissue. Myostatin was highly expressed immediately before and concordant with the observed loss of strength in the GAS, and somewhat less dramatically in the TRI (Figure 7). In contrast, activin A and AB were increased before the loss of strength and muscle mass, whereas activin B was most clearly increased after the physiological changes had commenced (Figure 8). GDF11 was recently posited to control aging and rejuvenation of cardiac and skeletal muscle (39, 53), but more recently, it has been revealed as a negative regulator of muscle homeostasis (54, 55). Surprisingly, in our model, GDF11, like activin B, was reproducibly increased only well after the onset of strength loss (Figure 8), and so these 2 ligands are not likely to play a role in establishing ADT-induced muscle loss but rather may maintain sarcopenia post-ADT.
We also investigated changes in circulating TGF superfamily members post-ADT in our mouse model. ELISA for myostatin and activin A levels after castration in wild-type mice (same mice used in Figure 4) showed no significant alterations of these circulating cytokines (Supplemental Figure 3). We expected increases in some of these ligands in serum, as negative regulators of myogenesis, similar to the effects observed in glucocorticoid-induced sarcopenia (56) and in cirrhosis (57), which leads to hypogonadism and reduced serum testosterone levels. Because testosterone regulates myostatin mRNA levels (58), myostatin protein was therefore particularly expected to be regulated. Although the reason we saw no change is uncertain, it may be that circulating myostatin levels rapidly increase early (at the onset of prostate regression, between wk 0 and 2) and then rebound to somewhat reduced levels. Similar kinetics of myostatin expression have been reported after other insults that induce loss of muscle mass (59). It is also possible that as up to 90% of myostatin is complexed with follistatin and other circulating binding proteins (60), serum levels of these cytokines are not accurate reflections of the level in muscle and muscle interstitial space, where these TGFβ superfamily members are expected to exert their effects on mass.
Myostatin inhibiting antibodies have been developed as therapies for diseases of muscle loss (due to Duchenne muscular dystrophy, disuse, tumor cachexia, etc). Unfortunately, although several of these have restored muscle volume in human trials, none of these antibodies has effectively restored strength (reviewed in Ref. 61). ActRIIB ligand trap reagents increase both muscle volume and strength in human trials (50, 61). However, during phase II trials of ActRIIB-Fc (ACE-031), patients developed gum and nose bleeds, skin telangiectasias, and further testing of this drug was halted (50, 61). Thus, a more specific blocking regimen, with fewer comorbidities, is needed in order to preserve muscle volume and strength for sarcopenic patients. Elucidation of which muscle regulating ligands are expressed in patients undergoing ADT and the kinetics of that expression may therefore contribute to development of a more rational therapy.
In conclusion, our older cohort of mice display sarcopenia that is very similar to the condition seen in men receiving ADT: a loss of lean muscle mass overall and a loss of mass of individual muscles that is coordinated with a loss of function, in the form of grip strength. This sarcopenic phenotype was fully reversed by ActRIIB-Fc treatment. Importantly, our use of older mice more accurately models ADT-induced sarcopenia in PrCa patients and define a pattern of ActRII ligand modulation. Future investigations, including specific ablation of the genes encoding these cytokines, will be required to define the precise role and possible redundancy of TGFβ ligands in obese frailty. Our discovery of punctuated expression of TGFβ family members in response to ADT suggests a “window of opportunity” where blocking 2 or more of these induced ligands will yield maximum therapeutic effect while minimizing comorbidities.
Acknowledgments
We thank the University of Rochester Center for Musculoskeletal Research (directed by Dr Edward Schwarz, Department of Orthopedics) for access to micro-CT and ultrasound instrumentation and Dr Steve Welle for the grip strength apparatus and valuable discussions. We also thank Dr Scott Pearsall of Acceleron Pharma, Inc for RAP-031; Michael Thullen for assistance in implementing the micro-CT for soft tissue analysis and analyzing the resulting data; and Alanna Klose for technical assistance, data analysis, and valuable discussions.
This work was supported by the New York State Prostate Cancer Research Program Award C030321 and the S.A.S. Foundation Grant HHS-6-15SF (to K.L.N.), the Congressionally Directed Medical Research Program Award W81XWH-14-1-0454 (to J.V.C.), and National Cancer Institute Grants CA151753 (to J.J.K.) and P30AR061307 and P30CA016056.
Disclosure Summary: The authors have nothing to disclose.
Funding Statement
This work was supported by the New York State Prostate Cancer Research Program Award C030321 and the S.A.S. Foundation Grant HHS-6-15SF (to K.L.N.), the Congressionally Directed Medical Research Program Award W81XWH-14-1-0454 (to J.V.C.), and National Cancer Institute Grants CA151753 (to J.J.K.) and P30AR061307 and P30CA016056.
For News & Views see page 4206
- ADT
- androgen deprivation therapy
- BMP
- bone morphogenetic protein
- EDL
- extensor digitorum longus
- EF2
- elongation factor 2
- GAS
- gastrocnemius
- GDF
- growth differentiation factor
- LBM
- lean body mass
- micro-CT
- microcomputed tomography
- NP-40
- Nonidet P-40
- PrCa
- prostate cancer
- QUA
- quadriceps
- SOL
- soleus
- TA
- tibialis anterior
- TRI
- triceps
- VP
- ventral prostate.
References
- 1. Gilbert SM, Kuo YF, Shahinian VB. Prevalent and incident use of androgen deprivation therapy among men with prostate cancer in the United States. Urol Oncol. 2011;29:647–653. [DOI] [PMC free article] [PubMed] [Google Scholar]
- 2. Horstman AM, Dillon EL, Urban RJ, Sheffield-Moore M. The role of androgens and estrogens on healthy aging and longevity. J Gerontol A Biol Sci Med Sci. 2012;67:1140–1152. [DOI] [PMC free article] [PubMed] [Google Scholar]
- 3. Lexell J, Taylor CC, Sjöström M. What is the cause of the ageing atrophy? Total number, size and proportion of different fiber types studied in whole vastus lateralis muscle from 15- to 83-year-old men. J Neurol Sci. 1988;84:275–294. [DOI] [PubMed] [Google Scholar]
- 4. Narici MV, Maffulli N. Sarcopenia: characteristics, mechanisms and functional significance. Br Med Bull. 2010;95:139–159. [DOI] [PubMed] [Google Scholar]
- 5. Bylow K, Hemmerich J, Mohile SG, Stadler WM, Sajid S, Dale W. Obese frailty, physical performance deficits, and falls in older men with biochemical recurrence of prostate cancer on androgen deprivation therapy: a case-control study. Urology. 2011;77:934–940. [DOI] [PMC free article] [PubMed] [Google Scholar]
- 6. Axell AM, MacLean HE, Plant DR, et al. . Continuous testosterone administration prevents skeletal muscle atrophy and enhances resistance to fatigue in orchidectomized male mice. Am J Physiol Endocrinol Metab. 2006;291:E506–E516. [DOI] [PubMed] [Google Scholar]
- 7. Bhasin S, Woodhouse L, Casaburi R, et al. . Testosterone dose-response relationships in healthy young men. Am J Physiol Endocrinol Metab. 2001;281:E1172–E1181. [DOI] [PubMed] [Google Scholar]
- 8. Ibebunjo C, Eash JK, Li C, Ma Q, Glass DJ. Voluntary running, skeletal muscle gene expression, and signaling inversely regulated by orchidectomy and testosterone replacement. Am J Physiol Endocrinol Metab. 2011;300:E327–E340. [DOI] [PubMed] [Google Scholar]
- 9. Sinha-Hikim I, Artaza J, Woodhouse L, et al. . Testosterone-induced increase in muscle size in healthy young men is associated with muscle fiber hypertrophy. Am J Physiol Endocrinol Metab. 2002;283:E154–E164. [DOI] [PubMed] [Google Scholar]
- 10. Basaria S, Lieb J 2nd, Tang AM, et al. . Long-term effects of androgen deprivation therapy in prostate cancer patients. Clin Endocrinol. 2002;56:779–786. [DOI] [PubMed] [Google Scholar]
- 11. Grossmann M, Zajac JD. Management of side effects of androgen deprivation therapy. Endocrinol Metab Clin North Am. 2011;40:655–671, x. [DOI] [PubMed] [Google Scholar]
- 12. Hara N, Ishizaki F, Saito T, Nishiyama T, Kawasaki T, Takahashi K. Decrease in lean body mass in men with prostate cancer receiving androgen deprivation therapy: mechanism and biomarkers. Urology. 2013;81:376–380. [DOI] [PubMed] [Google Scholar]
- 13. Haseen F, Murray LJ, Cardwell CR, O'Sullivan JM, Cantwell MM. The effect of androgen deprivation therapy on body composition in men with prostate cancer: systematic review and meta-analysis. J Cancer Surviv. 2010;4:128–139. [DOI] [PubMed] [Google Scholar]
- 14. Alibhai SM, Breunis H, Timilshina N, et al. . Impact of androgen-deprivation therapy on physical function and quality of life in men with nonmetastatic prostate cancer. J Clin Oncol. 2010;28:5038–5045. [DOI] [PubMed] [Google Scholar]
- 15. Thorsen L, Nilsen TS, Raastad T, Courneya KS, Skovlund E, Fossa SD. A randomized controlled trial on the effectiveness of strength training on clinical and muscle cellular outcomes in patients with prostate cancer during androgen deprivation therapy: rationale and design. BMC Cancer. 2012;12:123. [DOI] [PMC free article] [PubMed] [Google Scholar]
- 16. Sinha-Hikim I, Cornford M, Gaytan H, Lee ML, Bhasin S. Effects of testosterone supplementation on skeletal muscle fiber hypertrophy and satellite cells in community-dwelling older men. J Clin Endocrinol Metab. 2006;91:3024–3033. [DOI] [PubMed] [Google Scholar]
- 17. Bhasin S. Testosterone supplementation for aging-associated sarcopenia. J Gerontol A Biol Sci Med Sci. 2003;58:1002–1008. [DOI] [PubMed] [Google Scholar]
- 18. Jones TE, Stephenson KW, King JG, Knight KR, Marshall TL, Scott WB. Sarcopenia–mechanisms and treatments. J Geriatr Phys Ther. 2009;32:83–89. [PubMed] [Google Scholar]
- 19. Sakuma K, Yamaguchi A. Sarcopenia and age-related endocrine function. Int J Endocrinol. 2012;2012:127362. [DOI] [PMC free article] [PubMed] [Google Scholar]
- 20. Galvão DA, Taaffe DR, Spry N, Joseph D, Newton RU. Combined resistance and aerobic exercise program reverses muscle loss in men undergoing androgen suppression therapy for prostate cancer without bone metastases: a randomized controlled trial. J Clin Oncol. 2010;28:340–347. [DOI] [PubMed] [Google Scholar]
- 21. Hanson ED, Sheaff AK, Sood S, et al. . Strength training induces muscle hypertrophy and functional gains in black prostate cancer patients despite androgen deprivation therapy. J Gerontol A Biol Sci Med Sci. 2013;68:490–498. [DOI] [PMC free article] [PubMed] [Google Scholar]
- 22. Basaria S, Bhasin S. Targeting the skeletal muscle-metabolism axis in prostate-cancer therapy. N Engl J Med. 2012;367:965–967. [DOI] [PubMed] [Google Scholar]
- 23. Galvao DA, Taaffe DR, Cormie P, et al. . Efficacy and safety of a modular multi-modal exercise program in prostate cancer patients with bone metastases: a randomized controlled trial. BMC Cancer. 2011;11:517. [DOI] [PMC free article] [PubMed] [Google Scholar]
- 24. Sanchis-Gomar F. The skeletal muscle-metabolism axis in prostate-cancer therapy. N Engl J Med. 2012;367:2257–2258; author reply 2258. [DOI] [PubMed] [Google Scholar]
- 25. Fearon KC, Glass DJ, Guttridge DC. Cancer cachexia: mediators, signaling, and metabolic pathways. Cell Metab. 2012;16:153–166. [DOI] [PubMed] [Google Scholar]
- 26. Han HQ, Zhou X, Mitch WE, Goldberg AL. Myostatin/activin pathway antagonism: molecular basis and therapeutic potential. Int J Biochem Cell Biol. 2013;45:2333–2347. [DOI] [PubMed] [Google Scholar]
- 27. Koncarevic A, Cornwall-Brady M, Pullen A, et al. . A soluble activin receptor type IIb prevents the effects of androgen deprivation on body composition and bone health. Endocrinology. 2010;151:4289–4300. [DOI] [PubMed] [Google Scholar]
- 28. Zhou X, Wang JL, Lu J, et al. . Reversal of cancer cachexia and muscle wasting by ActRIIB antagonism leads to prolonged survival. Cell. 2010;142:531–543. [DOI] [PubMed] [Google Scholar]
- 29. Tsuchida K, Nakatani M, Hitachi K, et al. . Activin signaling as an emerging target for therapeutic interventions. Cell Commun Signal. 2009;7:15. [DOI] [PMC free article] [PubMed] [Google Scholar]
- 30. Tsuchida K, Nakatani M, Uezumi A, Murakami T, Cui X. Signal transduction pathway through activin receptors as a therapeutic target of musculoskeletal diseases and cancer. Endocr J. 2008;55:11–21. [DOI] [PubMed] [Google Scholar]
- 31. Sartori R, Milan G, Patron M, et al. . Smad2 and 3 transcription factors control muscle mass in adulthood. Am J Physiol Cell Physiol. 2009;296:C1248–C1257. [DOI] [PubMed] [Google Scholar]
- 32. Davis JS, Nastiuk KL, Krolewski JJ. TNF is necessary for castration-induced prostate regression, whereas TRAIL and FasL are dispensable. Mol Endocrinol. 2011;25:611–620. [DOI] [PMC free article] [PubMed] [Google Scholar]
- 33. Chiu CS, Peekhaus N, Weber H, et al. . Increased muscle force production and bone mineral density in ActRIIB-Fc-treated mature rodents. J Gerontol A Biol Sci Med Sci. 2013;68:1181–1192. [DOI] [PubMed] [Google Scholar]
- 34. Singh S, Pan C, Wood R, et al. . Quantitative volumetric imaging of normal, neoplastic and hyperplastic mouse prostate using ultrasound. BMC Urol. 2015;15:97. [DOI] [PMC free article] [PubMed] [Google Scholar]
- 35. Nastiuk KL, Liu H, Hamamura M, Muftuler LT, Nalcioglu O, Krolewski JJ. In vivo MRI volumetric measurement of prostate regression and growth in mice. BMC Urol. 2007;7:12. [DOI] [PMC free article] [PubMed] [Google Scholar]
- 36. Lee SJ, Reed LA, Davies MV, et al. . Regulation of muscle growth by multiple ligands signaling through activin type II receptors. Proc Natl Acad Sci USA. 2005;102:18117–18122. [DOI] [PMC free article] [PubMed] [Google Scholar]
- 37. Koncarevic A, Kajimura S, Cornwall-Brady M, et al. . A novel therapeutic approach to treating obesity through modulation of TGFβ signaling. Endocrinology. 2012;153:3133–3146. [DOI] [PMC free article] [PubMed] [Google Scholar]
- 38. Souza TA, Chen X, Guo Y, et al. . Proteomic identification and functional validation of activins and bone morphogenetic protein 11 as candidate novel muscle mass regulators. Mol Endocrinol. 2008;22:2689–2702. [DOI] [PMC free article] [PubMed] [Google Scholar]
- 39. Loffredo FS, Steinhauser ML, Jay SM, et al. . Growth differentiation factor 11 is a circulating factor that reverses age-related cardiac hypertrophy. Cell. 2013;153:828–839. [DOI] [PMC free article] [PubMed] [Google Scholar]
- 40. Zimmers TA, Davies MV, Koniaris LG, et al. . Induction of cachexia in mice by systemically administered myostatin. Science. 2002;296:1486–1488. [DOI] [PubMed] [Google Scholar]
- 41. Dowling CR, Risbridger GP. The role of inhibins and activins in prostate cancer pathogenesis. Endocr Relat Cancer. 2000;7:243–256. [DOI] [PubMed] [Google Scholar]
- 42. McPherron AC, Lee SJ. Double muscling in cattle due to mutations in the myostatin gene. Proc Natl Acad Sci USA. 1997;94:12457–12461. [DOI] [PMC free article] [PubMed] [Google Scholar]
- 43. McPherron AC, Lawler AM, Lee SJ. Regulation of skeletal muscle mass in mice by a new TGF-β superfamily member. Nature. 1997;387:83–90. [DOI] [PubMed] [Google Scholar]
- 44. Zou Q, Wang X, Liu Y, et al. . Generation of gene-target dogs using CRISPR/Cas9 system. J Mol Cell Biol. 2015;7:580–583. [DOI] [PubMed] [Google Scholar]
- 45. Schuelke M, Wagner KR, Stolz LE, et al. . Myostatin mutation associated with gross muscle hypertrophy in a child. N Engl J Med. 2004;350:2682–2688. [DOI] [PubMed] [Google Scholar]
- 46. Padhi D, Higano CS, Shore ND, Sieber P, Rasmussen E, Smith MR. Pharmacological inhibition of myostatin and changes in lean body mass and lower extremity muscle size in patients receiving androgen deprivation therapy for prostate cancer. J Clin Endocrinol Metab. 2014;99:E1967–E1975. [DOI] [PubMed] [Google Scholar]
- 47. Wagner KR, Fleckenstein JL, Amato AA, et al. . A phase I/IItrial of MYO-029 in adult subjects with muscular dystrophy. Ann Neurol. 2008;63:561–571. [DOI] [PubMed] [Google Scholar]
- 48. Becker C, Lord SR, Studenski SA, et al. . Myostatin antibody (LY2495655) in older weak fallers: a proof-of-concept, randomised, phase 2 trial. Lancet Diabetes Endocrinol. 2015;3:948–957. [DOI] [PubMed] [Google Scholar]
- 49. Lee SJ. Extracellular regulation of myostatin: a molecular rheostat for muscle mass. Immunol Endocr Metab Agents Med Chem. 2010;10:183–194. [DOI] [PMC free article] [PubMed] [Google Scholar]
- 50. Attie KM, Borgstein NG, Yang Y, et al. . A single ascending-dose study of muscle regulator ACE-031 in healthy volunteers. Muscle Nerve. 2013;47:416–423. [DOI] [PubMed] [Google Scholar]
- 51. Rowe RW. Effect of castration on muscle growth in the mouse. J Exp Zool. 1968;169:59–64. [DOI] [PubMed] [Google Scholar]
- 52. de Rooy C, Grossmann M, Zajac JD, Cheung AS. Targeting muscle signaling pathways to minimize adverse effects of androgen deprivation. Endocr Relat Cancer. 2016;23:R15–R26. [DOI] [PubMed] [Google Scholar]
- 53. Sinha M, Jang YC, Oh J, et al. . Restoring systemic GDF11 levels reverses age-related dysfunction in mouse skeletal muscle. Science. 2014;344:649–652. [DOI] [PMC free article] [PubMed] [Google Scholar]
- 54. Brun CE, Rudnicki MA. GDF11 and the mythical fountain of youth. Cell Metab. 2015;22:54–56. [DOI] [PubMed] [Google Scholar]
- 55. Egerman MA, Cadena SM, Gilbert JA, et al. . GDF11 increases with age and inhibits skeletal muscle regeneration. Cell Metab. 2015;22:164–174. [DOI] [PMC free article] [PubMed] [Google Scholar]
- 56. Ma K, Mallidis C, Bhasin S, et al. . Glucocorticoid-induced skeletal muscle atrophy is associated with upregulation of myostatin gene expression. Am J Physiol Endocrinol Metab. 2003;285:E363–E371. [DOI] [PubMed] [Google Scholar]
- 57. Dasarathy S, Dodig M, Muc SM, Kalhan SC, McCullough AJ. Skeletal muscle atrophy is associated with an increased expression of myostatin and impaired satellite cell function in the portacaval anastamosis rat. Am J Physiol Gastrointest Liver Physiol. 2004;287:G1124–G1130. [DOI] [PubMed] [Google Scholar]
- 58. Mendler L, Baka Z, Kovács-Simon A, Dux L. Androgens negatively regulate myostatin expression in an androgen-dependent skeletal muscle. Biochem Biophys Res Commun. 2007;361:237–242. [DOI] [PubMed] [Google Scholar]
- 59. Baumann AP, Ibebunjo C, Grasser WA, Paralkar VM. Myostatin expression in age and denervation-induced skeletal muscle atrophy. J Musculoskelet Neuronal Interact. 2003;3:8–16. [PubMed] [Google Scholar]
- 60. Lakshman KM, Bhasin S, Corcoran C, et al. . Measurement of myostatin concentrations in human serum: circulating concentrations in young and older men and effects of testosterone administration. Mol Cell Endocrinol. 2009;302:26–32. [DOI] [PubMed] [Google Scholar]
- 61. Smith RC, Lin BK. Myostatin inhibitors as therapies for muscle wasting associated with cancer and other disorders. Curr Opin Support Palliat Care. 2013;7:352–360. [DOI] [PMC free article] [PubMed] [Google Scholar]
- 62. Yoo KS, Nastiuk KL, Krolewski JJ. Transforming growth factor β1 induces apoptosis by suppressing FLICE-like inhibitory protein in DU145 prostate epithelial cells. Int J Cancer. 2009;124:834–842. [DOI] [PubMed] [Google Scholar]


