

Abstract
The arcuate nucleus of the hypothalamus represents a key center for the control of appetite and feeding through the regulation of 2 key neuronal populations, notably agouti-related peptide/neuropeptide Y and proopimelanocortin (POMC)/cocaine- and amphetamine-regulated transcript neurons. Altered regulation of these neuronal networks, in particular the dysfunction of POMC neurons upon high-fat consumption, is a major pathogenic mechanism involved in the development of obesity and type 2 diabetes mellitus. Efforts are underway to preserve the integrity or enhance the functionality of POMC neurons in order to prevent or treat these metabolic diseases. Here, we report for the first time that the nitric oxide (NO−) donor, sodium nitroprusside (SNP) mediates anorexigenic actions in both hypothalamic tissue and hypothalamic-derived cell models by mediating the up-regulation of POMC levels. SNP increased POMC mRNA in a dose-dependent manner and enhanced α-melanocortin-secreting hormone production and secretion in mHypoA-POMC/GFP-2 cells. SNP also enhanced insulin-driven POMC expression likely by inhibiting the deacetylase activity of sirtuin 1. Furthermore, SNP enhanced insulin-dependent POMC expression, likely by reducing the transcriptional repression of Foxo1 on the POMC gene. Prolonged SNP exposure prevented the development of insulin resistance. Taken together, the NO− donor SNP enhances the anorexigenic potential of POMC neurons by promoting its transcriptional expression independent and in cooperation with insulin. Thus, increasing cellular NO− levels represents a hormone-independent method of promoting anorexigenic output from the existing POMC neuronal populations and may be advantageous in the fight against these prevalent disorders.
The hypothalamus represents a key center for the control of appetite and feeding through the regulation of essential neuronal populations comprising it. These neurons predominately reside within the arcuate nucleus and include those expressing orexogenic agouti-related peptide (AgRP)/neuropeptide Y (NPY) and anorexigenic proopimelanocortin (POMC)/cocaine- and amphetamine-regulated tran script neuropeptides. In response to nutrients and hormones derived centrally or from the periphery, AgRP/NPY and POMC/cocaine- and amphetamine-regulated transcript neuropeptides act in concert on secondary neurons to maintain a healthy appetite and weight necessary to prevent under- and overnutrition and accompanying metabolic pathologies (1).
High-fat diets and the ensuing energy imbalances, such as those observed in obesity and type 2 diabetes mellitus, disrupt this intricate neuronal system by promoting a significant and selective loss of POMC neurons (2–4). Furthermore, surviving POMC neurons exhibit a dampened response to anorexigenic hormones, leptin and insulin, due to the copresentation of systemic leptin and insulin resistance (5, 6). The reduced anorexigenic input from the hypothalamus represents a major pathogenic mechanism for the onset and perpetuation of these diseases and as such extensive effort is underway to promote neuronal survival and potentiation of existing POMC populations, particularly in a hormone-independent manner.
In addition to POMC deficiency, obese and diabetic mice and humans also exhibit reduced bioavailability of nitric oxide (NO−), likely as a consequence of impaired expression and activity of NO− synthases (NOSs) together with heightened production of superoxide, which converts this biomolecule to peroxynitrite (7–14). NO− deficiency contributes to insulin insensitivity by impeding vasodilation, reducing glucose uptake into skeletal muscles, slowing energy utilization at the levels of the mitochondria and overall decreasing energy expenditure (12, 15–18). The impact of NO− deficiency directly on appetite and feeding signals from the hypothalamus remains poorly understood, despite numerous studies investigating the impact of NO− donors and NOS regulators on feeding behavior and the spectrum of anorexigenic and orexogenic phenotypes reported in a few notable examples (14, 19–25). Studies to date have largely failed to report a detailed description of the changes in hypothalamic neuropeptide levels in response to NO− modulators, not only leaving the above phenotypes hard to reconcile but also the impact of these compounds on energy homeostasis at the level of the central nervous system (CNS), largely unknown.
Within the pituitary POMC mRNA and its proteolytic product, α-melanocortin-secreting hormone (αMSH), are both modulated by NO− bioavailability, and as such, we set out to determine whether hypothalamic POMC may also be responsive to changes in NO− levels (26, 27). In particular, we characterized the impact of the NO− donor, sodium nitroprusside (SNP) on POMC levels within hypothalamic tissue ex vivo and on mice derived cell models. Because insulin is a major modulator of POMC expression, the impact of this NO− donor on insulin independent and dependent POMC transcriptional expression was also investigated.
Materials and Methods
Reagents
The vast majority of reagents were purchased from Sigma including 2-(4-carboxyphenyl)-4,4,5,5-tetramethylimidazoline-1-oxyl-3-oxide (CPTIO), 6-chloro-2,3,4,9-tetrahydro-1H-carbazole-1-carboxamide (EX527), SNP, wortmannin, and dithiothreitol (DTT). The cell permeable cGMP analog, 8-bromo-cGMP, and the guanylate cyclase (GC) inhibitor, 1H-(1,2,4)oxadiazolo[4,3,-a]quinozalin-1-one (ODQ), were purchased from Tocris. Human insulin was gifted from Novo-Nordisk Canada, Inc. Although application of NO− gas to cells in culture can be performed, it would be difficult to control the level of NO− introduced to the cells and furthermore to equilibrate it to the levels produced from SNP. Because the decomposition of SNP into NO− and various nitrogen species in an aerobic and aqueous environment is well documented, the NO− donor SNP was determined to be the optimal treatment method.
Cell models
The GT1–7, mHypoA-NPY/GFP, and mHypoA-POMC/GFP-2 cell models were generated as previously described (28–30). Cells were maintained in DMEM (Sigma) supplemented with 5% fetal bovine serum and 1% penicillin/streptomycin (Gibco; Life Technologies) and were split into 60-mm tissue culture plates 24 hours before experimentation, with the exception of GT1–7 cells, which were grown in the presence of 10% fetal bovine serum.
Ex vivo experiments
Wildtype male CD1 mice (8 wk of age) on a chow diet were routinely euthanized at 10 am each experimental day with CO2, and their hypothalami were extracted directly into a microcentrifuge tube containing DMEM supplemented with 10μM SNP or vehicle control. After an incubation of 2 hours at 37°C, total mRNA was isolated and analyzed as described below. All procedures were carried out in accordance with protocols and guidelines approved by the University of Toronto Animal Care Committee.
mRNA isolation and quantitative real-time PCR (qRT-PCR)
Total RNA was isolated using the guanidinium thiocyanate phenol chloroform extraction method, subjected to Turbo deoxyribonuclease (DNase) (Ambion; Life Technologies) to remove contaminating genomic DNA and converted to cDNA using the Applied Biosystems (Life Technologies) High Capacity cDNA Reverse Transcriptase kit, as previously detailed (31, 32). The cDNA (25 ng) was analyzed using gene-specific primers by qRT-PCR on an Applied Biosystem Prism 7000 machine, also as previously described (33). All primers used in qRT-PCR analysis can be found in Table 1.
Table 1.
Primers Used for qRT-PCR Experiments
| Primer Name | Sequence |
|---|---|
| AgRP | Forward, 5′-CGGAGGTGCTAGATCCACAGA-3′ |
| Reverse, 5′-AGGACTCGTGCAGCCTTACAC-3′ | |
| CPE | Forward, 5′-GAGACCAAGGCTGTCATTCA-3′ |
| Reverse, 5′-ATCAGGGCAGGAACTGTATTC-3′ | |
| Histone 3a | Forward, 5′-CGCTTCCAGAGTGCAGCTATT-3′ |
| Reverse, 5′-ATCTTCAAAAAGGCCAACCAGAT-3′ | |
| NPY | Forward, 5′-TATCTCTGCTCGTGTGTTTGGGCA-3′ |
| Reverse, 5′-ATTGATGTAGTGTCGCAGAGCGGA-3′ | |
| PC1/PC3 | Forward, 5′-GAACAGCCGATTTGGATTTGG-3′ |
| Reverse, 5′-GGGCTCTAGGCTCAAAGTTATT-3′ | |
| PC2 | Forward, 5′-GCTCTGCCAGGATGACATAAA-3′ |
| Reverse, 5′-CTGCGGGTGTGTGGATAAA-3′ | |
| POMC | Forward, 5′-CCCGCCCAAGGACAAGCGTT-3′ |
| Reverse, 5′-CTGGCCCTTCTTGTGCGCGT-3′ | |
| SIRT1 | Forward, 5′-GTAAGCGGCTTGAGGGTAAT-3′ |
| Reverse, 5′-GTTACTGCCACAGGAACTAGAG-3′ | |
| POMC for ChIP (34) | Forward, 5′-TCTTGACAGCCTCTGTTGTCTCCC-3′ |
| Reverse, 5′-CTGTGCGAGGCAGGCCTAG TTCTG-3′ |
mRNA stability assay
Cells were treated with dimethyl sulfoxide (DMSO) or 60μM 5,6-dichlorobenzimidazole 1-β-D-ribofuranoside (DRB) (Sigma) for 1 hour at 37°C and subsequently exposed to SNP (100μM) or vehicle control for 4 hours. Total RNA was harvested and mRNA levels of POMC were assessed as above.
SDS-PAGE and Western blotting
Total protein was harvested by scraping the cells into Cell Lysis buffer (Cell Signaling Technology, Inc) supplemented with phenylmethylsulfonyl fluoride (PMSF), phosphatase inhibitor Cocktail 2, and protease inhibitor cocktail (Sigma). The soluble fraction was removed by centrifugation, and protein concentrations were determined using the bicinchoninic acid protein assay kit (Pierce; Thermo Fisher Scientific). Protein (50 μg) was boiled for 5 minutes in sample buffer (1M Tris-Cl, 8% [wt/vol] sodium dodecyl sulfate (SDS), 40% [vol/vol] glycerol, 50mM EDTA, 4% [vol/vol] β-mercaptoethanol, and 1mM bromophenol blue), separated on a 12% SDS-PAGE, and transferred onto polyvinylidene difluoride (PVDF) membranes using an iBlot Gel Transfer System (Life Sciences). The membranes were blocked in 5% (wt/vol) milk in Tris-buffered saline supplemented with 0.1% (vol/vol) Tween 20 (TBST) and incubated overnight at 4°C with primary antibodies diluted to 1:1000 in 5% milk-TBST. Membranes were washed for 30 minutes with TBST and incubated with horseradish peroxidase-conjugated secondary antibody (1:7500) for 1 hour. After an additional 30-minute wash in TBST, the membranes were visualized using Amersham ECL Select Western Blotting Detection Reagent (GE Healthcare) and imaged using the Kodak 1D Image Analysis Software 3.6 and a Kodak Image Station 2000R (Eastman Kodak Co).
Most antibodies used in this study were purchased from Cell Signaling Technology, Inc including anti-protein kinase B (AKT), antiphosphorylated-AKT (S473), antiphosphorylated forkhead box O1 (S256), antiinsulin receptor β, and antirabbit IgG horseradish peroxidase (HRP)-linked secondary antibody. The anti-β-actin antibody was purchased from Sigma, the anti-acetylated Forkhead box protein O1 (Foxo1) (259/262/271) antibody was purchased from Santa Cruz Biotechnology, Inc, and the antisirtuin 1 (SIRT1) was purchased from Abcam.
Enzyme immunoassay (EIA)
The mHypoA-POMC/GFP-2 cell line was seeded into 24-well plates before the addition of serum-free DMEM containing vehicle control (H2O), 10nM insulin, 100μM SNP, or 60mM KCl for 1 hour at 37°C. Media were collected, desiccated, and resuspended in assay buffer provided by the commercial αMSH EIA (Phoenix Pharmaceuticals, Inc) and processed according to the protocol provided by the manufacturer. Cells were washed with cold PBS and lysed in cell lysis buffer, and protein levels of the soluble fraction were quantified as described above. The secretion of αMSH was normalized to total protein levels for each well.
SIRT1 activity assay
The deacetylase activity of SIRT1 was determined using the SIRT1 Fluorometric assay kit from Abcam, according to instructions from the manufacturer. Briefly, mHypoA-POMC/GFP-2 cells were treated with SNP (100μM, 4–16 h), lysed in radioimmunoassy (RIA), radioimmunoprecipitation assay (RIPA) buffer supplemented with 0.2% (vol/vol) SDS, 0.1% (vol/vol) with proteases, and phosphatases described earlier. The soluble fraction was incubated with the anti-SIRT1 antibody (1 μg; Abcam) with equilibrated protein A/G sepharose beads (Santa Cruz Biotechnology, Inc) at 4°C. The beads were washed 3 times with radioimmunoassay RIPA buffer supplemented with SDS and Triton X-100 as above followed by 3 washes with SIRT1 assay buffer (50mM Tris-Cl and 0.5mM DTT; pH 8.8). The protocol provided by the manufacturer was continued as stated in the manual.
Immunocytochemistry and confocal microscopy
The mHypoA-POMC/GFP-2 cell line was seeded into 8-well chamber slides 8 hours before treatment with 100μM SNP for an additional 16 hours in serum-free media and prepared for confocal microscopy as previous described (28). Fluorescence was captured with a confocal laser-scanning microscope using an oil lens at a magnification of ×40 (LSM 510; Carl Zeiss). The fluorescence intensity of the αMSH signal was converted to a grayscale image and the background subtracted before quantification. Mean pixel intensity of the grayscale image was measured (ImageJ software, NIH; http://imagej.nih.gov/ij/) for the perinuclear region by outlying the cell.
Chromatin immunoprecipitation (ChIP)
POMC-GFP 2 cells were grown to 85% confluence in 10-cm tissue culture dishes (Sarstedt) and treated with water (vehicle) or 100μM of SNP for 1 or 4 hours. The ChIP assay was conducted using the SimpleChIP Plus Enzymatic Chromatin IP kit with Agarose beads (Cell Signaling Technology, Inc) following the manufacturer's protocol. To ensure proper performance of the ChIP assay itself, an antibody for histone H3 protein and primers for the ribosomal protein L30 gene locus (Rpl30) provided with the kit were processed alongside IP samples for the Foxo1 and the Pomc gene. Specifically, chromatin samples were incubated overnight at 4°C with a total of 2 μg of antibody per IP for the negative control normal rabbit IgG, histone H3 (provided by the kit), and Foxo1 (H-128; Santa Cruz Biotechnology, Inc). The Pomc promoter was amplified using primers designed and validated previously (Table 1) (34). For quantitative reverse transcriptase polymerase chain reaction (qRT-PCR), a total of 4 μL of DNA was loaded per 20-μL reaction and assayed in triplicate for both Pomc and Rpl30 genes per sample. The mean threshold cycle of each IP sample vehicle or 100μM SNP was compared with its own 2% input control using the following formula: percent input = 2% × 2(C(T) 2%Input Sample − C(T) IP Sample).
Statistical analysis
Experimental data were analyzed using the GraphPad Prism 5.0 software (GraphPad Software, Inc). One- or two-way ANOVA were used where appropriate with a post hoc comparison using the Least Significant Difference (LSD) or Bonferroni tests. Data were deemed statistically significant when P < .05. All data are presented as the mean ± SEM.
Results
NO− donor, SNP modulates neuropeptide expression in hypothalamic cell models
The impact of the NO− donor on the expression of hypothalamic neuropeptides was first examined ex vivo. Specifically, hypothalami from male CD1 mice at 8 weeks of age were extracted immediately after euthanasia and subjected to H2O or SNP treatment in DMEM for 2 hours at 37°C. Total mRNA was isolated, and the mRNA expression of POMC, AgRP, and NPY was determined by qRT-PCR. Relative to H2O, SNP exposure significantly up-regulated the anorexigenic ratio, POMC to AgRP + NPY in hypothalamic tissue (Figure 1A). Up-regulation of this anorexigenic ratio in response to SNP was also conserved in several hypothalamic cell models, including the mHypoA-NPY/GFPs, GT1–7s, and mHypoA-POMC/GFP-2s (Figure 1, B–D). To examine the specific impact of SNP on POMC expression, the cell line with the highest POMC mRNA levels, mHypoA-POMC/GFP-2s, was used for subsequent studies. Critically, the SNP effect on POMC expression in this cell model was both time and concentration dependent (Figure 2, A and B).
Figure 1. The NO− donor, SNP up-regulates the anorexigenic POMC to AgRP ratio in hypothalamic tissues and cell models isolated and derived from mice.

The mRNA expression of hypothalamic neuropeptides upon SNP treatment of intact hypothalami ex vivo or cell lines in vitro was determined by qRT-PCR. Specifically, SNP up-regulated the anorexigenic ratio in mice hypothalamic tissue (H2O; 0.54 ± 0.04; SNP: 0.74 ± 0.06 POMC/AgRP + NPY, n = 4–5; P = .018) (A) or mouse cell models in vitro, including the mHypoA-NPY/GFP (H2O: 0.42 ± 0.04; SNP: 0.61 ± 0.03 POMC/AgRP, n = 8; P = .001) (B), GT1–7 (H2O: 0.69 ± 0.08; SNP: 1.09 ± 0.08 POMC/AgRP + NPY, n = 5–7; P = .007) (C), and mHypoA-POMC/GFP-2 (H2O: 0.65 ± 0.06; SNP: 1.64 ± 0.10 POMC/AgRP + NPY, n = 4; P = .0001) (D) lines.
Figure 2. The NO− donor, SNP up-regulates POMC mRNA, αMSH production, and peptide secretion in the mHypoA-POMC/GFP-2 cell model.

Maximal up-regulation of POMC mRNA was observed upon exposure of mHypoA-POMC/GFP-2 cells with 100μM SNP for 4 hours relative to H2O (n = 3–8; P = .001) (A and B). C, The mRNA levels of POMC upon pretreatment with DRB (60μM, 1 h) followed by SNP (100μM, 4 h) were significantly greater than treatment with DRB and vehicle alone (H2O) (DRB/SNP: 0.99 ± 0.06, DRB/H2O: 0.66 ± 0.02 POMC/histone; n = 3–4; P = .03). D, Prolonged treatment of mHypoA-POMC/GFP-2 cells with SNP (100μM, 16 h) led to a significant up-regulation of the αMSH processing enzymes PC1/3 (H2O: 0.06 ± 0.02, SNP: 1.24 ± 0.44 PC1/3/histone; n = 4; P = .0002) and CPE (H2O: 0.99 ± 0.03, SNP: 1.16 ± 0.06 CPE/histone; n = 10–14; P = .018). E, Confocal images of mHypoA-POMC/GFP-2 cells with and without treatment with SNP (100μM, 16 h) and stained for αMSH (red) and nuclear DNA (blue) are shown. F, The level of αMSH protein was significantly enhanced upon SNP treatment relative to H2O alone (H2O: 5.0 ± 0.32 αMSH signal intensity; SNP: 10.8 ± 0.9; n = 20–26; P < .0001). G, SNP also induced αMSH secretion relative to H2O (1.02 ± 0.04 and 1.43 ± 0.1 and αMSH/total protein, respectively; n = 8–19; P = .004) and to comparable levels observed with insulin (10nM; 1.39 ± 0.06 αMSH/total protein; n = 16; P = .001) and KCl (60mM; 1.33 ± 0.07 αMSH/total protein; n = 18; P = .004).
NO− donors can lead to the stabilization or destabilization of mRNA transcripts, likely by activating and recruiting mRNA stabilizing machinery or targeting it for degradation, respectively (35–37). To determine whether SNP could enhanced mRNA stability of the POMC transcript, mHypoA-POMC/GFP-2 cells were pretreated with a transcriptional inhibitor, DRB, for 1 hour before exposure with 100μM SNP. POMC mRNA levels were subsequently monitored at 4 hours by qRT-PCR. Treatment with DRB and SNP prevented the degradation of POMC mRNA relative to vehicle controls indicating SNP enhances the mRNA stability of the transcript (Figure 2C).
To examine whether SNP treatment could also increase the translation and processing of POMC to αMSH, the expression levels of key processing enzymes, prohormone convertase 1/3 (PC1/3) and carboxypeptidase E (CPE) were assessed. Although not affecting mRNA levels of enzymes at 4 hours of exposure (data not shown), chronic treatment with SNP (100μM, 16 h) significantly enhanced the mRNA levels of both PC1/3 and CPE (Figure 2D). Of note, although the mRNA for PC2 was detected in the neurons, it was not possible to accurately assess changes due to low expression levels of the gene (data not shown). Importantly, the processing of POMC mRNA to αMSH protein was significantly enhanced in the presence of SNP (100μM, 16 h) as shown by immunocytochemistry and confocal microscopy (Figure 2, E and F).
NO− modulates the secretion of numerous neuropeptides and neurotransmitters in the CNS, including GnRH and glutamate (38–40). Because the impact of NO− on the secretion of neuropeptides involved in feeding has not been explored, we determined the impact of NO− on αMSH secretion using a commercially available EIA. Specifically, mHypoA-POMC/GFP-2 cells were treated with 100μM SNP, 10nM insulin, or 60mM KCl for 1 hour. Relative to insulin and KCl, SNP induced αMSH secretion from POMC neurons to comparable levels. Cotreatment with insulin and SNP failed to further enhance αMSH levels indicating either treatment maximizes secretion (Figure 2G). Taken together, these results indicate that POMC mRNA, protein, processing, and secretion are all elevated in the presence of the NO− donor, SNP in the mHypoA-POMC/GFP-2 cell model.
NO− relies on the generation of nitrogen species and acts independently from GC and cGMP
NO− donors can act both dependently and independently from the GC-cGMP cascade. To characterize whether SNP treatment up-regulates POMC mRNA in a GC-dependent manner, mHypoA-POMC/GFP-2 cells were pretreated with the GC inhibitor, ODQ, before SNP exposure. ODQ failed to reduce the SNP effect on POMC mRNA expression relative to DMSO alone (Figure 3A). Further, treatment with increasing concentrations of the cell-permeable cGMP analog, 8-bromo-cGMP had no effect on POMC mRNA levels relative to the H2O control (Figure 3B). Thus, SNP modulates POMC mRNA expression independent of the GC-cGMP pathway in the hypothalamic cell model.
Figure 3. SNP up-regulates POMC expression independent of GC/cGMP and dependent upon NO− radical generation in the mHypoA-POMC/GFP-2 cell line.

A, The mHypoA-POMC/GFP-2 cell model was pretreated with the GC inhibitor ODQ (1μM or 10μM, 1 h) before SNP exposure (100μM, 4 h). The presence of ODQ at either concentration did not inhibit the SNP-dependent increase in POMC mRNA (n = 5–8). B, Treatment with increasing concentrations of 8-bromo-cGMP (75μM–300μM, 4 h) did not modulate POMC mRNA levels relative to H2O treatment alone (n = 6–11). C, Cotreatment of cells with SNP (100μM) and CPTIO (200μM) significantly enhanced the SNP-mediated effect on POMC mRNA relative to SNP or CPTIO alone (SNP/CPTIO: 1.39 ± 0.09 POMC/histone mRNA; SNP/H2O: 1.02 ± 0.04; CPTIO/H2O: 0.84 ± 0.08; n = 4–10). D, Cotreatment of cells with SNP and DTT (100μM) also enhanced the SNP-mediated effect on POMC mRNA relative to SNP or DTT (SNP/DTT: 1.21 ± 0.08 POMC/histone mRNA; SNP/H2O: 0.95 ± 0.03; DTT/H2O: 0.75 ± 0.07; n = 4–10).
To determine whether nitrogen byproducts such as nitrite are essential for the effect of SNP on POMC mRNA expression, 2 compounds known to accelerate NO− decomposition to nitrite in aqueous and aerobic conditions were used, CPTIO and DTT (41–43). Cotreatment of SNP with either CPTIO or DTT further enhanced POMC mRNA expression relative to SNP treatment alone, indicating POMC may be transcriptionally up-regulated by NO− byproducts in the mHypoA-POMC/GFP-2 cell model (Figure 3, C and D).
SNP reduces SIRT1 expression and deacetylase activity
SIRT1 was recently identified as a major inhibitor of POMC transcriptional expression in the CNS (44), and thus this deacetylase represents a putative target of SNP in the mHypoA-POMC/GFP-2 cell model. Given that NO− donors can alter basal protein expression and activity by modulating mRNA stability and introducing disruptive posttranslational modifications, SIRT1 mRNA, protein, and activity levels were examined in this cell model upon SNP administration (37, 45–47). Despite a significant decrease in SIRT1 mRNA in the presence of SNP treatment (100μM, 4 h), protein levels remained constant (Figure 4, A and B). To determine whether SNP treatment modifies SIRT1 activity in the mHypoA-POMC/GFP-2 cell line, SIRT1 was immunoprecipitated from mHypoA-POMC/GFP-2 cells with and without exposure to SNP (100μM, 4 h), and the deacetylase activity of the precipitated fraction was quantified by a commercially available fluorescence assay as detailed in the methods. Interestingly, the deacetylase activity of SIRT1 was dramatically reduced upon SNP treatment indicating that NO− donors impair SIRT1 function in this experimental system (Figure 4C). NO− donors are well known to impair enzymatic activity by introducing posttranslational modifications such as S-nitrosylation into the parental protein. Despite extensive efforts in using the biotin-switch method, these posttranslational modifications were not detected on endogenous SIRT1, and overexpression systems of this protein may be required to identify these changes.
Figure 4. SNP reduces SIRT1 mRNA expression and deacetylase activity in mHypoA-POMC/GFP-2 cells.
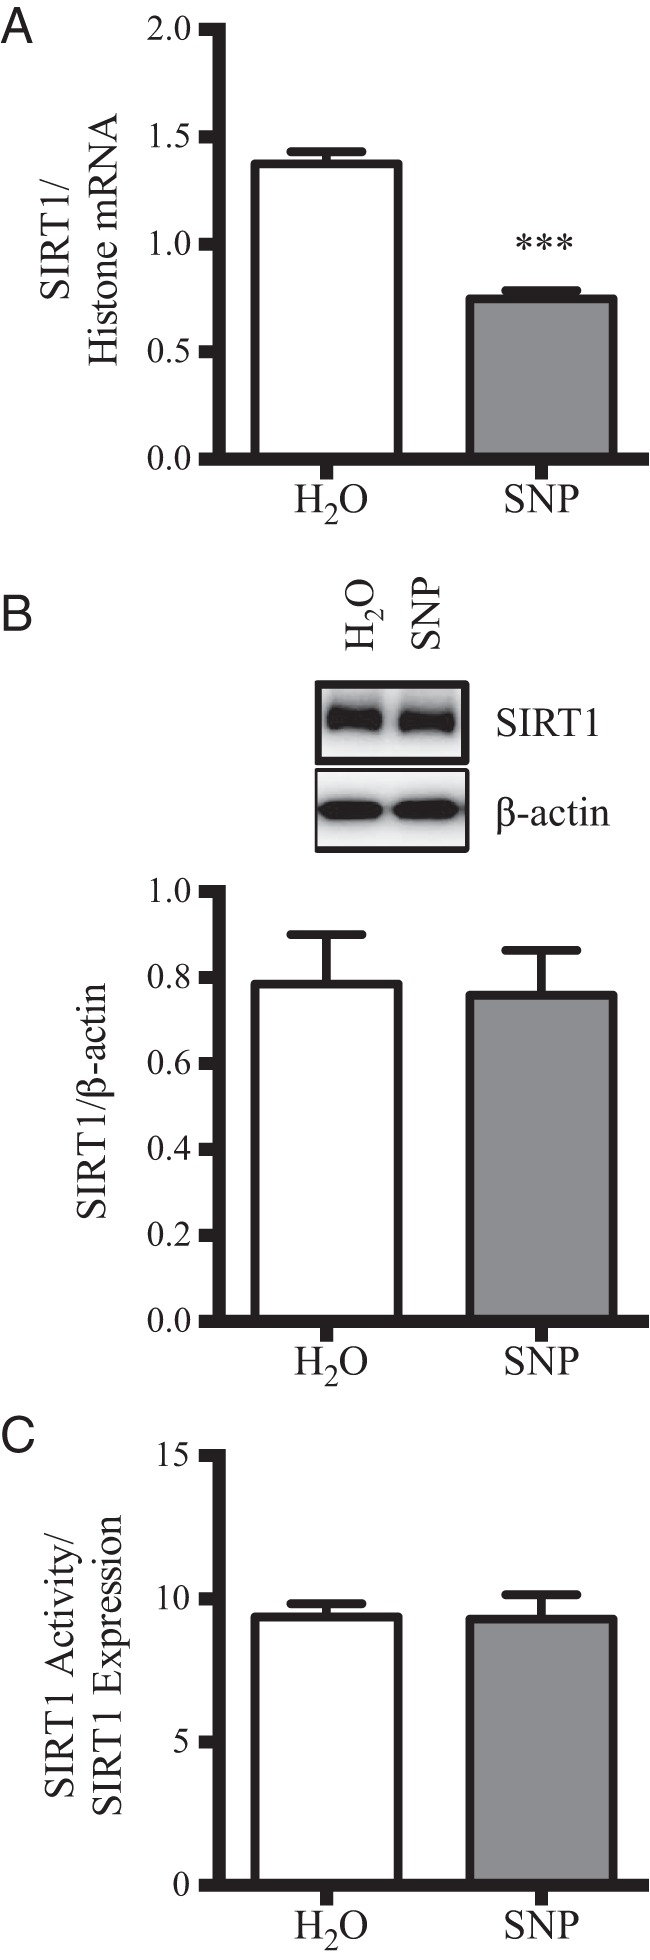
A, Treatment of mHypoA-POMC/GFP-2 cells with SNP (100μM, 4 h) led to a significant reduction in SIRT1 mRNA as shown by qRT-PCR (H2O: 1.38 ± 0.06 SIRT1/histone mRNA; 100μM: 0.75 ± 0.04; n = 4–8; P = .0001). B, No changes were detected in SIRT1 protein levels as shown by Western blotting (H2O: 0.78 ± 0.12 SIRT1/β-actin; SNP: 0.76 ± 0.10; n = 4). C, The deacetylase activity of SIRT1 was significantly reduced upon exposure to SNP (100μM, 4 h) (H2O: 22.4 ± 2.1; SNP: 8.7 ± 2.9 SIRT1 activity/expression; n = 4; P = .0087).
SIRT1 acts on numerous substrates leading to their deacetylation and to provide further evidence that SIRT1 activity is impaired upon NO− treatment, the acetylation state of its major target in hypothalamic neurons, Foxo1 was examined (48). SNP treatment significantly up-regulated Foxo1 acetylation levels relative to H2O alone (Figure 5, A and B). Because acetylated Foxo1 is more amendable to phosphorylation, a predictable enhancement of phospho-Foxo1 was also observed (Figure 5, A and B) (49). SIRT1 inhibitor, EX527, also promoted the acetylation and phosphorylation of Foxo1 in mHypoA-POMC/GFP-2 cells as expected (Figure 5, C and D). Pretreatment of cells with EX527 failed to further increase the SNP effect on POMC expression, suggesting that both SNP and EX527 may be working through similar pathways to modulate POMC mRNA levels (Figure 5E). Pretreatment with the phosphoinositide-3-kinase inhibitor, wortmannin, did not reduce SNP-mediated POMC expression, providing further evidence that SNP acts downstream of AKT (Figure 5F). Collectively, these results indicate that SNP likely acts to increase POMC expression by inhibiting SIRT1 activity and subsequently relieving the transcriptional repression of Foxo1 on the POMC gene. Because Foxo1 phosphorylation is essential in the alleviation to POMC transcriptional repression, this posttranslational modification was examined for all subsequent experiments (50).
Figure 5. SIRT1 inhibition enhances Foxo1 posttranslational modifications and POMC mRNA expression independent of PI3K phosphoinositide-3-kinase in mHypoA-POMC/GFP-2 cells.

Western blotting expression (A) and quantification (B) of AKT phosphorylation (pAKT), Foxo1 acetylation (AcFoxo1), and Foxo1 phosphorylation (pFoxo1) upon SNP treatment (100μM, 15 min). SNP enhances AcFoxo1 (H2O: 0.85 ± 0.04 AcFoxo1/β-actin; SNP: 1.04 ± 0.05; n = 5; P = .018) and pFoxo1 (H2O: 0.87 ± 0.03 pFoxo1/β-actin; SNP: 1.14 ± 0.06; n = 5; P = .004) relative to vehicle control. C and D, Pharmacological inhibition of SIRT1 using EX572 (20μM, 1 h) significantly up-regulated AcFoxo1 levels (H2O: 0.58 ± 0.06 AcFoxo1/β-actin; SNP: 0.84 ± 0.05; n = 3; P = .03) and pFoxo1 levels (H2O: 0.57 ± 0.02 pFoxo1/β-actin; SNP: 0.66 ± 0.01; n = 3; P = .01) relative to DMSO treatment alone. E, Cotreatment of SNP with EX527 failed to further enhance POMC mRNA expression relative to either treatment alone as shown by RT-PCR. F and G, Although Wortmannin pretreatment (1μM, 1 h) reduced pAKT, it did not impair the SNP-dependent increase in POMC mRNA.
Acute SNP treatment enhances insulin signaling in mHypoA-POMC/GFP-2 cells
Nuclear export of Foxo1 upon acetylation and phosphorylation in response to insulin and the subsequent transcriptional activation of POMC is a major mechanism mediating the anorexigenic actions of this hormone in the hypothalamus (51). As such, supportive actions of SNP to foster an inhibited Foxo1 state may enhance insulin signaling in POMC neurons. To test this hypothesis, the mHypoA-POMC/GFP-2 cell line was pretreated with SNP (100μM) 1 hour before insulin (10nM, 15 min). As shown by Western blotting, insulin-mediated phosphorylation of AKT and Foxo1 was significantly enhanced upon a cotreatment with this NO− donor (Figure 6, A and B). In accordance, the level of POMC mRNA was also enhanced with SNP pretreatment (100μM, 1 h) relative to insulin treatment (10nM, 4 h) alone as shown by qRT-PCR (Figure 6C). Changes in insulin signaling were not due to enhancement of insulin receptor expression in response to SNP at the protein level (Figure 6, D and E).
Figure 6. SIRT1 inhibition by SNP enhances insulin-induced Foxo1 phosphorylation (pFoxo1) and POMC expression.

A and B, Pretreatment of mHypoA-POMC/GFP-2 cells with SNP (100μM, 1 h) before the addition of insulin (10nM, 15 min) significantly enhanced AKT phosphorylation (pAKT) and pFoxo1 as shown by Western blotting. C, Cotreatment of mHypoA-POMC/GFP-2 cells with insulin (10nM) and SNP (100μM) for 4 hours significantly up-regulated POMC mRNA relative to either treatment alone. D and E, Enhanced insulin-dependent changes in POMC mRNA in the presence of SNP were not due to changes in expression of the insulin receptor (Ins Rec) as shown by Western blotting (H2O: 1.79 ± 0.10 Ins Rec/β-actin; SNP: 1.88 ± 0.16; n = 3; P = .66). F, ChIP analysis of Foxo1 occupation of the POMC promoter indicating reduced and enhanced Foxo1 binding at 1 and 4 hours of SNP exposure, respectively (H2O: 0.009 ± 0.001; SNP 1 h: 0.003 ± 0.0006; SNP 4 h: 0.022 ± 0.008 signal relative to input; n = 3–11). H3+, histone 3a positive control.
Enhanced phosphorylation and acetylation of Foxo1, such as in response to insulin and SNP observed here is known to disrupt its DNA binding ability (49). Accordingly, NO− production may not only act to enhance the stability of the POMC transcript as shown in Figure 2, but may also promote its transcription by reducing Foxo1 repression. To test this hypothesis, ChIP assays were performed on mHypoA-POMC/GFP-2 cells treated with SNP over time (100μM, 1 or 4 h). Treatment with NO− significantly reduced the Foxo1 occupancy of the POMC promoter relative to vehicle alone after 1 hour, suggesting that alleviation of Foxo1 transcriptional repression also acts to enhance POMC mRNA levels in mHypoA-POMC/GFP-2 cells (Figure 6F). After 4 hours of SNP exposure, Foxo1 association with the POMC promoter significantly increased relative to H2O alone suggesting the presence of a negative feedback loop (Figure 6F).
Prolonged SNP treatment prevents installation of insulin resistance
Chronic exposure of hypothalamic neurons to high concentrations of insulin induces insulin resistance in vivo and in vitro (28, 52, 53). Insulin resistance in the mHypoA-POMC/GFP-2 cell model was induced after a prolonged exposure to insulin (100nM, 16 h) as seen from a loss of AKT phosphorylation upon an insulin rechallenge (10nM, 15 min) (Figure 7, A and B). As expected for the insulin resistant state, the insulin rechallenge failed to further enhance POMC mRNA levels relative to H2O alone (Figure 7C). Interestingly, chronic cotreatment of insulin with SNP (16 h, 100nM or 100μM, respectively) prevented this resistance as seen by the preservation of insulin signaling leading to AKT phosphorylation and enhancement of POMC mRNA in response to an insulin rechallenge (Figure 7, A–C).
Figure 7. Prolonged treatment with SNP prevented the onset of insulin (Ins) resistance in the mHypoA-POMC/GFP-2 cell model.

A and B, Western blottings and analysis of mHypoA-POMC/GFP-2 cells pretreated for 16 hours with H2O, Ins (100nM), SNP (100 μM), or Ins + SNP (100nM and 100μM, respectively) before an Ins challenge (10nM, 15 min). Pretreatment with H2O alone allowed for Ins to significantly increase AKT phosphorylation (pAKT) (H2O: 0.15 ± 0.03 pAKT/Total AKT; +Ins: 0.42 ± 0.03; n = 3; P = .004). Ins pretreatment abolished pAKT (Ins: 0.18 ± 0.02 pAKT/Total AKT; +Ins: 0.19 ± 0.07; n = 3; P = .890). SNP cotreatment with Ins (Ins + SNP) enabled the Ins-dependent increase in pAKT (SNP + Ins: 0.53 ± 0.07 pAKT/Total AKT; +Ins: 0.84 ± 0.02; n = 3; P = .014). C, Unlike in the Ins resistant state wherein a rechallenge with Ins failed to further increase POMC mRNA, cotreatment with SNP enabled the Ins-dependent enhancement in POMC mRNA (SNP + Ins: 1.16 ± 0.11 POMC/histone mRNA; + Ins: 1.68 ± 0.20; n = 4–6; P = .02). D–G, Prolonged treatment with SNP (100μM, 16 h) significantly enhanced SIRT1 mRNA and reduced SIRT1 protein expression but did not affect SIRT1 deactylase activity. H and I, SNP cotreatment failed to prevent the loss of Ins receptor (Ins Rec) expression upon chronic Ins treatment as shown by Western blotting (Ins + H2O: 0.22 ± 0.02 Ins Rec/β-actin; Ins + SNP: 0.16 ± 0.02; n = 3; P = .07).
To determine whether SNP-dependent changes in SIRT1 expression or activity are responsible for this observation, SIRT1 mRNA, protein, and activity levels were assessed after a chronic exposure to this NO− donor (100μM, 16 h). Despite a decrease in SIRT1 protein levels, the deacetylase activity of the remaining protein was unchanged (Figure 7, E–G). These findings indicate that unlike a short-term exposure to SNP (4 h), which inhibited its deacetylase activity directly, a long-term exposure (16 h) reduced the deactylase activity indirectly by lowering SIRT1 expression in mHypoA-POMC/GFP-2 cells. Surprisingly, SNP did not prevent the reduction in insulin receptor levels notorious with insulin resistance, suggesting that this NO− donor may serve to facilitate signaling through remaining receptors (Figure 7, H and I) (54).
In order to assess whether SIRT1 inhibition alone is sufficient to prevent the installation of insulin resistance in the mHypoA-POMC/GFP-2 cell model, the cells were cotreated with insulin and the SIRT1 inhibitor, EX527. Unlike SNP, EX527 failed to prevent insulin resistance as shown by an inability to induce POMC mRNA during an insulin rechallenge (Figure 7J). Taken together, SNP may not only be inhibiting SIRT1 activity but may act through additional yet unknown pathways to prevent the installation of insulin resistance in the mHypoA-POMC/GFP-2 cell model (Figure 8).
Figure 8. Model of the multiple mechanisms NO− donors may mediate satiety in hypothalamic POMC neurons.
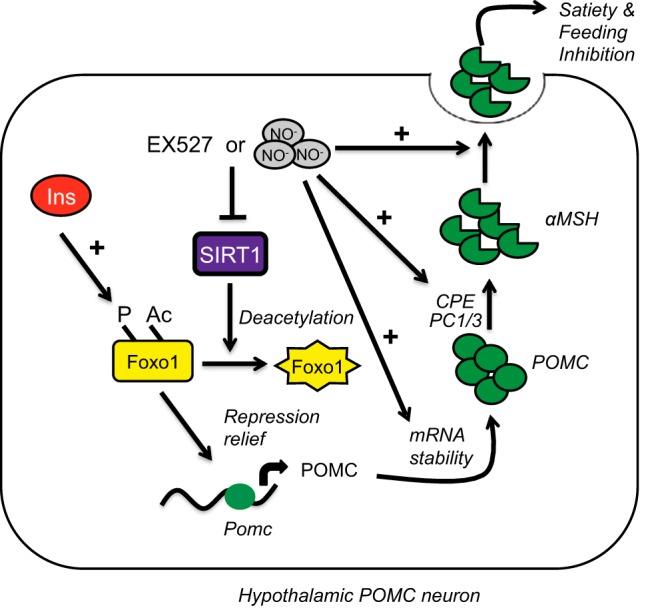
Reduction of SIRT1 activity either through inhibitory modifications such as S-nitrosylation or a decrease in protein expression promotes Foxo1 acetylation and phosphorylation. These posttranslational modifications in Foxo1 promote its nuclear export and alleviation of the brake on POMC transcription enhancing basal expression of this neuropeptide, which is further encouraged by enhanced mRNA stability of its transcript. The presence of insulin further stimulates Foxo1 phosphorylation, amplifying the NO−-dependent POMC effects. In addition, NO− promotes the processing of POMC to αMSH by up-regulating the expression of PC1, PC3, and CPE and directly leads to its secretion and inhibition of feeding.
Discussion
In addition to hormone resistance, humans suffering from metabolic diseases such as type 2 diabetes mellitus and diet-induced obesity often copresent with reduced NO− bioavailability (5, 6, 10). The impact of this deficiency on the expression of feeding neuropeptides or the hormone-mediated responses of neurons in the hypothalamus, which could perpetuate the disease state, remains unknown. Here, the impact of the NO− donor, SNP on basal POMC transcriptional expression was reported in mice hypothalamus ex vivo and in a variety of hypothalamic cell models, in vitro. SNP dramatically enhanced both basal and insulin driven POMC expression by modulating SIRT1 expression and activity in mHypoA-POMC/GFP-2 cells. Although SIRT1 protein levels remained unchanged with an acute SNP treatment, the overall deacetylase activity was dramatically impeded. Reduced deacetylase activity of SIRT1 enhanced acetylation and phosphorylation of Foxo1, reduced association of Foxo1 at the POMC promoter, and significantly alleviated the Foxo1-dependent transcriptional repression of POMC. Interestingly, after an initial decrease in Foxo1 binding at 1 hour to the POMC promoter, corresponding to the increase in POMC transcript expression and stability for at least 8 hours, there was an increase in Foxo1 binding to the POMC promoter at 4 hours. This likely occurs to counterbalance the increase in POMC, in order to restore homeostasis of POMC transcription and αMSH synthesis. Further, prolonged treatment with SNP up-regulated key αMSH processing enzymes, PC1/3 and CPE, enhanced αMSH protein production and prevented the onset of insulin resistance.
Although Foxo1 inhibition may underlie the SNP-dependent increase in POMC mRNA levels ex vivo and in vitro, the ability of NO− donors to directly manipulate mRNA stability may further emphasize this observation. For instance, NO− can activate and recruit mRNA stabilizing machinery to transcripts containing cytosine-uracil-rich elements (CUREs) within their 3′-untranslated region (UTR) (37, 45). The mouse and human POMC transcripts contain 3 putative CUREs within their 3′-UTR and may be actively stabilized by NO− donors to further promote the anorexigenic state. Intriguingly, a single nucleotide polymorphism 8246C/T (rs1042571) within one of these putative CUREs is widely reported in the literature to correlate with enhanced body mass indexes in a variety of populations (55–58). On the other hand, the 3′-UTR of the SIRT1 transcript contains 6 potential mRNA destabilizing motifs or adenine-rich elements that initiate mRNA degradation in the presence of SNP and may account for the concentration and time dependent loss of SIRT1 mRNA (data not shown) (35, 46). The decline in SIRT1 mRNA initially may explain the loss of SIRT1 protein upon chronic exposure to SNP described in mHypoA-POMC/GFP-2 cells. In this case, NO− donors may not only support POMC expression by enhancing its transcription and mRNA stability but also through the inhibition of its major repressor, SIRT1.
Administration of SNP and the subsequent rise in the cellular NO− concentration is known to introduce posttranslational modifications into proteins, particularly on cysteines, serines, and tyrosines, which are susceptible to S-nitrosylation or nitration (59–61). Although yet to be shown biochemically, it is likely that SIRT1 residues are susceptible to NO− donors as acute SNP exposure impedes its deacetylase activity and mediates an accumulation in acetylated Foxo1 in mHypoA-POMC/GFP-2 cells. Foxo1 is a known substrate of SIRT1 and in the case of hypothalamic neurons, a major inhibitor of POMC expression. Reduced SIRT1 activity and a concurrent increase in acetylated-Foxo1 levels, enhances basal phosphorylation of this Foxo1 population in response to NO− and further relieves the transcriptional repression Foxo1 exhibits on the POMC gene. The presence of insulin maximizes Foxo1 phosphorylation leading to a further enhancement in POMC mRNA levels than seen with SNP alone. In essence, NO− donors or a rise in endogenous levels of this ion may prime the POMC neuron for the most robust POMC expression and presumably, the strongest anorexigenic response. Alternatively, in the insulin resistant state, SNP could enhance basal POMC expression alone.
Despite the reduction of insulin receptor expression when mHypoA-POMC/GFP-2 cells were chronically incubated with insulin in the presence of SNP, insulin signaling remained intact. This finding was surprising and suggests that SNP may enhance signal transduction through surviving receptors possibly by enhancing the intrinsic kinase activity, increasing trafficking to the plasma membrane, reducing the activity of signaling antagonists, or enabling signaling through alternative receptors (62). For instance, the kinase activity or life span of the activated and phosphorylated state of the insulin receptor is dependent upon the activity of corresponding phosphatases such as protein-tyrosine phosphatase 1B (63). Interestingly, the activity of protein-tyrosine phosphatase 1B is highly sensitive to the presence of NO−, becoming S-nitrosylated and functionally inhibited even with a short-term dosage (64, 65). Conversely, insulin may signal through alternative receptors of which the IGF receptor (IGF-R) is an ideal candidate. IGF-R and the insulin receptor are highly homologous can form hybrid receptor complexes, transduce through the same signaling pathways, and compensate for each other in times of deficiency (66–68). Intriguingly, as with the insulin receptor, stimulation of the IGF-R produces NO− and up-regulates POMC expression in the pituitary (69). However, it remains to be seen whether either mechanism underlies the observations in mHypoA-POMC/GFP-2 cell model.
The importance of NO− in insulin sensitivity and energy homeostasis is well documented, and it is now well established that the insulin receptor itself represents an important mediator of NO− production in a variety of peripheral tissues through its downstream activation of endothelial NOS (eNOS) (70). In fact, genetic ablation or pharmacological inhibition of eNOS in mice or polymorphisms in the eNOS gene in humans is associated with insulin resistance and coexisting maladies such as hypertension and hyperlipidemia (14, 24, 71–73). Further, administration of NO− to insulin resistant mice devoid of functional eNOS is sufficient to restore insulin sensitivity highlighting the essential role of this biomolecule in energy management. The benefit of applying NO− donors or related drugs to the treatment of human metabolic disease, however, has been less clear.
Unlike rodents, simply increasing NO− levels in humans suffering from diabetes mellitus by the administration of rapid NO−-releasing compounds has largely failed to restore normal insulin signaling. The lack of translation from mice to humans is hard to reconcile given the many elusive properties of the NO− ion itself. For instance, the physiological NO− concentration, and thus the benchmark for NO− restoration, remains unknown (74). NO− levels are notoriously difficult to measure given its short life span, aqueous solubility, and diffusible nature for which one can postulate direct NO− donors would be hard apply to targeted therapies (74, 75).
Alternatively, the dietary consumption of L-arginine, the substrate for endogenous NO− generation, which likely allows for a lower and more sustained level of NO− production, has shown some promise in alleviating the diabetic and obese state by multifactoral mechanisms (76–78). These modes of action include a loss of fat, gain of skeletal muscle, improved insulin signaling and nutrient handling, and an overall enhancement in energy utilization (79–82). It is intriguing to think that NO−-releasing compounds could also modulate energy homeostasis by acting directly on the feeding center of the brain by manipulating the expression of neuropeptides in hypothalamic neurons in favor of the anorexogenic state. For instance, as described in this study, NO− significantly enhanced the expression of POMC in hypothalamic neurons, a neuropeptide that strongly reduces appetite and food intake and is essential for energy management. As such, slow-releasing drugs may be used not only for the treatment of diabetes but also of the obese state, which often copresents.
Encouraging findings with L-arginine-rich diets in the alleviation of metabolic diseases has likely provoked the development of slow-release NO− drugs (71, 83). The jury is still out on whether the new NO− drugs are effective at restoring insulin sensitivity or not, but it is intriguing to think that many long prescribed drugs in the treatment of diabetes have been subsequently shown to activate NOSs including metformin and thiazolidinediones (84–87). The advent of nanotechnology and accompanying prodrugs enables tissue-specific delivery and thus has allowed the medical field to revisit the potential use of NO− donors in the treatment of disease including obesity and type 2 diabetes (88). Characterization of the direct impact of NO− on the feeding neurons of the hypothalamus so critical for maintaining energy homeostasis is an essential piece of the puzzle to warrant further examination to the utility of this tactic.
In conclusion, this study provides convincing evidence that restoring or enhancing NO− levels in hypothalamic neurons may initiate a basal and insulin-driven anorexigenic consequence by enhancing POMC neuronal expression at the transcriptional level. Furthermore, maintaining NO− levels in the presence of high insulin prevented the onslaught of insulin resistance. Future work will identify the mechanisms for which SNP maintains insulin signaling through residual receptors to promote an anorexigenic state in hypothalamic POMC neurons.
Acknowledgments
This work was supported by a Banting and Best Diabetes Center fellowship (L.W.), a Canadian Institute for Health Research (CIHR) fellowship (L.W.), Canada Research Chairs Program (CRC) Canada (D.D.B.), and a CIHR operating grant (D.D.B.).
Disclosure Summary: The authors have nothing to disclose.
Funding Statement
This work was supported by a Banting and Best Diabetes Center fellowship (L.W.), a Canadian Institute for Health Research (CIHR) fellowship (L.W.), Canada Research Chairs Program (CRC) Canada (D.D.B.), and a CIHR operating grant (D.D.B.).
Footnotes
- AgRP
- agouti-related peptide
- AKT
- protein kinase B
- ChIP
- chromatin immunoprecipitation
- CNS
- central nervous system
- CPE
- carboxypeptidase E
- CPTIO
- 2-(4-carboxyphenyl)-4,4,5,5-tetramethylimidazoline-1-oxyl-3-oxide
- CURE
- cytosine-uracil-rich element
- DRB
- 5,6-dichlorobenzimidazole 1-β-D-ribofuranoside
- DTT
- dithiothreitol
- EIA
- enzyme immunoassay
- eNOS
- endothelial NOS
- EX527
- 6-chloro-2,3,4,9-tetrahydro-1H-carbazole-1-carboxamide
- Foxo1
- Forkhead Box protein O1
- GC
- guanylate cyclase
- IGF-R
- IGF receptor
- αMSH
- α-melanocortin-secreting hormone
- NO−
- nitric oxide
- NOS
- NO− synthase
- NPY
- neuropeptide Y
- ODQ
- 1H-(1,2,4)oxadiazolo[4,3,-a]quinozalin-1-one
- PC1/3
- prohormone convertase 1/3
- POMC
- proopiomelanocortin
- qRT-PCR
- quantitative real-time PCR
- SDS
- sodium dodecyl sulfate
- SIRT1
- sirtuin 1
- SNP
- sodium nitroprusside
- TBST
- Tris-buffered saline supplemented with 0.1% (vol/vol) Tween 20
- UTR
- untranslated region.
References
- 1. Belgardt BF, Brüning JC. CNS leptin and insulin action in the control of energy homeostasis. Ann NY Acad Sci. 2010;1212:97–113. [DOI] [PubMed] [Google Scholar]
- 2. Thaler JP, Yi CX, Schur EA, et al. . Obesity is associated with hypothalamic injury in rodents and humans. J Clin Invest. 2012;122:153–162. [DOI] [PMC free article] [PubMed] [Google Scholar]
- 3. Kaushik S, Arias E, Kwon H, et al. . Loss of autophagy in hypothalamic POMC neurons impairs lipolysis. EMBO Rep. 2012;13:258–265. [DOI] [PMC free article] [PubMed] [Google Scholar]
- 4. Moraes JC, Coope A, Morari J, et al. . High-fat diet induces apoptosis of hypothalamic neurons. PLoS One. 2009;4:e5045. [DOI] [PMC free article] [PubMed] [Google Scholar]
- 5. Brüning JC, Winnay J, Bonner-Weir S, Taylor SI, Accili D, Kahn CR. Development of a novel polygenic model of NIDDM in mice heterozygous for IR and IRS-1 null alleles. Cell. 1997;88:561–572. [DOI] [PubMed] [Google Scholar]
- 6. Frederich RC, Hamann A, Anderson S, Löllmann B, Lowell BB, Flier JS. Leptin levels reflect body lipid content in mice: evidence for diet-induced resistance to leptin action. Nat Med. 1995;1:1311–1314. [DOI] [PubMed] [Google Scholar]
- 7. Cai S, Khoo J, Channon KM. Augmented BH4 by gene transfer restores nitric oxide synthase function in hyperglycemic human endothelial cells. Cardiovasc Res. 2005;65:823–831. [DOI] [PubMed] [Google Scholar]
- 8. Kim F, Pham M, Maloney E, et al. . Vascular inflammation, insulin resistance, and reduced nitric oxide production precede the onset of peripheral insulin resistance. Arterioscler Thromb Vasc Biol. 2008;28:1982–1988. [DOI] [PMC free article] [PubMed] [Google Scholar]
- 9. Higashi Y, Sasaki S, Nakagawa K, Matsuura H, Chayama K, Oshima T. Effect of obesity on endothelium-dependent, nitric oxide-mediated vasodilation in normotensive individuals and patients with essential hypertension. Am J Hypertens. 2001;14:1038–1045. [DOI] [PubMed] [Google Scholar]
- 10. Gruber HJ, Mayer C, Mangge H, Fauler G, Grandits N, Wilders-Truschnig M. Obesity reduces the bioavailability of nitric oxide in juveniles. Int J Obes. 2008;32:826–831. [DOI] [PubMed] [Google Scholar]
- 11. Bender SB, Herrick EK, Lott ND, Klabunde RE. Diet-induced obesity and diabetes reduce coronary responses to nitric oxide due to reduced bioavailability in isolated mouse hearts. Diabetes Obes Metab. 2007;9:688–696. [DOI] [PubMed] [Google Scholar]
- 12. Cleeter MW, Cooper JM, Darley-Usmar VM, Moncada S, Schapira AH. Reversible inhibition of cytochrome c oxidase, the terminal enzyme of the mitochondrial respiratory chain, by nitric oxide. Implications for neurodegenerative diseases. FEBS Lett. 1994;345:50–54. [DOI] [PubMed] [Google Scholar]
- 13. Radi R, Rodriguez M, Castro L, Telleri R. Inhibition of mitochondrial electron transport by peroxynitrite. Arch Biochem Biophys. 1994;308:89–95. [DOI] [PubMed] [Google Scholar]
- 14. Shankar RR, Wu Y, Shen HQ, Zhu JS, Baron AD. Mice with gene disruption of both endothelial and neuronal nitric oxide synthase exhibit insulin resistance. Diabetes. 2000;49:684–687. [DOI] [PubMed] [Google Scholar]
- 15. Higaki Y, Hirshman MF, Fujii N, Goodyear LJ. Nitric oxide increases glucose uptake through a mechanism that is distinct from the insulin and contraction pathways in rat skeletal muscle. Diabetes. 2001;50:241–247. [DOI] [PubMed] [Google Scholar]
- 16. Ross RM, Wadley GD, Clark MG, Rattigan S, McConell GK. Local nitric oxide synthase inhibition reduces skeletal muscle glucose uptake but not capillary blood flow during in situ muscle contraction in rats. Diabetes. 2007;56:2885–2892. [DOI] [PubMed] [Google Scholar]
- 17. Bergandi L, Silvagno F, Russo I, et al. . Insulin stimulates glucose transport via nitric oxide/cyclic GMP pathway in human vascular smooth muscle cells. Arterioscler Thromb Vasc Biol. 2003;23:2215–2221. [DOI] [PubMed] [Google Scholar]
- 18. Wang H, Wang AX, Aylor K, Barrett EJ. Nitric oxide directly promotes vascular endothelial insulin transport. Diabetes. 2013;62:4030–4042. [DOI] [PMC free article] [PubMed] [Google Scholar]
- 19. Morley JE, Farr SA, Sell RL, Hileman SM, Banks WA. Nitric oxide is a central component in neuropeptide regulation of appetite. Peptides. 2011;32:776–780. [DOI] [PubMed] [Google Scholar]
- 20. Riediger T, Cordani C, Potes CS, Lutz TA. Involvement of nitric oxide in lipopolysaccharide induced anorexia. Pharmacol Biochem Behav. 2010;97:112–120. [DOI] [PubMed] [Google Scholar]
- 21. Perreault M, Marette A. Targeted disruption of inducible nitric oxide synthase protects against obesity-linked insulin resistance in muscle. Nat Med. 2001;7:1138–1143. [DOI] [PubMed] [Google Scholar]
- 22. Borner T, Pinkernell S, Lutz TA, Riediger T. Lipopolysaccharide inhibits ghrelin-excited neurons of the arcuate nucleus and reduces food intake via central nitric oxide signaling. Brain Behav Immun. 2012;26:867–879. [DOI] [PubMed] [Google Scholar]
- 23. Han C, Zhao Q, Lu B. The role of nitric oxide signaling in food intake; insights from the inner mitochondrial membrane peptidase 2 mutant mice. Redox Biol. 2013;1:498–507. [DOI] [PMC free article] [PubMed] [Google Scholar]
- 24. Duplain H, Burcelin R, Sartori C, et al. . Insulin resistance, hyperlipidemia, and hypertension in mice lacking endothelial nitric oxide synthase. Circulation. 2001;104:342–345. [DOI] [PubMed] [Google Scholar]
- 25. Obukuro K, Nobunaga M, Takigawa M, et al. . Nitric oxide mediates selective degeneration of hypothalamic orexin neurons through dysfunction of protein disulfide isomerase. J Neurosci. 2013;33:12557–12568. [DOI] [PMC free article] [PubMed] [Google Scholar]
- 26. Keilhoff G, Seidel B, Reiser M, et al. . Lack of neuronal NOS has consequences for the expression of POMC and POMC-derived peptides in the mouse pituitary. Acta Histochem. 2001;103:397–412. [DOI] [PubMed] [Google Scholar]
- 27. Orita K, Hiramoto K, Kobayashi H, Ishii M, Sekiyama A, Inoue M. Inducible nitric oxide synthase (iNOS) and α-melanocyte-stimulating hormones of iNOS origin play important roles in the allergic reactions of atopic dermatitis in mice. Exp Dermatol. 2011;20:911–914. [DOI] [PubMed] [Google Scholar]
- 28. Nazarians-Armavil A, Chalmers JA, Lee CB, Ye W, Belsham DD. Cellular insulin resistance disrupts hypothalamic mHypoA-POMC/GFP neuronal signaling pathways. J Endocrinol. 2014;220:13–24. [DOI] [PubMed] [Google Scholar]
- 29. Dhillon SS, McFadden SA, Chalmers JA, Centeno ML, Kim GL, Belsham DD. Cellular leptin resistance impairs the leptin-mediated suppression of neuropeptide Y secretion in hypothalamic neurons. Endocrinology. 2011;152:4138–4147. [DOI] [PubMed] [Google Scholar]
- 30. Mellon PL, Windle JJ, Goldsmith PC, Padula CA, Roberts JL, Weiner RI. Immortalization of hypothalamic GnRH neurons by genetically targeted tumorigenesis. Neuron. 1990;5:1–10. [DOI] [PubMed] [Google Scholar]
- 31. Chomczynski P, Sacchi N. Single-step method of RNA isolation by acid guanidinium thiocyanate-phenol-chloroform extraction. Anal Biochem. 1987;162:156–159. [DOI] [PubMed] [Google Scholar]
- 32. Belsham DD, Cai F, Cui H, Smukler SR, Salapatek AM, Shkreta L. Generation of a phenotypic array of hypothalamic neuronal cell models to study complex neuroendocrine disorders. Endocrinology. 2004;145:393–400. [DOI] [PubMed] [Google Scholar]
- 33. Wellhauser L, Belsham DD. Activation of the omega-3 fatty acid receptor GPR120 mediates anti-inflammatory actions in immortalized hypothalamic neurons. J Neuroinflammation. 2014;11:60. [DOI] [PMC free article] [PubMed] [Google Scholar]
- 34. Kitamura T, Feng Y, Kitamura YI, et al. . Forkhead protein FoxO1 mediates Agrp-dependent effects of leptin on food intake. Nat Med. 2006;12:534–540. [DOI] [PubMed] [Google Scholar]
- 35. Bakheet T, Williams BR, Khabar KS. ARED 2.0: an update of AU-rich element mRNA database. Nucleic Acids Res. 2003;31:421–423. [DOI] [PMC free article] [PubMed] [Google Scholar]
- 36. Xu N, Chen CY, Shyu AB. Modulation of the fate of cytoplasmic mRNA by AU-rich elements: key sequence features controlling mRNA deadenylation and decay. Mol Cell Biol. 1997;17:4611–4621. [DOI] [PMC free article] [PubMed] [Google Scholar]
- 37. Wang S, Zhang J, Theel S, Barb JJ, Munson PJ, Danner RL. Nitric oxide activation of Erk1/2 regulates the stability and translation of mRNA transcripts containing CU-rich elements. Nucleic Acids Res. 2006;34:3044–3056. [DOI] [PMC free article] [PubMed] [Google Scholar]
- 38. Ohkuma S, Narihara H, Katsura M, Hasegawa T, Kuriyama K. Nitric oxide-induced [3H] GABA release from cerebral cortical neurons is mediated by peroxynitrite. J Neurochem. 1995;65:1109–1114. [DOI] [PubMed] [Google Scholar]
- 39. Ohkuma S, Katsura M. Nitric oxide and peroxynitrite as factors to stimulate neurotransmitter release in the CNS. Prog Neurobiol. 2001;64:97–108. [DOI] [PubMed] [Google Scholar]
- 40. Mahachoklertwattana P, Black SM, Kaplan SL, Bristow JD, Grumbach MM. Nitric oxide synthesized by gonadotropin-releasing hormone neurons is a mediator of N-methyl-D-aspartate (NMDA)-induced GnRH secretion. Endocrinology. 1994;135:1709–1712. [DOI] [PubMed] [Google Scholar]
- 41. Aleryani S, Milo E, Kostka P. Formation of peroxynitrite during thiol-mediated reduction of sodium nitroprusside. Biochim Biophys Acta. 1999;1472:181–190. [DOI] [PubMed] [Google Scholar]
- 42. Planchet E, Kaiser WM. Nitric oxide (NO) detection by DAF fluorescence and chemiluminescence: a comparison using abiotic and biotic NO sources. J Exp Bot. 2006;57:3043–3055. [DOI] [PubMed] [Google Scholar]
- 43. Tabuchi A, Sano K, Oh E, Tsuchiya T, Tsuda M. Modulation of AP-1 activity by nitric oxide (NO) in vitro: NO-mediated modulation of AP-1. FEBS Lett. 1994;351:123–127. [DOI] [PubMed] [Google Scholar]
- 44. Cyr NE, Steger JS, Toorie AM, Yang JZ, Stuart R, Nillni EA. Central Sirt1 regulates body weight and energy expenditure along with the POMC-derived peptide α-MSH and the processing enzyme CPE production in diet-induced obese male rats. Endocrinology. 2015;156:961–974. [DOI] [PMC free article] [PubMed] [Google Scholar]
- 45. Chen LC, Liu HP, Li HP, et al. . Thymidine phosphorylase mRNA stability and protein levels are increased through ERK-mediated cytoplasmic accumulation of hnRNP K in nasopharyngeal carcinoma cells. Oncogene. 2009;28:1904–1915. [DOI] [PubMed] [Google Scholar]
- 46. Wang S, Zhang J, Zhang Y, Kern S, Danner RL. Nitric oxide-p38 MAPK signaling stabilizes mRNA through AU-rich element-dependent and -independent mechanisms. J Leukoc Biol. 2008;83:982–990. [DOI] [PubMed] [Google Scholar]
- 47. Kornberg MD, Sen N, Hara MR, et al. . GAPDH mediates nitrosylation of nuclear proteins. Nat Cell Biol. 2010;12:1094–1100. [DOI] [PMC free article] [PubMed] [Google Scholar]
- 48. Cakir I, Perello M, Lansari O, Messier NJ, Vaslet CA, Nillni EA. Hypothalamic Sirt1 regulates food intake in a rodent model system. PLoS One. 2009;4:e8322. [DOI] [PMC free article] [PubMed] [Google Scholar]
- 49. Matsuzaki H, Daitoku H, Hatta M, Aoyama H, Yoshimochi K, Fukamizu A. Acetylation of Foxo1 alters its DNA-binding ability and sensitivity to phosphorylation. Proc Natl Acad Sci USA. 2005;102:11278–11283. [DOI] [PMC free article] [PubMed] [Google Scholar]
- 50. Kim MS, Pak YK, Jang PG, et al. . Role of hypothalamic Foxo1 in the regulation of food intake and energy homeostasis. Nat Neurosci. 2006;9:901–906. [DOI] [PubMed] [Google Scholar]
- 51. Matsuzaki H, Daitoku H, Hatta M, Tanaka K, Fukamizu A. Insulin-induced phosphorylation of FKHR (Foxo1) targets to proteasomal degradation. Proc Natl Acad Sci USA. 2003;100:11285–11290. [DOI] [PMC free article] [PubMed] [Google Scholar]
- 52. Mayer CM, Belsham DD. Central insulin signaling is attenuated by long-term insulin exposure via insulin receptor substrate-1 serine phosphorylation, proteasomal degradation, and lysosomal insulin receptor degradation. Endocrinology. 2010;151:75–84. [DOI] [PubMed] [Google Scholar]
- 53. Koopmans SJ, Ohman L, Haywood JR, Mandarino LJ, DeFronzo RA. Seven days of euglycemic hyperinsulinemia induces insulin resistance for glucose metabolism but not hypertension, elevated catecholamine levels, or increased sodium retention in conscious normal rats. Diabetes. 1997;46:1572–1578. [DOI] [PubMed] [Google Scholar]
- 54. Gavin JR 3rd, Roth J, Neville DM Jr, de Meyts P, Buell DN. Insulin-dependent regulation of insulin receptor concentrations: a direct demonstration in cell culture. Proc Natl Acad Sci USA. 1974;71:84–88. [DOI] [PMC free article] [PubMed] [Google Scholar]
- 55. Srivastava A, Mittal B, Prakash J, Narain VS, Natu SM, Srivastava N. Evaluation of MC4R [rs17782313, rs17700633], AGRP [rs3412352] and POMC [rs1042571] polymorphisms with obesity in Northern India. Oman Med J. 2014;29:114–118. [DOI] [PMC free article] [PubMed] [Google Scholar]
- 56. Ternouth A, Brandys MK, van der Schouw YT, et al. . Association study of POMC variants with body composition measures and nutrient choice. Eu J Pharmacol. 2011;660:220–225. [DOI] [PubMed] [Google Scholar]
- 57. Wang F, Gelernter J, Kranzler HR, Zhang H. Identification of POMC exonic variants associated with substance dependence and body mass index. PLoS One. 2012;7:e45300. [DOI] [PMC free article] [PubMed] [Google Scholar]
- 58. Baker M, Gaukrodger N, Mayosi BM, et al. . Association between common polymorphisms of the proopiomelanocortin gene and body fat distribution: a family study. Diabetes. 2005;54:2492–2496. [DOI] [PubMed] [Google Scholar]
- 59. Stamler JS, Toone EJ, Lipton SA, Sucher NJ. (S)NO signals: translocation, regulation, and a consensus motif. Neuron. 1997;18:691–696. [DOI] [PubMed] [Google Scholar]
- 60. Stamler JS, Simon DI, Osborne JA, et al. . S-nitrosylation of proteins with nitric oxide: synthesis and characterization of biologically active compounds. Proc Natl Acad Sci USA. 1992;89:444–448. [DOI] [PMC free article] [PubMed] [Google Scholar]
- 61. Lane P, Gross SS. Cell signaling by nitric oxide. Semin Nephrol. 1999;19:215–229. [PubMed] [Google Scholar]
- 62. Hsu CY, Shih HY, Chia YC, et al. . Rutin potentiates insulin receptor kinase to enhance insulin-dependent glucose transporter 4 translocation. Mol Nutr Food Res. 2014;58:1168–1176. [DOI] [PubMed] [Google Scholar]
- 63. Meng TC, Buckley DA, Galic S, Tiganis T, Tonks NK. Regulation of insulin signaling through reversible oxidation of the protein-tyrosine phosphatases TC45 and PTP1B. J Biol Chem. 2004;279:37716–37725. [DOI] [PubMed] [Google Scholar]
- 64. Hsu MF, Meng TC. Enhancement of insulin responsiveness by nitric oxide-mediated inactivation of protein-tyrosine phosphatases. J Biol Chem. 2010;285:7919–7928. [DOI] [PMC free article] [PubMed] [Google Scholar]
- 65. Chen YY, Chu HM, Pan KT, et al. . Cysteine S-nitrosylation protects protein-tyrosine phosphatase 1B against oxidation-induced permanent inactivation. J Biol Chem. 2008;283:35265–35272. [DOI] [PMC free article] [PubMed] [Google Scholar]
- 66. Soos MA, Siddle K. Immunological relationships between receptors for insulin and insulin-like growth factor I. Evidence for structural heterogeneity of insulin-like growth factor I receptors involving hybrids with insulin receptors. Biochem J. 1989;263:553–563. [DOI] [PMC free article] [PubMed] [Google Scholar]
- 67. Moxham CP, Duronio V, Jacobs S. Insulin-like growth factor I receptor β-subunit heterogeneity. Evidence for hybrid tetramers composed of insulin-like growth factor I and insulin receptor heterodimers. J Biol Chem. 1989;264:13238–13244. [PubMed] [Google Scholar]
- 68. Boucher J, Tseng YH, Kahn CR. Insulin and insulin-like growth factor-1 receptors act as ligand-specific amplitude modulators of a common pathway regulating gene transcription. J Biol Chem. 2010;285:17235–17245. [DOI] [PMC free article] [PubMed] [Google Scholar]
- 69. Honda J, Manabe Y, Matsumura R, Takeuchi S, Takahashi S. IGF-I regulates pro-opiomelanocortin and GH gene expression in the mouse pituitary gland. J Endocrinol. 2003;178:71–82. [DOI] [PubMed] [Google Scholar]
- 70. Zeng G, Nystrom FH, Ravichandran LV, et al. . Roles for insulin receptor, PI3-kinase, and Akt in insulin-signaling pathways related to production of nitric oxide in human vascular endothelial cells. Circulation. 2000;101:1539–1545. [DOI] [PubMed] [Google Scholar]
- 71. Cook S, Scherrer U. Insulin resistance, a new target for nitric oxide-delivery drugs. Fundam Clin Pharmacol. 2002;16:441–453. [DOI] [PubMed] [Google Scholar]
- 72. Shoji M, Tsutaya S, Saito R, Takamatu H, Yasujima M. Positive association of endothelial nitric oxide synthase gene polymorphism with hypertension in northern Japan. Life Sci. 2000;66:2557–2562. [DOI] [PubMed] [Google Scholar]
- 73. Miyamoto Y, Saito Y, Kajiyama N, et al. . Endothelial nitric oxide synthase gene is positively associated with essential hypertension. Hypertension. 1998;32:3–8. [DOI] [PubMed] [Google Scholar]
- 74. Hall CN, Garthwaite J. What is the real physiological NO concentration in vivo? Nitric Oxide. 2009;21:92–103. [DOI] [PMC free article] [PubMed] [Google Scholar]
- 75. Thomas DD, Liu X, Kantrow SP, Lancaster JR Jr. The biological lifetime of nitric oxide: implications for the perivascular dynamics of NO and O2. Proc Natl Acad Sci USA. 2001;98:355–360. [DOI] [PMC free article] [PubMed] [Google Scholar]
- 76. Lucotti P, Setola E, Monti LD, et al. . Beneficial effects of a long-term oral L-arginine treatment added to a hypocaloric diet and exercise training program in obese, insulin-resistant type 2 diabetic patients. Am J Physiol Endocrinol Metab. 2006;291:E906–E912. [DOI] [PubMed] [Google Scholar]
- 77. Alizadeh M, Safaeiyan A, Ostadrahimi A, et al. . Effect of L-arginine and selenium added to a hypocaloric diet enriched with legumes on cardiovascular disease risk factors in women with central obesity: a randomized, double-blind, placebo-controlled trial. Ann Nutr Metab. 2012;60:157–168. [DOI] [PubMed] [Google Scholar]
- 78. Bogdanski P, Suliburska J, Grabanska K, et al. . Effect of 3-month L-arginine supplementation on insulin resistance and tumor necrosis factor activity in patients with visceral obesity. Eur Rev Med Pharmacol Sci. 2012;16:816–823. [PubMed] [Google Scholar]
- 79. Fu WJ, Haynes TE, Kohli R, et al. . Dietary L-arginine supplementation reduces fat mass in Zucker diabetic fatty rats. J Nutr. 2005;135:714–721. [DOI] [PubMed] [Google Scholar]
- 80. Jobgen W, Meininger CJ, Jobgen SC, et al. . Dietary L-arginine supplementation reduces white fat gain and enhances skeletal muscle and brown fat masses in diet-induced obese rats. J Nutr. 2009;139:230–237. [DOI] [PMC free article] [PubMed] [Google Scholar]
- 81. McKnight JR, Satterfield MC, Jobgen WS, et al. . Beneficial effects of L-arginine on reducing obesity: potential mechanisms and important implications for human health. Amino Acids. 2010;39:349–357. [DOI] [PubMed] [Google Scholar]
- 82. Sansbury BE, Hill BG. Regulation of obesity and insulin resistance by nitric oxide. Free Radic Biol Med. 2014;73:383–399. [DOI] [PMC free article] [PubMed] [Google Scholar]
- 83. Piatti PM, Monti LD, Valsecchi G, et al. . Long-term oral L-arginine administration improves peripheral and hepatic insulin sensitivity in type 2 diabetic patients. Diabetes Care. 2001;24:875–880. [DOI] [PubMed] [Google Scholar]
- 84. Li M, Pascual G, Glass CK. Peroxisome proliferator-activated receptor γ-dependent repression of the inducible nitric oxide synthase gene. Mol Cell Biol. 2000;20:4699–4707. [DOI] [PMC free article] [PubMed] [Google Scholar]
- 85. Davis BJ, Xie Z, Viollet B, Zou MH. Activation of the AMP-activated kinase by antidiabetes drug metformin stimulates nitric oxide synthesis in vivo by promoting the association of heat shock protein 90 and endothelial nitric oxide synthase. Diabetes. 2006;55:496–505. [DOI] [PubMed] [Google Scholar]
- 86. Goya K, Sumitani S, Otsuki M, et al. . The thiazolidinedione drug troglitazone up-regulates nitric oxide synthase expression in vascular endothelial cells. J Diabetes Complications. 2006;20:336–342. [DOI] [PubMed] [Google Scholar]
- 87. Cho DH, Choi YJ, Jo SA, Jo I. Nitric oxide production and regulation of endothelial nitric-oxide synthase phosphorylation by prolonged treatment with troglitazone: evidence for involvement of peroxisome proliferator-activated receptor (PPAR) γ-dependent and PPARγ-independent signaling pathways. J Biol Chem. 2004;279:2499–2506. [DOI] [PubMed] [Google Scholar]
- 88. Saraiva J, Marotta-Oliveira SS, Cicillini SA, Eloy Jde O, Marchetti JM. Nanocarriers for nitric oxide delivery. J Drug Deliv. 2011;2011:936438. [DOI] [PMC free article] [PubMed] [Google Scholar]