

Abstract
The transcriptional network of the androgen receptor (AR), a key molecule of prostate cancer, is frequently modulated by interactions with other transcriptional factors such as forkhead box protein A1 (FOXA1). However, global regulatory mechanisms of AR signaling mediated by such factors have not been well investigated. Here we conducted a chromatin immunoprecipitation sequence analysis, which revealed that another FOX family, FOXP1, is specifically regulated by both AR and FOXA1. We also found that FOXP1 acts as a tumor suppressor in prostate cancer through inhibiting cell proliferation and migration. We generated an extensive global map of FOXP1 binding sites and found that FOXP1 is directly involved in AR-mediated transcription. We demonstrated that FOXP1 has a repressive effect on AR-induced transcriptional activity or histone modification in enhancer regions. Moreover, by a global analysis of androgen-mediated transcriptional networks, we observed enrichment of FOXP1 binding genes in the gene cluster negatively regulated by FOXP1. Evaluation of FOXP1 expression in clinical samples indicated that the decreased expression of FOXP1 is another prognostic factor of prostate cancer. Taken together, our results suggest a novel mechanism in which AR-induced FOXP1 functions as a direct modulator of the AR and FOXA1 centric global transcriptional network.
Prostate cancer, the most common cancer in men, is dependent on the actions of androgen receptor (AR) for its development and subsequent progression to castration-resistant prostate cancer (CRPC) (1–3). Upon androgen treatment, AR translocates to the nucleus and binds to specific genome sequences called androgen-responsive elements (AREs). By recruiting multiple coregulators with histone-modifying enzymes, AR modulates the epigenetic condition for transcriptional activation and functions as a ligand-dependent transcription factor (4). Recently genome-wide analyses of AR-binding genomic sequences have revealed that forkhead box protein (FOX) family-binding sequences are enriched around AREs. One of the FOX protein members in particular, FOXA1, is the major transcription factor occupying AR-binding regions. FOXA1 functions as a pioneer factor in contributing to changes in chromatin accessibility by inducing histone modifications for activated patterns such as histone H3 lysine 4 methylation (H3K4me; H3K4me2) and recruiting AR (5–7). FOXA1 overexpression is associated with increased migration and the production of larger tumors in xenograft models (8).
In addition to FOXA1, several reports have identified other AR-interacting partners. By analyzing AR-binding site (ARBS) sequences, octamer transcription factor-1, GATA2 (5), ETS-related gene, and Nkx3.1 (9, 10), were found to interact with AR ligand dependently in prostate cancer cells. Knockdown of these factors decreased AR recruitment to ARBSs. Nkx3.1 is one of the representative androgen-regulated genes and has an AR-binding enhancer sequence in the 3′-downstream region (9, 11). A recent report (9) demonstrated that Nkx3.1 binding regions identified by chromatin immunoprecipitation sequence (ChIP-seq) overlapped with ARBSs and positively regulated AR recruitment. We have also reported that phosphorylated mothers against decapentaplegic-3 and p53, which are repressed by androgen on androgen-responsive noncoding RNA, interact with AR for negative regulation (12). In addition, another research group identified that p53-binding regions overlap with ARBSs (13). Therefore, AR appears to generate its ability for transcriptional activation by forming protein complexes at the ARBSs. Taken together, these results suggest that analyzing the AR transcriptional complex would facilitate an understanding of the mechanism of the AR-driven transcriptional program and its relationship to prostate cancer progression.
Interestingly, although the FOXA1 knockdown diminished AR-binding activity compared with the control, some AR-binding to other targets was still observed, suggesting another role for FOXA1 as a brake for recruiting AR to specific regions (6). Gene expression profiles showed that the FOXA1 knockdown down-regulated AR-induced gene expression (7). To investigate the function of the transcription factors, it is important to obtain accurate results using a global analysis. Despite the multiple reports that have analyzed the genome-wide distribution of FOXA1-binding and its influence on AR signaling (14, 15), studies of other AR-interacting transcription factors are limited.
Our previous study demonstrated that other FOX family members are widely regulated by androgen in addition to FOXA1, suggesting the general significance of FOX family genes in AR action (16). This report has also suggested the importance of FOXP1 in androgen signaling as a negative regulator of AR in prostate-specific antigen (PSA) promoter/enhancer activity by associating with AR ligand dependently. Here we further investigated the global function of FOXP1 on the AR-mediated transcriptional network. Our ChIP-seq analysis of AR and FOXA1 revealed multiple colocalizations around the FOXP1 locus. We also showed that gene expression is dependent on the cooperative function of these transcription factors in both ligand-independent and ligand-dependent manners. Furthermore, our in-depth analysis of FOXP1 signaling in prostate cancer cells demonstrated that FOXP1 is directly recruited to ARBSs in a ligand-dependent manner to modulate the enhancer activity of AR and FOXA1. Although FOXP1-binding is not indispensable for AR-binding activity, androgen-dependent FOXP1 interactions with AR have a negative effect on the transcriptional activation. Consistent with the results of the cell-based experiments, the results of our clinical study showed that the decreased expression of FOXP1 could be a prognostic factor for the survival rate of prostate cancer patients, suggesting a tumor-suppressive function of FOXP1 in these cancer tissues. Thus, the analysis of genome-wide action of AR-interacting partners highlighted novel aspects of the regulatory mechanism of AR in the progression of prostate cancer.
Materials and Methods
Chromatin immunoprecipitation (ChIP), Re-ChIP, quantitative RT-PCR, and ChIP-seq
ChIP, Re-ChIP, and quantitative PCR were performed as previously described (11, 12). The fold enrichment relative to the IgG-immunoprecipitation control or input was quantified by real-time PCR using SYBR Green PCR master mix and the ABI StepOne system (Life Technologies). The primer sequences for the detection of ARBSs by quantitative PCR are listed in Supplemental Table 1 or described in previous studies (11, 12). ChIP-seq was performed as described previously (12). In brief, we used an Illumina genome analyzer or a Hiseq 2000 (Illumina) for sequencing, and libraries were prepared according to the manufacturer's instructions. These sequence results have been deposited in National Center for Biotechnology Information's Gene Expression Omnibus (GSE58428 and GSE62492). Unfiltered 36-bp sequence reads were aligned against the human reference genome (hg18) using CASAVA version 1.7 (Illumina). Signal scores of AR, histone H3 lysine 4 monomethylation (K4me1), and FOXP1 (see Figure 3) were calculated using an in-house program (12). Shortly afterward, the mapped tag counts for ChIP and that for the input (control) were used and the ratio of ChIP count/maximum (control count, estimate count) was calculated for every 1000-bp window. An integrative genome browser (Affymetrix) was used for visualization.
Figure 3. Global analysis of FOXP1-binding sites in AR-positive prostate cancer cells.

A, FOXP1 binding was mapped in LNCaP cells using ChIP-seq. A Venn diagram shows the overlap between vehicle and DHT treatments of FOXP1 binding sites (fold > 4). B, Motif analysis of FOXP1 binding sites reveals Forkhead, ARE, and Forkhead-AR motifs. Ratios of FOXP1 binding sites within each motif are shown. C, FOXP1 binding regions overlap with AR binding sites in an androgen-dependent manner. The Venn diagram shows the overlap between the AR binding sites and FOXP1 binding sites. D, Heat map of raw AR, FOXP1, and K4me1 reads for ChIP-seq in LNCaP cells. Results at three different FOXP1 and AR binding regions (common FOXP1 and AR, AR only, and FOXP1 only regions) are shown. E, Average binding intensity plot for the FOXP1 ChIP-seq signal at all FOXP1-binding sites and ARBSs.
Immunohistochemistry
Formalin-fixed tissues were embedded in paraffin and sectioned. A Histofine kit (Nichirei), which uses the streptavidin-biotin amplification method, was used, and the antigen-antibody complex was visualized with 3,3′-diaminobenzidine solution (1 mM 3,3′-diaminobenzidine, 50 mM Tris-HCl buffer [pH 7.6], and 0.006% H2O2). In an immunohistochemical analysis, the immunoreactivity was evaluated in more than 1000 carcinoma cells for each case. Subsequently the percentage of immunoreactivity (labeling index [LI]) was determined by a trained pathologist (12).
Luciferase assay
LNCaP cells were incubated with phenol red-free medium supplemented with 5% dextran charcoal-stripped fetal bovine serum (FBS) for 24 hours before transfection. Cells were transfected with pGL3 vectors including ARBSs and tk-pRL by using FuGENE HD reagent (Promega). Twenty-four hours after the transfection, cells were treated with 10 nM dihydrotestosterone (DHT) or vehicle for 24 hours, and luciferase activities were determined as previously described (11, 12).
Cell proliferation assay
Cells were plated at 3 × 10³ cells/well in 96-well plates. For RNA interference experiments, cells were transfected with short interfering RNA (siRNA) 24 hours after cell plating. The 3-(4,5-dimethylthiazol-2-yl)-5-(3-carboxymethoxyphenyl)-2-(4-sulfophenyl)-2H-tetrazolium, inner salt assay was performed using the CellTiter 96 aqueous 3-(4,5-dimethylthiazol-2-yl)-5-(3-carboxymethoxyphenyl)-2-(4-sulfophenyl)-2H-tetrazolium, inner salt reagent (Promega), according to the manufacturer's protocol. The experiment was performed in quintuplicate. For cell counting, cells were trypsinized and counted using the trypan blue exclusion method to quantify cell viability.
Short interfering RNA
For siRNA experiments, we purchased siRNAs targeting FOXA1 (HSS175560), FOXP1 (number 1: HSS178308; number 2: HSS178309), and a negative control siRNA (Life Technologies). Cells were transfected with siRNA using RNA interference Max transfection reagent (Life Technologies) 48–72 hours before each experiment.
Clinical tissue samples
We obtained 103 prostate cancer samples from surgeries performed at the University of Tokyo Hospital (Tokyo, Japan). The Tokyo University Ethics Committee approved this study, and informed consent was obtained from each patient before surgery. The age of the patients ranged from 52 to 78 years (mean 66.8 ± 6.0 y), and pretreatment serum PSA levels ranged from 2.2 to 136 ng/mL (mean, 16.9 ± 19.5 ng/mL). Other clinicopathological parameters are shown in Supplemental Table 2.
Microarray
For expression microarrays, the GeneChip Human Exon 1.0 ST array (Affymetrix) was used according to the manufacturer's protocol. Data analysis was performed using the Affymetrix Microarray Suite software. To compare arrays, normalization was performed on data from all probe sets. The data have been deposited in the National Center for Biotechnology Information's Gene Expression Omnibus and are accessible through Gene Expression Omnibus series accession number GSE58309.
Reverse transcription-polymerase chain reaction
Total RNA was isolated using the ISOGEN reagent. First-strand cDNA was generated using the PrimeScript RT reagent kit (Takara Bio). The primer sequences are listed in Supplemental Table 1 and previous studies (11, 12). The expression levels were quantified by real-time PCR as previously described (11, 12).
Western blot and immunoprecipitation
For immunoprecipitation with the anti-FOXP1 antibody, 1 mg of cell lysate protein was incubated with anti-FOXP1 at 4°C overnight. The mixture of cell extract and antibody was then incubated with protein G-Sepharose beads (Amersham Biosciences) at 4°C for 2 hours and then washed four times with Nonidet P-40 lysis buffer. The immunoprecipitated proteins were boiled for 5 minutes in Laemmli sample buffer and separated by SDS-PAGE. Immunoblotting was performed as described elsewhere (11, 12).
Cell culture
VCaP cells were grown in DMEM supplemented with 10% FBS. DU145 and LNCaP cells were grown in RPMI 1640 medium supplemented with 10% FBS, 50 U/mL penicillin, and 50 μg/mL streptomycin. Human prostate epithelial cells (PrECs) were obtained from Takara Bio and cultured as instructed by the company.
Cell cycle analysis
Cells were transfected with siRNA or expression vectors and harvested after 48 hours of incubation. Cells were centrifuged, washed in PBS, and then fixed by the slow addition of 70% ethanol with mild shaking. Fixed cells were stored at 4°C until use. On the day of cycle analysis, the cells were centrifuged, washed in PBS, resuspended in PBS containing ribonuclease A (Takara Bio) and incubated at 37°C for 30 minutes. To determine the DNA content, cells were analyzed by flow cytometry using a fluorescence-activated cell sorter (FACS) Calibur instrument and CellQuest software (BD Biosciences) after staining with propidium iodide solution (Takara Bio).
Terminal deoxynucleotidyl transferase-mediated deoxyuridine triphosphate nick end labeling (TUNEL) assay
A TUNEL assay was conducted using the DeadEnd Fluometric TUNEL system (Promega) as described previously (17).
Migration assay
Cellular migration assays were performed using matrigel-coated invasion chambers (BD Biosciences) as described previously (17). Briefly, cells were transferred into an insert with an 8-μm pore size in serum-free medium. The medium was placed in the lower well, and cells were cultured for another 24–48 hours. Invading cells were fixed and stained. The number of cells in four random fields was counted.
Statistical analysis
For cell line experiments, statistical differences (P values) among groups were obtained using a two-sided Student's t test. All experiments were performed at least twice and similar results were obtained. Values of P < .05 were considered statistically significant. Statistical procedures were performed using GraphPad Prism 5 software (GraphPad Software) or Microsoft Excel. The association between immunoreactivity and clinicopathological factors was evaluated using the Student's t test, a cross-table with the χ2 test, or the correlation coefficient (r) and regression equation. The cancer-specific survival curves were generated according to the Kaplan-Meier method, and the statistical significance was calculated using the log-rank test.
Results
FOXP1 directly regulated by AR and FOXA1 inhibits prostate cancer cell proliferation
To investigate the transcriptional networks of AR and FOXA1 in prostate cancer, we performed ChIP-sequence in AR-positive prostate cancer cell lines (LNCaP and VCaP cells) using a next-generation sequencer. The number of significant AR-binding regions (P < 10−5) in the whole genome was 13 162 (fold > 7.5) in LNCaP cells and 21 914 (fold > 10) in VCaP cells. Global mapping of both transcription factors revealed their direct target genes. Interestingly, multiple significant binding sites could be identified around another FOX family member, the FOXP1 locus, in both cell lines (Figure 1A and Supplemental Figure 1A). Some of the AR-bindings and histone modifications at the promoter/enhancer regions were confirmed by ChIP analysis in LNCaP cells (Supplemental Figure 1B). By Western blot analysis, we demonstrated that FOXP1 is regulated by androgen (DHT or R1881) treatment (Figure 1B).
Figure 1. FOXP1 is a direct target of AR and FOXA1 to negatively regulate prostate cancer cell proliferation.

A, AR and FOXA1 ChIP-seq results revealed that FOXP1 is a direct target of both factors. AR and FOXA1 ChIP-seq data around FOXP1 locus in two prostate cancer cell lines (LNCaP and VCaP) are shown in the DHT-treated condition. Binding sites were identified using MACS (P < 10−5). B, FOXP1 is induced by androgen treatment. LNCaP cells were treated with vehicle, DHT (10 or 100 nM) and R1881 (1 nM). Western blot analysis of FOXP1 was performed. C, FOXP1 basal expression level and its induction by androgen are dependent on FOXA1. The LNCaP cells were transfected with siControl, siFOXA1, and siFOXP1 number 1 (10 nM). Forty-eight hours after the transfection, cells were treated with vehicle or DHT (10 nM) for 24 hours. FOXP1 expression was measured by real-time RT-PCR. Data represent mean ± SD (n = 3). D, Protein level analysis of FOXP1 expression after the knockdown of FOXA1 and FOXP1. LNCaP cells were transfected with siControl, siFOXA1, and siFOXP1 number 1 (10 nM). Forty-eight hours after the transfection, cells were treated with vehicle or DHT (100 nM) for 24 hours. Western blot analysis of FOXP1 was performed. IB, immunoblot.
To validate the regulation of FOXP1 by FOXA1 and AR, we decreased the AR or FOXA1/FOXP1 expression levels by transfecting siRNA targeting these factors and then performed quantitative RT-PCR analysis. FOXP1 expression increased by approximately 1.5- to 2-fold after treatment with DHT for 24 hours in LNCaP cells. Although a short transcriptional variant of FOXP1 is more strongly induced by androgen as previously reported (16), we observed that androgen-dependent induction of FOXP1 was significantly inhibited by AR knockdown (Supplemental Figure 1C) in both cell lines, indicating the involvement of AR in this regulation. Based on the FOXA1 ChIP-seq result, FOXP1 basal expression and its regulation by androgen were significantly diminished by the inhibition of FOXA1, suggesting androgen-independent and -dependent regulation of FOXP1 in the LNCaP cells (Figure 1C). In addition, a Western blot analysis showed that knockdown of FOXA1 decreased basal FOXP1 protein expression in LNCaP cells (Figure 1D). Thus, these results demonstrated the direct roles of AR and FOXA1 in regulating FOXP1 expression in prostate cancer cells.
Next, we examined the role of FOXP1 in prostate cancer cell proliferation. We analyzed the FOXP1 expression level in several prostate cancer cell lines. Interestingly, FOXP1 protein was not expressed in AR-negative DU145 prostate cancer cells, whereas FOXP1 protein was highly expressed in the AR-positive LNCaP cells, suggesting the involvement of AR in FOXP1 expression (Figure 2A). We analyzed the cell proliferation ability by measuring the cell numbers in LNCaP cells after decreasing FOXP1 and FOXA1 by siRNAs. As reported previously, we observed that FOXA1 knockdown decreased prostate cancer cell proliferation. In contrast, FOXP1 knockdown accelerated androgen-dependent cell proliferation significantly (Figure 2B). We also observed that cell migration was significantly enhanced by FOXP1 knockdown (Figure 2C). We further investigated FOXP1 function by overexpressing FOXP1 in LNCaP and DU145 prostate cancer cells (Figure 2D), which resulted in a significant decrease of cell proliferation. The involvement of FOXA1 and FOXP1 in cell growth of VCaP cells was also confirmed (Figure 2E). Thus, these results suggest the tumor suppressive role of FOXP1 by inhibiting cell proliferation and migration.
Figure 2. FOXP1 regulates prostate cancer cell proliferation and migration.

A, LNCaP cells were transfected with siControl, siFOXA1, or siFOXP1 number 1. Expression levels of FOXP1 and FOXA1 were compared by Western blot analysis. DU145 cell lysates were also used for comparison. IB, immunoblot. B, FOXP1 negatively regulated cell growth in LNCaP cells. LNCaP cells were transfected with siFOXA1 or siFOXP1 number 1. Cell proliferation was measured 3 days after transfection by cell counting. Data represent mean ± SD (n = 3). *, P < .05; **, P < .01. C, FOXP1 negatively regulated cell migration in LNCaP cells. LNCaP cells were transfected with siFOXA1, siFOXP1 number 1, or siFOXP1 number 2. After 48 hours of incubation, cells were seeded in the matrigel-coated upper chamber. The average numbers of invading cells are shown. Data represent mean ± SD (n = 4). **, P < .01. D, left panel, Effect of FOXP1 overexpression in LNCaP cells. Right panel, Effect of FOXP1 overexpression in DU145 cells. FOXP1 expression vector or empty vector was transfected to cells. Cell proliferation was measured 3 days after transfection by cell counting. A Western blot analysis was also performed using an anti-FOXP1 antibody. Data represent mean ± SD. (n = 3). *, P < .05; **, P < .01. Vec, vector; E, FOXP1 also negatively regulated cell growth in another prostate cancer cell line, VCaP. VCaP cells were transfected with siControl, siFOXA1, or siFOXP1 number 1. Cell proliferation was measured 5 days after DHT stimulation by cell counting. The effects of FOXA1 and FOXP1 siRNAs are presented in Supplemental Figures 2C and 4A. Data represent mean ± SD (n = 3). *, P < .05; **, P < .01. F, Cell cycle regulation by FOXA1 in prostate cancer cells. LNCaP cells were treated with siControl or siFOXA1 for 48 hours. Cell cycle analysis was performed using FACS analysis. Percentages of LNCaP cells in the S phase are shown. Data represent mean ± SD (n = 2). G, FOXP1 overexpression induced p53 and cleaved PARP expression in prostate cancer cells. Whole-cell lysates of FOXP1-overexpressing cells and vector controls were immunoblotted by anti-PARP, anti-p53, and anti-ac-p53 antibodies. β-Actin was used as a loading control. H, Detection of apoptosis by FOXP1 overexpressin by FACS. LNCaP cells were transfected with FOXP1 expression vector or control vector. After 48 hours of incubation, a FACS analysis was performed to detect apoptotic cells. The percentage of cells in the S phase is shown. Data represent mean ± SD (n = 2). The arrow indicates the apoptotic cell fraction. I, Detection of apoptosis by FOXP1 overexpressin by a TUNEL assay. The TUNEL assay was performed to analyze the apoptotic cells. No apoptotic cells were found by the FOXA1 knockdown. DAPI, 4′,6′-diamino-2-phenylindole; FITC, fluorescein isothiocyanate.
We further analyzed whether the decreased cell proliferation might be due to cell cycle arrest or apoptosis. We performed a cell cycle analysis using flow cytometry in LNCaP cells. The results indicated that short interfering FOXA1 treatment inhibited cell cycle progression, suggesting the importance of cell cycle regulation for FOXA1 activity (Figure 2F). In addition, we also examined whether apoptosis is induced by FOXA1 knockdown or FOXP1 overexpression in LNCaP cells. A Western blot analysis showed that the FOXP1 overexpression induced cleaved poly(ADP-ribose) polymerase (PARP) and p53 activation (Figure 2G). In addition, flow cytometry analysis indicated that the induction of apoptosis by FOXP1 overexpression and a reduction in the S-phase population of cells, indicating both cell cycle arrest and apoptosis could decrease viable cells as a result of overexpressing FOXP1 (Figure 2H). Moreover, a TUNEL assay was conducted after FOXA1 knockdown or FOXP1 overexpression. We could observe stained cells only in FOXP1 overexpression conditions, suggesting a specific effect by FOXP1 overexpression inducing apoptosis (Figure 2I). Taken together, these results indicated a role of FOXP1 in inducing apoptosis or cell cycle arrest by overexpression.
Genome-wide analysis of FOXP1-binding sites in prostate cancer cells
To investigate the unique function of FOXP1 in AR-dependent prostate cancer cell proliferation, we analyzed global FOXP1-binding sites using ChIP-seq in prostate cancer cells. We confirmed that FOXP1-specific antibody could immunoprecipitated FOXP1 proteins effectively (Supplemental Figure 2A). We performed FOXP1 ChIP analysis and observed ligand-dependent recruitments of FOXP1 to representative ARBSs (Supplemental Figure 2B) in LNCaP cells. By ChIP-seq analysis, significant FOXP1-binding regions were identified (fold change > 4, P < 10−5) in the whole genome. In total, 5840 binding regions were identified as FOXP1-binding sites in vehicle-treated cells, and 6068 binding regions were identified in cells treated with DHT (10 nM) for 24 hours (Figure 3A). Moreover, by analyzing the sequences of the identified FOXP1-binding sites, we found that motifs for FOXP1/FOXA1, AR, and their combinations (FOXP1-FOXP1, FOXP1-AR) were significantly enriched around the FOXP1-binding peaks (Figure 3B), suggesting the validity of the binding sites obtained by FOXP1 ChIP-seq analysis.
Interestingly, we also observed that FOXP1-binding sites overlapped with ARBSs (Figure 3C). In addition, the number of overlapping locations increased after DHT treatment (1146 sites in vehicle treated cells and 2117 sites in DHT treated cells). The binding regions of FOXP1 that overlap with AR are highly modulated by K4me1, which is a high-enhancer marker, suggesting that recruitment of FOXP1 to these high-enhancer regions of ARBSs occurs by androgen treatment (Figure 3D). Moreover, we observed increased ChIP signals at the FOXP1-binding sites around the ARBSs in DHT-treated cells compared with controls (Figure 3E). ChIP-seq analysis also showed a global overlap of ARBSs with FOXP1-binding sites in VCaP cells (Supplemental Figure 2C). Taken together, these results suggested that the FOXP1-binding sites are modulated by androgen and that FOXP1 is directly recruited to the activated ARBSs androgen dependently.
FOXP1 has a negative effect on AR-mediated enhancer activity
We further investigated the function of endogenous FOXP1 in the AR-mediated transcriptional activity at the representative enhancer loci. We could find FOXP1-bindings around the representative AR-regulated genes such as PSA in ChIP-seq data (Figure 4A). In addition, our previous reports have shown the importance of amyloid precursor protein (APP) (18) or transforming acidic coiled-coil-containing protein 2 (19) in the prostate cancer progression and castration-resistant tumor growth. The androgen-dependent FOXP1 recruitments to these enhancer loci could be observed in the ChIP-seq data (Figure 4, B and C). We then validated these androgen-mediated FOXP1 recruitments to ARBSs by a ChIP assay in the LNCaP cells (Figure 4D).
Figure 4. Representative views of FOXP1 and AR recruitments to androgen-regulated genes.

A, The ChIP-seq result of a representative AR-regulated gene, KLK3, is shown. B and C, ChIP-seq results in AR-regulated prostate cancer prognostic factors. Representative ARBSs [APP 3′downstream (C) and transforming acidic coiled-coil-containing protein 2 (TACC2) intron (D), which are highly activated enhancer regions] are shown by a red box and magnified on the right. D, FOXP1 is recruited to ARBSs found by ChIP-seq. The LNCaP cells were treated with vehicle or DHT (10 nM) for 24 hours. A ChIP analysis was performed using an FOXP1-specific antibody or nonspecific IgG. Enrichments were measured by real-time PCR relative to IgG control. Data represent mean ± SD (n = 3).
We then examined the androgen-mediated transcriptional activity of FOXP1 by using two ARBS-containing luciferase vectors (PSA and APP enhancer luciferase vectors in the LNCaP cells (Figure 5A). Surprisingly, we observed that androgen-mediated up-regulation of luciferase activity was significantly enhanced by the knockdown of FOXP1. In addition, the repression of FOXP1 significantly induced an activated histone modification pattern (H3K4me2) at two ARBSs in the presence of DHT as determined by a ChIP assay in the LNCaP cells (Figure 5B). Taken together, these data indicate that FOXP1 is recruited to the AR-occupied high-enhancer regions to repress the androgen-mediated up-regulation of enhancer ability.
Figure 5. Endogenous FOXP1 regulates AR-mediated transcriptional activity and histone modification negatively.

A, Endogenous FOXP1 inhibited AR-mediated transcriptional activity. The LNCaP cells were transfected with siControl, siFOXA1, siFOXP1 number 1, or FOXP1 number 2. After 48 hours of incubation, cells were transfected with luciferase vectors containing ARBS sequences. Data represent mean ± SD (n = 3). *, P < .05; **, P < .01. LUC, luciferase. B, Histone modification is associated with FOXP1-binding. LNCaP cells were transfected with siControl or siFOXP1 number 1. After 48 hours of incubation, a ChIP assay was performed using the K4me2 antibody. The fold enrichment over siControl samples was measured by real-time PCR. Data represent mean ± SD (n = 3). *, P < .05; **, P < .01. TACC2, transforming acidic coiled-coil-containing protein 2.
Formation of AR/FOXA1/FOXP1 centric complexes is dependent on FOXA1
The results of our FOXP1 ChIP-seq analysis demonstrated that FOXP1 colocalizes with FOXA1 and AR ligand dependently (Figure 6A). The colocalization of the three bound factors increased by DHT treatment. In addition, through a Re-ChIP analysis, we also observed the colocalization of FOXA1 and FOXP1 at ARBSs (Supplemental Figure 3). To further investigate the mechanism of FOXP1 recruitment to ARBSs, we analyzed protein level interactions of both factors (Figure 6B). Our immunoprecipitation and immunoblot analyses in LNCaP cells showed that the interaction between FOXP1 and FOXA1/AR is FOXA1 dependent and that the complexes of these factors are formed upon androgen treatment. The interaction of FOXP1 with FOXA1/AR was also observed in VCaP cells (Supplemental Figure 4). Thus, FOXP1 is recruited to ARBSs to collaborate with AR/FOXA1 complex to modulate the transcriptional activity.
Figure 6. FOXP1 associates with AR in a FOXA1-dependent manner and negatively regulates the AR-driven transcriptional program.

A, Androgen-dependent overlap of AR transcriptional complex. A Venn diagram shows the overlap between FOXA1/FOXP1 and AR/FOXP1 common regions. B, Formation of the complex is dependent on FOXA1. LNCaP cells were transfected with siControl, siFOXA1, and siFOXP1 number 1. Cell lysates were immunoprecipitated using FOXP1 antibodies. A Western blot analysis of each transcription factor was performed. IB, immunoblot. C, Global effects of FOXP1 and FOXA1 on AR-binding. AR-binding was mapped in LNCaP cells transfected with siControl, siFOXA1, and siFOXP1 by ChIP-seq analysis. ARBSs were determined by model-based analysis of ChIP-seq (MACS) (fold > 10, P < 10−5). A Venn diagram shows the overlap between the two data sets. D, Global analysis of siFOXA1 and siFOXP1 effects on androgen regulation of AR-binding genes. Genes targeted by AR were identified by ChIP-seq analysis. LNCaP cells were transfected with siFOXA1, siFOXP1 number 1, or siControl. After 48 hours of incubation, the cells were treated with vehicle or DHT 10 nM for 24 hours. Left panel, A total of 537 AR-binding genes induced (fold change > 1.4) in LNCaP cells transfected with siControl were selected by microarray analysis. Effect of knockdown of FOXA1 was determined by the fold change in induction (repressed: < 0.8-fold, induced: > 1.4-fold). Right panel, Effect of the knockdown of FOXP1 was determined by the fold change in induction. χ2 tests were performed to compare with background (all androgen induced genes) induction levels. We select FOXP1-binding genes among androgen-induced genes, which are the closest genes to FOXP1-binding sites. E, FOXP1 binding genes were enriched in AR-binding genes induced by siFOXP1. The heat map represents the androgen-responsiveness by a microarray analysis of AR-binding genes. FOXP1-binding genes were indicated by yellow bars. WCL, whole cell lysate.
Moreover, although the mutual regulation of FOXA1 and AR has not been fully investigated, FOXA1 knockdown decreased the AR protein level (Figure 6B). Our ChIP-seq analysis revealed a significant enrichment of FOXA1 (P < 10−5) around the promoter and AR-binding enhancer regions of the AR gene locus (Supplemental Figure 5A). In addition, we also found that by knocking down FOXA1, the AR mRNA level decreased in the DHT-treated cells (Supplemental Figure 5B). Furthermore, to investigate the role of FOXA1 in AR promoter and enhancer activity, we constructed luciferase vectors including the promoter/enhancer regions as indicated by ChIP-seq. The luciferase assay showed that FOXA1 knockdown decreased the promoter and enhancer activity significantly in LNCaP cells (Supplemental Figure 5C). These results indicate that FOXA1 enhances both the AR and FOXP1 expression levels for AR/FOXA1/FOXP1 complex formation.
FOXP1 negatively regulates the output of the AR-mediated transcriptional program
We further analyzed the effect of FOXP1 on AR signaling at the genome-wide level. We performed an AR ChIP-seq analysis in the AR-positive prostate cancer cells treated with short interfering (si) control, siFOXA1, or siFOXP1 (Figure 6C and Supplemental Figure 6). Previous studies analyzing the effect of FOXA1 knockdown on ARBSs in LNCaP cells (6, 14, 15) reported that the FOXA1-defined AR binding regions and ARBSs are widely affected by FOXA1 knockdown. We observed that the number of ARBSs was reduced by siFOXA1; however, 509 novel ARBSs (Figure 6C, left panel, and Supplemental Figure 6A) could also be obtained as reported (6, 15). In contrast to FOXA1, we observed no significant change of the ARBSs by the inhibition of FOXP1, suggesting that FOXP1 binding does not function for enhancement of AR recruitments and that AR bindings are induced by other mechanisms (Figure 6C, right panel, and Supplemental Figure 6B).
Next, we examined the direct involvement of FOXP1 in the AR-mediated transcriptional program at the genome-wide level. To investigate the correlation of FOX family-binding sites and the expression of the adjacent known genes, we performed a microarray analysis in LNCaP cells. By inhibiting FOXA1, we observed an inhibition of most of the androgen-mediated induction of genes near ARBSs, which are considered as putative direct targets of AR (Figure 6D, left panel). Moreover, we selected RefSeq (National Center of Biotechnology Information) genes near AR- and FOXP1-binding sites. By combining this information with the gene expression profiles, we observed an increased induction by FOXP1 inhibition in 35% of the AR-binding genes (significantly enriched compared with all androgen regulated genes; Figure 6D, right panel). FOXP1 binding was significantly enriched in these gene clusters, indicating the direct inhibitory function of FOXP1 on AR-mediated gene induction at the genome-wide level (Figure 6E). We also confirmed the negative effect of FOXP1 on representative AR-regulated genes by quantitative RT-PCR in both LNCaP and VCaP cells by knocking down FOXP1 (Supplemental Figure 7, A and B). Overexpression of FOXP1 repressed androgen-mediated induction of AR-targeted genes significantly in LNCaP cells (Supplemental Figure 7C). Taken together, these results indicated that the genome-wide AR transcriptional program is negatively modulated by FOXP1 recruitments.
Decreased expression of FOXP1 is associated with a poor prognosis for prostate cancer patients
Next, we asked whether a decrease in the expression of FOXP1 is correlated with tumor transformation in normal prostate tissue. We examined FOXP1 expression in normal PrECs. By a Western blot analysis, we detected FOXP1 protein expression in PrECs (Figure 7A) and an effective knockdown of FOXP1 using siFOXP1 number 1. By reducing the FOXP1 expression, we observed that cell proliferation was not promoted in the PrECs (data not shown); however, significantly enhanced cell migration was observed, indicating the induction of malignant characteristics through the activating motility by FOXP1 repression (Figure 7B). This analysis indicated the involvement of FOXP1 repression in malignant transformation by promoting cell migration ability.
Figure 7. Low expression of FOXP1 indicates a poor prognosis in prostate cancer patients A, Endogenous expression of FOXP1 in PrECs.
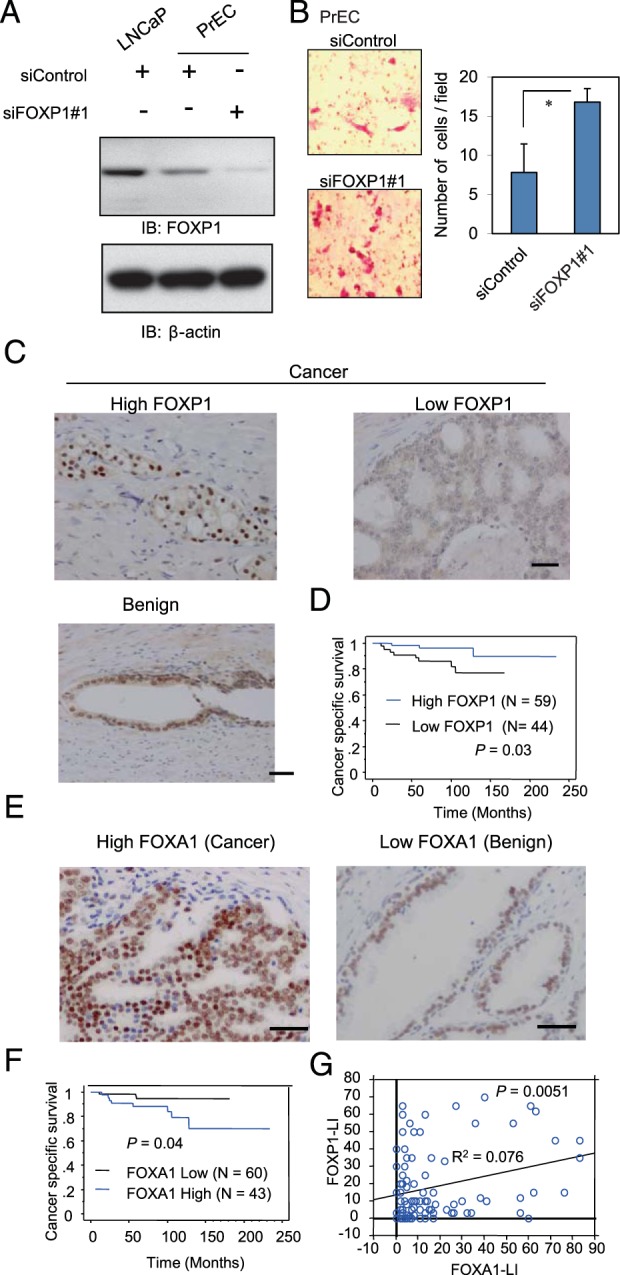
The PrECs were transfected with siControl or siFOXP1 number 1. After 48 hours of incubation, a Western blot analysis of FOXP1 was performed. IB, immunoblot. B, FOXP1 negatively regulated cell migration in PrECs. The PrECs were transfected with siControl or siFOXP1 number 1. After 48 hours of incubation, the cells were seeded in the matrigel-coated upper chamber. The average numbers of invading cells are shown. Data represent mean ± SD (n = 4). *, P < .05. C, FOXP1 immunohistochemistry was performed on benign and prostate cancer tissues. Examples of staining patterns in benign and cancerous tissues are shown. Bar, 50 μm. D, Kaplan-Meier curve of cancer-specific survival rate with low FOXP1 staining or high FOXP1 staining (LI >10). E, FOXA1 immunohistochemistry was performed on prostate cancer (left panel) and benign (right panel) tissues. Examples of staining patterns are shown. Bar, 50 μm. F, Kaplan-Meier curve of cancer-specific survival rate with low FOXA1 staining or high FOXA1 staining (LI > 10). G, Positive correlation between FOXP1 and FOXA1 expression levels. A regression analysis was performed to analyze the correlation.
Next, to analyze how FOXP1 function in prostate cancer tissues, we used immunohistochemistry to examine the protein levels of FOXA1 and FOXP1 in clinical samples (n = 103) taken from prostate cancer tumors and benign tissues (Figure 7C). Decreased expression of FOXP1 expression in prostate cancer tissues was associated with poor cancer-specific survival compared with tissues with higher FOXP1 expression (P = .028, Figure 7D), suggesting that the decreased expression of FOXP1 could be a novel prognostic factor of prostate cancer. Moreover, we observed a strong expression of FOXA1 in the nuclei of prostate cancer tissues (Figure 7E). Comparatively weak staining was observed in benign prostate tissues surrounding the cancerous regions. A Kaplan-Meier analysis showed poor cancer-specific survival in the patients with higher FOXA1 expression compared with the patients with lower expression (P = .04, Figure 7F). Furthermore, although a strong positive correlation was observed between the FOXA1/FOXP1 and AR expression levels (Supplemental Figure 8, A and B), a weak but significant positive correlation was observed between FOXA1 and FOXP1 expression levels, suggesting the positive regulation of FOXP1 by FOXA1 in prostate tumors (Figure 7G).
In addition, we analyzed FOXP1 expression in metastatic prostate cancer tissues using data sets in Oncomine (oncomine.org). We found that three data sets indicated the decreased expression of FOXP1 in metastatic tissues (Tomlins et al: P = .00015, Lapointe et al: P = .0011, Varambally et al: P = .038), suggesting the repression of FOXP1 in cancer progression (Supplemental Figure 8C).
Taken together, our results indicate a tumor-suppressive role of FOXP1 in prostate cancer and raise the possibility that a decreased expression of FOXP1 induces AR hypersensitivity, which is frequently associated with the disease progression to hormone-refractory prostate cancer.
Discussion
In the present study, we demonstrated a novel global AR-regulatory mechanism by FOXP1 and its association with AR and FOXA1. Despite a controversial result about the regulation of FOXP1 by androgens (20), our ChIP-seq results indicate that FOXP1 expression is dependent on a combinational mechanism of AR and FOXA1, which binds to multiple regions around the FOXP1 locus. Because FOXA1 binding is androgen independent, FOXP1 expression can be almost diminished with a FOXA1 knockdown, even without androgen treatment. Upon DHT treatment, FOXP1 was induced by AR recruitment to enhancer regions around the gene locus. Moreover, FOXP1 can form fusion proteins with ETV1, which is activated in advanced prostate cancer (21). Our data suggest that the aberrant expression of such FOXP1-ETV1 fusion gene can use these AR-binding enhancers for transcriptional activation.
Our extensive ChIP-seq analysis showed that accumulated FOXP1 interacts with AR translocating to the nucleus and then colocalizes with FOXA1 and AR at ARBSs. In contrast to the function of FOXA1 as a pioneer factor (5), FOXP1 seems to show a unique function of modulating the AR transcriptional sensitivity after DHT treatment. FOXP1 proteins generally function as transcriptional repressors by interacting with coregulators such as C-terminal binding protein 1 (22–24). In our previous report, we conducted a luciferase reporter assay and observed that exogenous FOXP1 repressed androgen-dependent transcriptional activation of the PSA promoter (16).
In the present study, we conducted a global analysis of androgen response based on microarray data and showed that FOXP1 is directly involved in the AR-driven transcriptional program as a negative effector in prostate cancer cells. The genes activated by FOXP1 inhibitions included androgen-regulated genes associated with prostate cancer growth, such as APP. In addition, although FOXP1 is mainly recruited to histone activated enhancer regions, androgen-mediated activation of histone H3K4 methylation at ARBSs was increased by FOXP1 knockdown, suggesting the repressive effect of FOXP1 on these regions. However, AR ChIP-seq analysis after the FOXP1 knockdown indicated that the activation is not induced by the enhancement of AR-bindings. We assume that histone modification is probably caused by accompanying histone modifiers such as corepressors including C-terminal binding protein 1 or histone modifying enzymes with FOXP1. Taken together, the present study suggests that the epigenetic and transcriptional regulation of androgen-regulated genes by FOXP1 is the determinant of prostate cancer cell proliferation.
To investigate the clinical significance of FOXP1 in prostate cancer, we also performed an immunohistochemical analysis of FOXP1 expression in tumor samples obtained from more than 100 prostate cancer specimens. The results provide the first evidence that the decreased expression of FOXP1 may be a prognostic factor for survival of patients with prostate cancer. Our results demonstrate a tumor-suppressive role of FOXP1 in clinical prostate cancer. Although FOXP1 is positively associated with FOXA1 expression, a poor prognosis was observed in tumors with a lower expression of FOXP1 or a higher expression of FOXA1. Thus, given that FOXP1 is a modulator of AR signaling and represses prostate cancer cell proliferation, analyzing the FOXP1 expression level can be a novel diagnostic tool. Furthermore, modulating the activity or expression of FOXP1 has potential as a useful treatment for advanced prostate cancer.
We assumed that changes at the genomic level are an important mechanism for regulating FOXP1 levels in addition to transcriptional regulation (20, 25). A previous report on the global analysis of prostate cancer genomic changes in clinical tissues identified several regions that are frequently lost in cancer (25). Interestingly, the genomic loss of region including FOXP1 was significantly associated with prostate cancer progression and Transmembrane proterase, serine 2-ERG fusion expression, as is frequently observed in other representative tumor suppressive loci such as phosphatase and tensin homolog deleted from chromosome 10 or p53. Homozygous deletion of this region is correlated with a reduced expression of FOXP1 transcripts. However, no mutation was found in FOXP1 by exon sequencing in this study. Thus, loss of heterozygosity may be a mechanism for reducing FOXP1 expression in tumors. In other reports, the chromosome region including FOXP1 is frequently lost in cancer (26), and linked with ERG rearrangements or phosphatase and tensin homolog deleted from chromosome 10 loss in prostate cancer (20). In this study, heterozygous deletions of FOXP1 are associated significantly with reduced transcriptional levels. However, a significant association was not observed between heterozygous deletions and FOXP1 protein levels analyzed by immunohistochemistry (20). Therefore, other transcriptional or posttranscriptional repression mechanisms such as Enhancer of zeste 2 or microRNA could be expected to be at play, although further studies are necessary to consider such mechanisms in cancer development.
The findings that decreased expression of FOXP1 could predict poor survival and that it plays a tumor suppressive role through AR signals indicate novel aspects of FOXP1 as an AR-regulated gene. Conversely, most AR target genes studied previously were found to be up-regulated in cancer. Functional analyses of AR target genes have demonstrated that many AR-activated genes identified to date are involved in prostate cancer progression (2, 12, 18, 19). We and other groups have also observed that activated AR up-regulates a subset of AR downstream signals in CRPC model cells. However, FOXP1 shows a different expression pattern in aggressive prostate cancer compared with other classical AR-regulated genes. Therefore, we infer that the expression levels of FOXP1 may decrease after castration for the treatment of prostate cancer. Thus, such treatment could induce the progression to AR hypersensitivity that is frequently observed in CRPC. Our investigation of FOXP1 expression in metastatic cancer tissues also indicated a decreased expression of FOXP1. In addition, a recent report revealed the mechanism by which castration induces an increase in the transcript level of AR because of self-induced negative regulation from AR directly binding to its enhancer region (27). In line with this mechanism, long-term castration could induce AR hypersensitivity and the generation of CRPC.
In summary, FOXP1 is a key modulator of the transcription factor complex formed by AR and FOXA1. Decreased expression of FOXP1 is associated with AR hypersensitivity and prostate cancer cell proliferation. These findings suggest a pivotal role for FOXP1 in the development and progression of prostate cancer.
Acknowledgments
We thank RIKEN for sequencing our samples. We also thank N. Oishi and N. Sasaki for technical assistance.
This work was supported by grants from the Cell Innovation Program (to S.I.) and P-DIRECT (to S.I.) from the Ministry of Education, Culture, Sports, Science, and Technology, Japan; grants from the Japan Society for the Promotion of Science, Japan (to S.I. and K.T.); Grants-in-Aid from the Ministry of Health, Labour, and Welfare, Japan (to S.I.); the Program for the Promotion of Fundamental Studies in Health Sciences (to S.I.), National Institute of Biomedical Innovation, Japan; and grants from the Yamaguchi Endocrine Research Foundation, Japan (to K.T).
Disclosure Summary: The authors have nothing to declare.
Funding Statement
This work was supported by grants from the Cell Innovation Program (to S.I.) and P-DIRECT (to S.I.) from the Ministry of Education, Culture, Sports, Science, and Technology, Japan; grants from the Japan Society for the Promotion of Science, Japan (to S.I. and K.T.); Grants-in-Aid from the Ministry of Health, Labour, and Welfare, Japan (to S.I.); the Program for the Promotion of Fundamental Studies in Health Sciences (to S.I.), National Institute of Biomedical Innovation, Japan; and grants from the Yamaguchi Endocrine Research Foundation, Japan (to K.T).
Footnotes
- APP
- amyloid precursor protein
- AR
- androgen receptor
- ARBS
- AR binding site
- ARE
- androgen-responsive element
- ChIP
- chromatin immunoprecipitation
- ChIP-seq
- ChIP sequence
- CRPC
- castration-resistant prostate cancer
- DHT
- dihydrotestosterone
- FACS
- fluorescence-activated cell sorter
- FBS
- fetal bovine serum
- FOX
- forkhead box protein
- H3K4me
- histone H3 lysine 4 methylation
- K4me1
- histone H3 lysine 4 monomethylation
- LI
- labeling index
- PARP
- poly(ADP-ribose) polymerase
- PrEC
- prostate epithelial cell
- PSA
- prostate-specific antigen
- siRNA
- short interfering RNA
- si
- short interfering
- TUNEL
- terminal deoxynucleotidyl transferase-mediated deoxyuridine triphosphate nick end labeling.
References
- 1. Chen CD, Welsbie DS, Tran C, et al. Molecular determinants of resistance to antiandrogen therapy. Nat Med. 2004;10(1):33–39. [DOI] [PubMed] [Google Scholar]
- 2. Wang Q, Li W, Zhang Y, et al. Androgen receptor regulates a distinct transcription program in androgen-independent prostate cancer. Cell. 2009;138(2):245–256. [DOI] [PMC free article] [PubMed] [Google Scholar]
- 3. Waltering KK, Urbanucci A, Visakorpi T. Androgen receptor (AR) aberrations in castration-resistant prostate cancer. Mol Cell Endocrinol. 2012;360(1–2):38–43. [DOI] [PubMed] [Google Scholar]
- 4. Takayama K, Inoue S. Transcriptional network of androgen receptor in prostate cancer progression. Int J Urol. 2013;20(8):756–768. [DOI] [PubMed] [Google Scholar]
- 5. Wang Q, Li W, Liu XS, et al. A hierarchical network of transcription factors governs androgen receptor-dependent prostate cancer growth. Mol Cell. 2007;27(3):380–392. [DOI] [PMC free article] [PubMed] [Google Scholar]
- 6. Wang D, Garcia-Bassets I, Benner C, et al. Reprogramming transcription by distinct classes of enhancers functionally defined by eRNA. Nature. 2011;474(7351):390–394. [DOI] [PMC free article] [PubMed] [Google Scholar]
- 7. Lupien M, Eeckhoute J, Meyer CA, et al. FoxA1 translates epigenetic signatures into enhancer-driven lineage-specific transcription. Cell. 2008;132(6):958–970. [DOI] [PMC free article] [PubMed] [Google Scholar]
- 8. Gerhardt J, Montani M, Wild P, et al. FOXA1 promotes tumor progression in prostate cancer and represents a novel hallmark of castration-resistant prostate cancer. Am J Pathol. 2012;180(2):848–861. [DOI] [PubMed] [Google Scholar]
- 9. Tan PY, Chang CW, Chng KR, Wansa KD, Sung WK, Cheung E. Integration of regulatory networks by NKX3–1 promotes androgen-dependent prostate cancer survival. Mol Cell Biol. 2012;32(2):399–414. [DOI] [PMC free article] [PubMed] [Google Scholar]
- 10. Chng KR, Chang CW, Tan SK, et al. A transcriptional repressor co-regulatory network governing androgen response in prostate cancers. EMBO J. 2012;31(12):2810–2823. [DOI] [PMC free article] [PubMed] [Google Scholar]
- 11. Takayama K, Tsutsumi S, Katayama S, et al. Integration of cap analysis of gene expression and chromatin immunoprecipitation analysis on array reveals genome-wide androgen receptor signaling in prostate cancer cells. Oncogene. 2011;30(5):619–630. [DOI] [PubMed] [Google Scholar]
- 12. Takayama K, Horie-Inoue K, Katayama S, et al. Androgen-responsive long noncoding RNA CTBP1-AS promotes prostate cancer. EMBO J. 2013;32(12):1665–1680. [DOI] [PMC free article] [PubMed] [Google Scholar]
- 13. Guseva NV, Rokhlin OW, Bair TB, Glover RB, Cohen MB. Inhibition of p53 expression modifies the specificity of chromatin binding by the androgen receptor. Oncotarget. 2012;3(2):183–194. [DOI] [PMC free article] [PubMed] [Google Scholar]
- 14. Tomlins SA, Mehra R, Rhodes DR, et al. Integrative molecular concept modeling of prostate cancer progression. Nat Genet. 2007;39(1):41–51. [DOI] [PubMed] [Google Scholar]
- 15. Sahu B, Laakso M, Ovaska K, et al. Dual role of FoxA1 in androgen receptor binding to chromatin, androgen signalling and prostate cancer. EMBO J. 2011;30(19):3962–3976. [DOI] [PMC free article] [PubMed] [Google Scholar]
- 16. Takayama K, Horie-Inoue K, Ikeda K, et al. FOXP1 is an androgen-responsive transcription factor that negatively regulates androgen receptor signaling in prostate cancer cells. Biochem Biophys Res Commun. 2008;374(2):388–393. [DOI] [PubMed] [Google Scholar]
- 17. Murata T, Takayama K, Urano T, et al. 14-3-]3ζ, a novel androgen-responsive gene, is upregulated in prostate cancer and promotes prostate cancer cell proliferation and survival. Clin Cancer Res. 2012;18(20):5617–5627. [DOI] [PubMed] [Google Scholar]
- 18. Takayama K, Tsutsumi S, Suzuki T, et al. Amyloid precursor protein is a primary androgen target gene that promotes prostate cancer growth. Cancer Res. 2009;69(1):137–142. [DOI] [PubMed] [Google Scholar]
- 19. Takayama K, Horie-Inoue K, Suzuki T, et al. TACC2 is an androgen-responsive cell cycle regulator promoting androgen-mediated and castration-resistant growth of prostate cancer. Mol Endocrinol. 2012;26:748–761. [DOI] [PMC free article] [PubMed] [Google Scholar]
- 20. Krohn A, Seidel A, Burkhardt L, et al. Recurrent deletion of 3p13 targets multiple tumour suppressor genes and defines a distinct subgroup of aggressive ERG fusion-positive prostate cancers. J Pathol. 2013;231(1):130–141. [DOI] [PubMed] [Google Scholar]
- 21. Hermans KG, van der Korput HA, van Marion R, et al. Truncated ETV1, fused to novel tissue-specific genes, and full-length ETV1 in prostate cancer. Cancer Res. 2008;68(18):7541–7549. [DOI] [PubMed] [Google Scholar]
- 22. Li S, Weidenfeld J, Morrisey EE. Transcriptional and DNA binding activity of the Foxp1/2/4 family is modulated by heterotypic and homotypic protein interactions. Mol Cell Biol. 2004;24(2):809–822. [DOI] [PMC free article] [PubMed] [Google Scholar]
- 23. Wang B, Lin D, Li C, Tucker P. Multiple domains define the expression and regulatory properties of Foxp1 forkhead transcriptional repressors. J Biol Chem. 2003;278(27):24259–24268. [DOI] [PubMed] [Google Scholar]
- 24. Katoh M, Igarashi M, Fukuda H, Nakagama H, Katoh M. Cancer genetics and genomics of human FOX family genes. Cancer Lett. 2013;328(2):198–206. [DOI] [PubMed] [Google Scholar]
- 25. Taylor BS, Schultz N, Hieronymus H, et al. Integrative genomic profiling of human prostate cancer. Cancer Cell. 2010;18(1):11–22. [DOI] [PMC free article] [PubMed] [Google Scholar]
- 26. Banham AH, Beasley N, Campo E, et al. The FOXP1 winged helix transcription factor is a novel candidate tumor suppressor gene on chromosome 3p. Cancer Res. 2001;61(24):8820–8829. [PubMed] [Google Scholar]
- 27. Cai C, He HH, Chen S, et al. Androgen receptor gene expression in prostate cancer is directly suppressed by the androgen receptor through recruitment of lysine-specific demethylase 1. Cancer Cell. 2011;20(4):457–471. [DOI] [PMC free article] [PubMed] [Google Scholar]