

Abstract
Androgen excess is a central feature of polycystic ovary syndrome (PCOS), which affects 6% to 10% of young women. Mammals exposed to elevated androgens in utero develop PCOS-like phenotypes in adulthood, suggesting fetal origins of PCOS. We hypothesize that excess androgen exposure during early embryonic development may disturb the epigenome and disrupt metabolism in exposed and unexposed subsequent generations. Zebrafish were used to study the underlying mechanism of fetal origins. Embryos were exposed to androgens (testosterone and dihydrotestosterone) early at 26 to 56 hours post fertilization or late at 21 to 28 days post fertilization. Exposed zebrafish (F0) were grown to adults and crossed to generate unexposed offspring (F1). For both generations, global DNA methylation levels were examined in ovaries using a luminometric methylation assay, and fasting and postprandial blood glucose levels were measured. We found that early but not late androgen exposure induced changes in global methylation and glucose homeostasis in both generations. In general, F0 adult zebrafish exhibited altered global methylation levels in the ovary; F1 zebrafish had global hypomethylation. Fasting blood glucose levels were decreased in F0 but increased in F1; postprandial glucose levels were elevated in both F0 and F1. This androgenized zebrafish study suggests that transient excess androgen exposure during early development can result in transgenerational alterations in the ovarian epigenome and glucose homeostasis. Current data cannot establish a causal relationship between epigenetic changes and altered glucose homeostasis. Whether transgenerational epigenetic alteration induced by prenatal androgen exposure plays a role in the development of PCOS in humans deserves study.
Androgen excess affects around 7% of reproductive-aged women, and 80% to 85% of women with hyperandrogenism have polycystic ovary syndrome (PCOS) (1, 2). Patients with PCOS have an increased risk of infertility, obesity, insulin resistance, diabetes, and cardiovascular disease (2, 3). The pathogenesis of PCOS is not well understood. It is thought that both genetic and early-life environmental factors in utero may contribute to the development of PCOS (4). Animal models of PCOS suggest that it may have fetal origins. Prenatally androgenized (PA) rhesus monkeys, sheep, mice, or rats, after exposure to increased androgens during early or late gestation, develop PCOS-like phenotypes once they reach adulthood (5, 6). Although the phenomenon of fetal androgen exposure leading to PCOS has been established in animal models, little is known of the underlying molecular mechanisms.
Studies of common adult diseases with fetal origins suggest that intrauterine environmental factors can reprogram early development via disturbance of the epigenome (7–11). Epigenetic modifications may be a key link between early intrauterine events and adult diseases (9, 12), and hormonal insults in utero can result in epigenetic alterations with persistent changes in life (13, 14). Epigenetic changes induced by environmental factors not only perturb the somatic cells but also affect the gametes that give rise to the next generation (15, 16). Therefore, we and others (5) hypothesized that excess androgen exposure during early development may disturb the epigenome and result in persistent abnormalities in reproductive and metabolic systems not only in the exposed generation but also in subsequent generations.
To test this hypothesis, zebrafish were used as an animal model to study androgen effects. Zebrafish have been used to study vertebrate reproduction and endocrine systems (17, 18). Their rapid embryonic development and short life cycle make zebrafish an ideal model to examine transgenerational epigenetic effects. Previously, we did not find significant methylation changes in peripheral blood from patients with PCOS compared with that from control subjects (19). Given that DNA methylation is tissue specific and that the ovary is one of the most relevant tissues in PCOS, we studied androgen effects on global methylation status in zebrafish ovary in the present study. Circulating fasting and postprandial glucose levels were measured in both androgen-exposed zebrafish and their unexposed offspring to assess androgen impacts on metabolic systems. Our findings that androgen exposure during early development alters the epigenome and glucose homeostasis may have implications for the pathogenesis of PCOS in humans.
Materials and Methods
Maintenance of Zebrafish
Zebrafish strain AB (wild type [WT]) was used. Embryos were maintained and raised as described previously (20). In brief, zebrafish embryos were collected after natural spawning and incubated in egg water in dishes (1.5-mL stock salts added to 1 L of distilled water). Zebrafish after 15 days postfertilization (dpf) were maintained in system tank water. At 5 dpf, zebrafish were fed with powdered food and then were fed with brine shrimp twice daily from 9 dpf. Fish were maintained at 28°C on a 14-hour light, 10-hour dark cycle. All animal experimentation was conducted in accord with accepted standards of humane animal care. This study was conducted with institutional animal care and use committee approval.
Androgen exposure in vivo
Testosterone (T) (T5411; Sigma-Aldrich), and dihydrotestosterone (DHT) (730637; Sigma-Aldrich) were prepared in the vehicle dimethoxyethane (DME) (E27408; Sigma-Aldrich), and diluted in egg water at 50, 500, or 1000 ng/L concentrations (all in 2% DME). Exposure doses were lower than or similar to the physiologic concentrations of T in adult zebrafish (600 ng/L for female zebrafish to 2000 ng/L for male zebrafish) (21). Vehicle groups were prepared using the same concentrations of DME alone.
To mimic the early and late treatments in PA rhesus monkeys (6), we selected 2 specific time periods for embryonic androgen exposure in zebrafish (Figure 1). F0 zebrafish were exposed to nothing, vehicle (DME), or androgens (T or DHT) at 2 different time windows: the early treatment (E) was from 26 to 56 hours postfertilization (hpf) for 30 hours (during which GnRH neurons appear and migrate to their destination), and the late treatment (L) was from 21 to 28 dpf for 7 days (during ovarian development). After treatment, F0 zebrafish were removed from the treated medium and grown in regular egg water (early treatment) or tank water (late treatment) till adulthood (3 months postfertilization). We selected the most informative groups among F0 zebrafish to generate F1. F1 zebrafish were generated either by in-crossing F0 zebrafish androgenized with 50 ng/L DHT (DHT50 × DHT50) or testosterone at 50 ng/L (T50 × T50) or 1000 ng/L (T1000 × T1000), or by out-crossing F0 females androgenized with 500 ng/L testosterone with unexposed males [T500(female [F]) × WT(male [M])]. Tables 1 and 2 list all of the experimental zebrafish groups generated for this study.
Figure 1.

Breeding scheme for androgenized zebrafish. Parent individuals (P) were crossed to generate embryos, which were split into 4 groups, exposed to nothing or to DME, T, or DHT at different doses (50, 500, and 1000 ng/L) during early or late time windows. The embryos were grown to the F0 zebrafish. The F0 individuals were then crossed with early androgen-exposed zebrafish or unexposed controls to generate 4 groups of F1 individuals: T500(F) × WT(M), T50 × T50, T1000 × T1000 and DHT50 × DHT50. Unexposed controls were included for both F0 and F1 generations.
Table 1.
Global Methylation Percentage in the Ovary for F0 Zebrafish Compared With That in Unexposed Controls
| Groups | Global Methylation, % | P |
|---|---|---|
| Unexposed controls | 71.3 (3.2) | Reference |
| F0 early treatment | ||
| E-DME-500 | 71.6 (7.1) | .76 |
| E-DME-1000 | 71.2 (16.2) | .99 |
| E-T-50 | 78.6 (1.1) | .019a |
| E-T-500 | 68.4 (7.1) | .016a |
| E-T-1000 | 68.7 (11.4) | .21 |
| E-DHT-50 | 74.9 (3.3) | .032a |
| E-DHT-500 | 74.6 (10.0) | .061 |
| E-DHT-1000 | 67.5 (8.9) | .067 |
| F0 late treatment | ||
| L-DME-500 | 73.1 (6.8) | .92 |
| L-DME-1000 | 63.6 (14.4) | .13 |
| L-T-500 | 60.0 (23.7) | .075 |
| L-T-1000 | 66.2 (9.8) | .16 |
| L-DHT-500 | 73.0 (4.8) | .42 |
| L-DHT-1000 | 68.2 (2.3) | .051 |
Adult zebrafish were 5 to 10 months old. Data are medians (interquartile ranges). P values were derived from the Mann-Whitney test.
Significant P value (P < .05).
Table 2.
Global Methylation Percentage in the Ovary for F1 Zebrafish Compared With That for Unexposed Controls
| Groups | Global Methylation, % | P |
|---|---|---|
| Unexposed controls | 71.3 (3.2) | Reference |
| T50 × T50 | 52.8 (24.5) | .0085a |
| T1000 × T1000 | 64.8 (5.3) | .0043a |
| T500(F) × WT(M) | 72.0 (27.2) | .94 |
| DHT50 × DHT50 | 67.5 (13.7) | .40 |
Adult zebrafish were 5 to 10 months old. Data are medians (interquartile ranges). P values were derived from the Mann-Whitney test.
Significant P value (P < .05).
Ovary isolation
To obtain the zebrafish ovary, adult female zebrafish (5–10 months old) were killed by prolonged immersion in 0.2% tricaine methanesulfonate for 5 minutes before the ovaries were removed manually using forceps and scissors. Each experimental (F0 or F1) group contained 5 ovaries (except for 2 F0 groups, early exposed T50 and early exposed DHT50, in which only 3 individuals were available per group). The reference group consisted of 8 ovaries from unexposed control adult fish.
DNA extraction and global methylation analysis
DNA was extracted from ovaries using the AllPrep DNA/RNA/Protein Mini Kit (QIAGEN) and then was subjected to the luminometric methylation assay (EpigenDx, Inc). The luminometric methylation assay is a quantitative method to estimate overall DNA methylation across the genome; it does not provide gene-specific methylation. DNA was first digested with methylation-sensitive (HpaII) and methylation-insensitive (MspI) restriction enzymes. HpaII digests only the unmethylated sequence, whereas MspI digests all the sites. Only digested sites were subjected to single nucleotide extension followed by a pyrosequencing reaction. The overall DNA methylation percentage of a DNA sample was calculated as 1 − the HpaII/MspI ratio (which is percent unmethylated) (22).
Meal tolerance tests
As described previously (23), male and female zebrafish were given ad libitum feeding of a regular diet (live adult brine shrimp) for 1 hour after 20 hours of fasting. Adult zebrafish (8–12 months old) were killed in 0.2% tricaine methanesulfonate before tail section. Blood was collected from the tail vein at fasting and at 1, 2, 4, 6, 30, and 48 hours after feeding. At least 0.3 μL of blood was applied to a glucometer test strip (FreeStyle InsuLinx; Abbott Laboratories). Exposed groups and their offspring (except E-T-50 and E-DHT-50) were available for meal tolerance tests (3–6 adult fish per exposure group/time point). Three groups (L-DME-500, L-T-500, and DHT50 × DHT50) did not have fish for all time points of the meal tolerance tests. Twelve to 19 unexposed control adult fish served as the reference group for each time point.
Statistical analysis
Mann-Whitney tests were used for comparison of global methylation levels or blood glucose at each time point between unexposed controls and androgen-treated groups or their progeny. Data are expressed as medians (interquartile ranges). Significance was taken at a value of P < .05.
Results
Global methylation analysis
Table 1 compares global methylation in ovaries between F0 androgenized zebrafish and unexposed controls. At a low dose of 50 ng/L, both early T (E-T-50)– and early DHT (E-DHT-50)–treated zebrafish ovaries had increased global methylation (78.6%, P = .019; 74.9%, P = .032, respectively, compared with that of the unexposed controls, 71.3%).
In contrast, early treatment of higher dose T at 500 ng/L significantly decreased global methylation in adult zebrafish (68.4%) compared with that in unexposed controls (71.3%) (P = .016). Global methylation of ovaries with early T treatment of 1000 ng/L, although similar to that with E-T-500 treatment, did not statistically differ from that of unexposed controls. Zebrafish treated early with DHT at higher doses (500 or 1000 ng/L) exhibited no difference in global methylation levels compared with those of untreated controls.
In the late treatment groups (T or DHT, 500 or 1000 ng/L exposure), no statistically significant differences in global methylation compared with that in controls were observed.
Next, we assessed whether global methylation status changed in ovaries of F1 zebrafish (unexposed offspring of F0 fish exposed early to androgens) compared with that of unexposed controls (Table 2). F1 T50 × T50 female offspring had lower global methylation levels than controls (52.8% vs 71.3%, P = .0085). F1 T1000 × T1000 female offspring also had lower global methylation levels than controls (64.8% vs 71.3%, P = .0043).
Meal tolerance test
To determine the impact of excess androgen exposure on glucose homeostasis, we measured fasting and postprandial blood glucose in zebrafish (Table 3 and Figure 2). Compared with unexposed controls, F0 zebrafish with early androgen treatment had significantly lower glucose at fasting (E-T-1000 and E-DHT-500) (P = .013 and .041, respectively) or 48 hours after a meal (E-DHT-1000) (P = .035). Both E-T-500- and E-T-1000-treated groups exhibited higher glucose at 4 hours after a meal (P = .0044 and .032, respectively). In late treatment, no significant differences in glucose levels were observed in any group at fasting or after feeding. In the F1 groups, both fasting and postprandial glucose levels were significantly higher than those of the controls at several time points (P = .0006–.025) (Table 3 and Figure 2).
Table 3.
Fasting and Postprandial Glucose Levels of Zebrafish With and Without Androgen Exposure
| Groups | Glucose Level, mg/dL |
||||||
|---|---|---|---|---|---|---|---|
| Fasting | 1 H | 2 H | 4 H | 6 H | 30 H | 48 H | |
| Unexposed controls | 42.5 (6.3) | 77.0 (28.0) | 97.0 (49.0) | 69.0 (16.5) | 57.5 (43.5) | 52.0 (48.0) | 43.0 (16.0) |
| F0 early treatment | |||||||
| E-DME-500 | 33.0 (13.0) | 70.5 (28.8) | 94.5 (13.8) | 67.5 (33.0) | 80.5 (62.8) | 44.0 (18.5) | 48.0 (27.0) |
| E-DME-1000 | 32.0 (26.5) | 82.0 (43.3) | 92.0 (56.5) | 79.0 (85.0) | 57.0 (25.0) | 37.5 (6.0) | 35.5 (15.3) |
| E-T-500 | 40.0 (48.0) | 68.0 (34.0) | 87.5 (22.0) | 132.0 (81.8)a | 95.0 (62.0) | 29.5 (11.8) | 39.0 (5.5) |
| E-T-1000 | 32.0 (13.0)b | 61.0 (22.0) | 84.0 (29.0) | 103.5 (44.0)c | 95.0 (73.5) | 38.0 (18.5) | 35.5 (31.0) |
| E-DHT-500 | 28.5 (18.0)d | 79.0 (26.0) | 107.0 (23.8) | 77.0 (110.0) | 95.5 (63.8) | 38.5 (41.3) | 41.5 (27.3) |
| E-DHT-1000 | 37.5 (19.8) | 67.5 (20.9) | 85.5 (33.0) | 75.5 (42.5) | 68 0.0 (72.3) | 40.5 (8.25) | 30.0 (11.8)e |
| F0 late treatment | |||||||
| L-DME-500 | 45.5 (14.5) | 79.5 (47.0) | 111.0 (124.0) | 84.0 (53.0) | 73.0 (14.0) | 72.0 (46.0) | NA |
| L-DME-1000 | 31.5 (13.0) | 97.0 (26.3) | 89.0 (30.0) | 73.0 (45.8) | 61.0 (44.0) | 26.0 (9.0) | 46.0 (9.0) |
| L-T-500 | 44.0 (8.5) | 63.5 (15.3) | 108.0 (32.5) | 91.0 (52.5) | 60.0 (59.5) | 39.0 (83) | NA |
| L-T-1000 | 45.5 (21.3) | 55.0 (57.0) | 97.0 (75.5) | 94.5 (123.0) | 66.5 (25.0) | 49.0 (21.0) | 39.0 (21.0) |
| L-DHT-500 | 43.0 (8.3) | 84.0 (22.0) | 73.0 (23.5) | 53.0 (22.5) | 68.5 (120.5) | 46.0 (30.0) | 39.0 (23.0) |
| L-DHT-1000 | 37.0 (12.5) | 65.5 (38.0) | 109.0 (64.5) | 81.0 (122.0) | 44.5 (33.5) | 31.0 (14.5) | 48.0 (7.0) |
| F1 (offspring) | |||||||
| T50 × T50 | 47.0 (12.0) | 69.0 (60.5) | 139.0 (100.8) | 96.5 (90.8) | 104.0 (61.5) | 40.5 (50.3) | 55.5 (39.8) |
| T1000 × T1000 | 47.0 (38.0) | 125.0 (36.0)f | 119.0 (104.0) | 121.5 (97.0) | 138.0 (88.0)g | 84.0 (55.0) | 87.0 (17.0)h |
| T500(F) × WT(M) | 58.0 (14.0)i | 108.5 (51.8) | 134.0 (118.0) | 126.0 (76.5)j | 103.5 (42.8)k | 128.0 (65.0)l | 67.5 (21.8)h |
| DHT50 × DHT50 | 40.5 (29.0) | NA | NA | 86.0 (22.5) | NA | NA | NA |
Abbreviation: NA, fish not available; H, hours after a meal. Adult zebrafish were 8 to 12 months old. Data are medians (interquartile ranges). To convert glucose from milligrams per deciliter to millimoles per liter, multiply by 0.05551.
Glucose levels with significant P values compared with those for unexposed controls: aP = .0044;
P = .012;
P = .032;
P = .041;
P = .035;
P = .025;
P = .020;
P = .00060;
P = .00070;
P = .011;
P = .015;
P = .0023.
Figure 2.
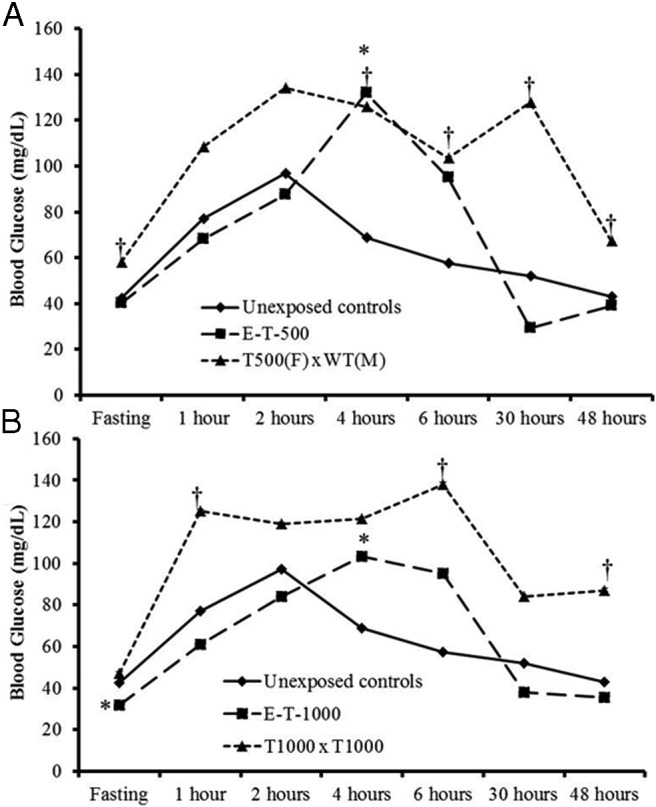
Exposed groups and their offspring exhibit altered fasting and postprandial glucose levels. A, Glucose homeostasis for E-T-500 and T500(F) × WT(M) groups compared with that for unexposed controls, B, Glucose homeostasis for E-T-1000 and T1000 × T1000 groups compared with those for unexposed controls. Median glucose levels are displayed. Significant differences between groups at each time point: *, F0 vs controls; †, F1 vs controls.
Discussion
Our study introduced a novel zebrafish model to discover the transgenerational effects of excess androgen exposure during development. The findings suggest that (1) early but not late androgen exposure can induce global methylation changes in the ovaries and alter glucose homeostasis and (2) these effects on the epigenetic state and glucose levels are transmitted from the exposed generation to the next unexposed generation. Although DHT is the more active androgen, we found that T had stronger effects, suggesting that estrogen might play a role in reprogramming during early development due to aromatization.
Epigenetic alterations induced by excess androgens
Given that little is known about which genes may be affected by androgen exposure, the global methylation status was first assessed to determine whether the epigenome was altered in androgenized zebrafish. Global methylation changes induced by androgen exposure suggest that excess androgens can disrupt epigenetic patterns during early development, and epigenetic marks can be transmitted to the next generation. Patients with androgen insensitivity syndrome had differential methylation marks compared with normal control subjects, suggesting that androgens can alter patterns of the methylome in humans (24).
We observed nonmonotonic changes in global methylation status with T exposure, comprising hypermethylation at low dose exposure and hypomethylation at higher dose exposure compared with changes in unexposed controls. This pattern has been described for many studies of endocrine-disrupting chemicals (EDCs), which, similar to hormones, have displayed biphasic dose responses for various endpoints (25), which may be explained by the down-regulation of receptors at higher exposure levels or adaptive responses through complex signaling pathways (26).
Critical timing of androgen exposure during development
Our androgenized zebrafish model provides supportive evidence that excess androgens induce reprogramming of the fetus, possibly via epigenetic alteration as described previously in PA animals (27, 28). Whether reprogramming occurs in humans in the etiology of PCOS is controversial. Some human studies suggest that prenatal androgen excess may predispose the fetus to develop PCOS phenotypes in adulthood (29, 30). Studies of opposite sex twins or measurement of androgen levels in umbilical cord blood argue against reprogramming (31–33). Human studies attempting to measure fetal androgen exposure used blood obtained at term, which may be inappropriate timing. The critical time of exposure may be early in gestation, as observed in PA monkeys (6). In the PA rhesus monkey model, the pregnant females were given testosterone daily at 40 to 80 days of gestation for the early treatment. This is the period during which GnRH neurons migrate from the olfactory placode region to their destination in the hypothalamus. For the late treatment, monkeys were exposed to androgens at 100 to 140 days of gestation, which is the time window of development of primordial follicles and appearance of multilayered antral follicles in the ovaries (6). To mimic the exposure times in PA monkeys, zebrafish embryos were exposed early from the time of appearance of GnRH-expressing cells (26 hpf) to the time (52–54 hpf) at which they reach their final destination (34) or exposed late when the ovary appears during the larval stage (21–28 dpf) (35). Given conservation in vertebrate development, findings from these 2 exposure times in zebrafish may provide insights regarding the effects of prenatal androgenization on GnRH neuronal cells and ovaries during embryogenesis in humans. We observed abnormal glucose tolerance only in the early treated zebrafish. It is possible that androgen penetration in late treatment is lower than in early treatment, resulting in weaker exposure. However, our results are similar to the findings of metabolic derangements found only in the early androgenized monkeys (6). We hypothesize that early androgen exposure may disrupt pancreatic development, resulting in β-cell dysfunction, because the dorsal and ventral buds fuse at around 50 hpf to form a mature pancreas (36). It is also possible that androgen exposure has an effect on insulin sensitivity.
Transgenerational metabolic derangements in zebrafish programmed by androgen exposure
PA animals often develop insulin resistance, β-cell dysfunction, and increased visceral fat, free fatty acids, total cholesterol, and triglycerides (27, 37, 38). Consistent with the metabolic alterations present in other PA animal models, we also found that disturbed glucose homeostasis is passed down to the next generation in zebrafish. The first epigenome-wide association study between DNA methylation and metabolic traits in human blood suggested that DNA methylation may play an important role in metabolism (39). Increased global methylation in peripheral blood was associated with insulin resistance, increased fasting glucose, and dyslipidemia (40, 41). In visceral adipose tissue of obese individuals, lower global methylation was associated with metabolic syndrome and increased fasting glucose (42). We found that F1 exhibited global hypomethylation in the ovary and higher fasting and postprandial glucose levels than the controls. Given the association of DNA methylation with metabolic abnormalities, we hypothesize that DNA methylation alterations induced by excess androgens may be a molecular basis underlying metabolic abnormalities and transgenerational effects in androgenized zebrafish.
Interestingly, we found decreased fasting glucose levels in certain F0 groups but increased glucose at both fasting and multiple time points after a meal in the F1 fish. Similarly, in certain groups ovarian methylation was discordant between generations. Because F0 fish experienced androgen exposure as diploid embryos, whereas F1 fish experienced the same exposure as haploid gametes, followed by development within androgen-exposed parents, the environments experienced by F0 and F1 are quite different and may result in different phenotypes. Elucidation of these complex factors will require future experimentation.
Environmental androgen exposure and potential transgenerational effects
Our results raise the possibility that environmental androgens (either endogenous androgens such as those in PCOS or exogenous androgens such as androgenic EDCs) may potentially disturb the epigenome and metabolic systems in exposed and subsequent generations. EDCs can disrupt neuroendocrine systems that control reproduction and metabolism, reprogram the epigenome, and affect subsequent generations (43). Environmental androgens have been identified in surface water, sediment pore water, and the effluent in estuaries (44). Growth promoters given to farm animals such as trenbolone acetate are androgenic, and androgen activity has been found in beef cattle runoff and feedlot surface soils (45). Exposure to androgenic EDC can impair female reproductive behavior and fin morphology in freshwater fish (46).
Environmentally induced changes can be passed to subsequent generations (16). Paternal high-fat diet exposure disrupted β-cell function in rat female offspring, resulting in increased body weight, adiposity, insulin resistance, and impaired glucose tolerance (47). In utero methyl donor supplementation during gestation in mice can induce heritable germline epigenetic changes in the Avy allele not only in the exposed fetuses but also in the offspring (48). Exposure to environmental toxins (eg, a fungicide, a pesticide mixture, and a plastic mixture containing bisphenol A) during embryonic gonadal sex determination caused transgenerational changes in the epigenome and ovarian morphology in rats (49). These observations and our zebrafish data highlight the need to study the transgenerational effects of environmental androgens. In addition to genetic predisposition, epigenetic transgenerational effects from environmental factors might contribute to the pathogenesis of human diseases.
Limitations
We performed a pilot study to test excess androgen effects on zebrafish. Although the sample size in each treatment group was relatively small, in our study we were able to detect differences in global methylation status and glucose tolerance in exposed and subsequent generations, suggesting that transgenerational effects from androgens were significant. Experiments were performed once without replication; however, conclusions are partially supported by similar results from different doses. For example, F1 zebrafish with both parents exposed to T (T50 × T50 or T1000 × T1000) had decreased ovarian methylation, and in meal tolerance tests, 4-hour postprandial glucose levels were increased for both E-T-500 and E-T-1000 fish. We targeted female zebrafish first, and only ovaries were subjected to methylation analysis. We did not study methylation status in the pancreas or in insulin-responsive tissues. Global methylation analysis and glucose measurements were not performed in the same individual zebrafish; therefore, we were unable to test the correlation between global methylation level and glucose levels. Each fish used for glucose measurement at each single time point was killed during tail blood collection, so the area under the curve could not be used to measure the glucose response to a meal for each individual zebrafish. Androgen effects on methylation were different among F1 groups (T × T vs T(F) × WT). Without having performed crosses of androgen-exposed males to control females, we cannot determine whether transgenerational methylation is dependent on androgen-treated males. Last, our results suggest that T had stronger effects on methylation and glucose homeostasis than DHT, despite the fact that DHT is a stronger androgen receptor–activating ligand. Because T can be aromatized to estradiol, the current data cannot exclude estrogenic contributions to reprogramming. Further to this point, DHT can be converted to the estrogenic metabolite betadiol in the zebrafish brain (50). It is also possible that T may have greater penetration than DHT into zebrafish embryos, resulting in stronger effects. These possibilities deserve future study.
In conclusion, our results suggest that transient excess androgen exposure during early development can induce persistent changes in methylation status and disturb glucose homeostasis in zebrafish. These effects can be passed down through generations. However, these experiments do not definitively prove that androgen-mediated changes of the epigenome are the cause of changes in glucose homeostasis. Future studies will focus on the molecular basis of transgenerational epigenetic inheritance in androgenized zebrafish, such as identifying specific genes with altered methylation. Whether the epigenetic changes are directly correlated with glucose levels or other metabolic phenotypes deserves investigation. Key genes or pathways whose epigenetic alterations due to androgen exposure persist in generations represent worthy candidates for studies to elucidate the pathophysiology of human diseases such as PCOS.
Acknowledgments
We thank Dr Daniel A. Dumesic for insightful comments on the manuscript.
This work was supported by internal funds and by the Cedars-Sinai Winnick Clinical Scholars Award (to M.O.G.).
Disclosure Summary: The authors have nothing to disclose.
Funding Statement
This work was supported by internal funds and by the Cedars-Sinai Winnick Clinical Scholars Award (to M.O.G.).
Footnotes
- DME
- dimethoxyethane
- DHT
- dihydrotestosterone
- dpf
- days postfertilization
- E
- early treatment
- EDC
- endocrine-disrupting chemical
- F
- female
- hpf
- hours postfertilization
- L
- late treatment
- M
- male
- PA
- prenatally androgenized
- PCOS
- polycystic ovary syndrome
- T
- testosterone
- WT
- wild type.
References
- 1. Azziz R, Sanchez LA, Knochenhauer ES, et al. . Androgen excess in women: experience with over 1000 consecutive patients. J Clin Endocrinol Metab. 2004;89:453–462. [DOI] [PubMed] [Google Scholar]
- 2. Goodarzi MO, Dumesic DA, Chazenbalk G, Azziz R. Polycystic ovary syndrome: etiology, pathogenesis and diagnosis. Nat Rev Endocrinol. 2011;7:219–231. [DOI] [PubMed] [Google Scholar]
- 3. Azziz R, Woods KS, Reyna R, Key TJ, Knochenhauer ES, Yildiz BO. The prevalence and features of the polycystic ovary syndrome in an unselected population. J Clin Endocrinol Metab. 2004;89:2745–2749. [DOI] [PubMed] [Google Scholar]
- 4. Franks S, McCarthy MI, Hardy K. Development of polycystic ovary syndrome: involvement of genetic and environmental factors. Int J Androl. 2006;29:278–285; discussion 286–290. [DOI] [PubMed] [Google Scholar]
- 5. Li Z, Huang H. Epigenetic abnormality: a possible mechanism underlying the fetal origin of polycystic ovary syndrome. Med Hypotheses. 2008;70:638–642. [DOI] [PubMed] [Google Scholar]
- 6. Dumesic DA, Abbott DH, Padmanabhan V. Polycystic ovary syndrome and its developmental origins. Rev Endocr Metab Disord. 2007;8:127–141. [DOI] [PMC free article] [PubMed] [Google Scholar]
- 7. Jones RH, Ozanne SE. Fetal programming of glucose-insulin metabolism. Mol Cell Endocrinol. 2009;297:4–9. [DOI] [PubMed] [Google Scholar]
- 8. Newbold RR, Padilla-Banks E, Jefferson WN, Heindel JJ. Effects of endocrine disruptors on obesity. Int J Androl. 2008;31:201–208. [DOI] [PubMed] [Google Scholar]
- 9. Waterland RA. Is epigenetics an important link between early life events and adult disease? Horm Res. 2009;71(Suppl 1):13–16. [DOI] [PubMed] [Google Scholar]
- 10. Xita N, Tsatsoulis A. Fetal origins of the metabolic syndrome. Ann NY Acad Sci. 2010;1205:148–155. [DOI] [PubMed] [Google Scholar]
- 11. Chen M, Zhang L. Epigenetic mechanisms in developmental programming of adult disease. Drug Discov Today. 2011;16:1007–1018. [DOI] [PMC free article] [PubMed] [Google Scholar]
- 12. Gabory A, Attig L, Junien C. Developmental programming and epigenetics. Am J Clin Nutr. 2011;94:1943S–1952S. [DOI] [PubMed] [Google Scholar]
- 13. Ho SM, Tang WY, Belmonte de Frausto J, Prins GS. Developmental exposure to estradiol and bisphenol A increases susceptibility to prostate carcinogenesis and epigenetically regulates phosphodiesterase type 4 variant 4. Cancer Res. 2006;66:5624–5632. [DOI] [PMC free article] [PubMed] [Google Scholar]
- 14. Li S, Hansman R, Newbold R, Davis B, McLachlan JA, Barrett JC. Neonatal diethylstilbestrol exposure induces persistent elevation of c-fos expression and hypomethylation in its exon-4 in mouse uterus. Mol Carcinog. 2003;38:78–84. [DOI] [PubMed] [Google Scholar]
- 15. Skinner MK. What is an epigenetic transgenerational phenotype? F3 or F2. Reprod Toxicol. 2008;25:2–6. [DOI] [PMC free article] [PubMed] [Google Scholar]
- 16. Daxinger L, Whitelaw E. Understanding transgenerational epigenetic inheritance via the gametes in mammals. Nat Rev Genet. 2012;13:153–162. [DOI] [PubMed] [Google Scholar]
- 17. Löhr H, Hammerschmidt M. Zebrafish in endocrine systems: recent advances and implications for human disease. Annu Rev Physiol. 2011;73:183–211. [DOI] [PubMed] [Google Scholar]
- 18. Lieschke GJ, Currie PD. Animal models of human disease: zebrafish swim into view. Nat Rev Genet. 2007;8:353–367. [DOI] [PubMed] [Google Scholar]
- 19. Xu N, Azziz R, Goodarzi MO. Epigenetics in polycystic ovary syndrome: a pilot study of global DNA methylation. Fertil Steril. 2010;94:781–783.e1. [DOI] [PMC free article] [PubMed] [Google Scholar]
- 20. Westerfield M. The Zebrafish Book. A Guide for the Laboratory Use of Zebrafish (Danio rerio). 5th ed Eugene, OR: University of Oregon Press; 2007. [Google Scholar]
- 21. Liu C, Deng J, Yu L, Ramesh M, Zhou B. Endocrine disruption and reproductive impairment in zebrafish by exposure to 8:2 fluorotelomer alcohol. Aquat Toxicol. 2010;96:70–76. [DOI] [PubMed] [Google Scholar]
- 22. Karimi M, Johansson S, Ekström TJ. Using LUMA: a luminometric-based assay for global DNA-methylation. Epigenetics. 2006;1:45–48. [DOI] [PubMed] [Google Scholar]
- 23. Liu NA, Jiang H, Ben-Shlomo A, et al. . Targeting zebrafish and murine pituitary corticotroph tumors with a cyclin-dependent kinase (CDK) inhibitor. Proc Natl Acad Sci USA. 2011;108:8414–8419. [DOI] [PMC free article] [PubMed] [Google Scholar]
- 24. Ammerpohl O, Bens S, Appari M, et al. . Androgen receptor function links human sexual dimorphism to DNA methylation. PLoS One. 2013;8:e73288. [DOI] [PMC free article] [PubMed] [Google Scholar]
- 25. Bouskine A, Nebout M, Brucker-Davis F, Benahmed M, Fenichel P. Low doses of bisphenol A promote human seminoma cell proliferation by activating PKA and PKG via a membrane G-protein-coupled estrogen receptor. Environ Health Perspect. 2009;117:1053–1058. [DOI] [PMC free article] [PubMed] [Google Scholar]
- 26. Schug TT, Janesick A, Blumberg B, Heindel JJ. Endocrine disrupting chemicals and disease susceptibility. J Steroid Biochem Mol Biol. 2011;127:204–215. [DOI] [PMC free article] [PubMed] [Google Scholar]
- 27. Padmanabhan V, Veiga-Lopez A. Animal models of the polycystic ovary syndrome phenotype. Steroids. 2013;78:734–740. [DOI] [PMC free article] [PubMed] [Google Scholar]
- 28. Xu N, Kwon S, Abbott DH, et al. . Epigenetic mechanism underlying the development of polycystic ovary syndrome (PCOS)-like phenotypes in prenatally androgenized rhesus monkeys. PLoS One. 2011;6:e27286. [DOI] [PMC free article] [PubMed] [Google Scholar]
- 29. Barnes RB, Rosenfield RL, Ehrmann DA, et al. . Ovarian hyperandrogynism as a result of congenital adrenal virilizing disorders: evidence for perinatal masculinization of neuroendocrine function in women. J Clin Endocrinol Metab. 1994;79:1328–1333. [DOI] [PubMed] [Google Scholar]
- 30. Xita N, Tsatsoulis A. Review: Fetal programming of polycystic ovary syndrome by androgen excess: evidence from experimental, clinical, and genetic association studies. J Clin Endocrinol Metab. 2006;91:1660–1666. [DOI] [PubMed] [Google Scholar]
- 31. Hickey M, Sloboda DM, Atkinson HC, et al. . The relationship between maternal and umbilical cord androgen levels and polycystic ovary syndrome in adolescence: a prospective cohort study. J Clin Endocrinol Metab. 2009;94:3714–3720. [DOI] [PubMed] [Google Scholar]
- 32. Anderson H, Fogel N, Grebe SK, Singh RJ, Taylor RL, Dunaif A. Infants of women with polycystic ovary syndrome have lower cord blood androstenedione and estradiol levels. J Clin Endocrinol Metab. 2010;95:2180–2186. [DOI] [PMC free article] [PubMed] [Google Scholar]
- 33. Kuijper EA, Vink JM, Lambalk CB, Boomsma DI. Prevalence of polycystic ovary syndrome in women from opposite-sex twin pairs. J Clin Endocrinol Metab. 2009;94:1987–1990. [DOI] [PubMed] [Google Scholar]
- 34. Gopinath A, Andrew Tseng L, Whitlock KE. Temporal and spatial expression of gonadotropin releasing hormone (GnRH) in the brain of developing zebrafish (Danio rerio). Gene Expr Patterns. 2004;4:65–70. [DOI] [PubMed] [Google Scholar]
- 35. Sprague J, Doerry E, Douglas S, Westerfield M. The Zebrafish Information Network (ZFIN): a resource for genetic, genomic and developmental research. Nucleic Acids Res. 2001;29:87–90. [DOI] [PMC free article] [PubMed] [Google Scholar]
- 36. Tehrani Z, Lin S. Endocrine pancreas development in zebrafish. Cell Cycle. 2011;10:3466–3472. [DOI] [PubMed] [Google Scholar]
- 37. Abbott DH, Bruns CR, Barnett DK, et al. . Experimentally induced gestational androgen excess disrupts glucoregulation in rhesus monkey dams and their female offspring. Am J Physiol Endocrinol Metab. 2010; 299:E741–E751. [DOI] [PMC free article] [PubMed] [Google Scholar]
- 38. Roland AV, Nunemaker CS, Keller SR, Moenter SM. Prenatal androgen exposure programs metabolic dysfunction in female mice. J Endocrinol. 2010;207:213–223. [DOI] [PMC free article] [PubMed] [Google Scholar]
- 39. Petersen AK, Zeilinger S, Kastenmüller G, et al. . Epigenetics meets metabolomics: an epigenome-wide association study with blood serum metabolic traits. Hum Mol Genet. 2014;23:534–545. [DOI] [PMC free article] [PubMed] [Google Scholar]
- 40. Zhao J, Goldberg J, Bremner JD, Vaccarino V. Global DNA methylation is associated with insulin resistance: a monozygotic twin study. Diabetes. 2012;61:542–546. [DOI] [PMC free article] [PubMed] [Google Scholar]
- 41. Pearce MS, McConnell JC, Potter C, et al. . Global LINE-1 DNA methylation is associated with blood glycaemic and lipid profiles. Int J Epidemiol. 2012;41:210–217. [DOI] [PMC free article] [PubMed] [Google Scholar]
- 42. Turcot V, Tchernof A, Deshaies Y, et al. . LINE-1 methylation in visceral adipose tissue of severely obese individuals is associated with metabolic syndrome status and related phenotypes. Clin Epigenetics. 2012;4:10. [DOI] [PMC free article] [PubMed] [Google Scholar]
- 43. Walker DM, Gore AC. Transgenerational neuroendocrine disruption of reproduction. Nat Rev Endocrinol. 2011;7:197–207. [DOI] [PMC free article] [PubMed] [Google Scholar]
- 44. Thomas KV, Hurst MR, Matthiessen P, McHugh M, Smith A, Waldock MJ. An assessment of in vitro androgenic activity and the identification of environmental androgens in United Kingdom estuaries. Environ Toxicol Chem. 2002;21:1456–1461. [PubMed] [Google Scholar]
- 45. Bartelt-Hunt SL, Snow DD, Kranz WL, et al. . Effect of growth promotants on the occurrence of endogenous and synthetic steroid hormones on feedlot soils and in runoff from beef cattle feeding operations. Environ Sci Technol. 2012;46:1352–1360. [DOI] [PubMed] [Google Scholar]
- 46. Saaristo M, Tomkins P, Allinson M, Allinson G, Wong BB. An androgenic agricultural contaminant impairs female reproductive behaviour in a freshwater fish. PLoS One. 2013;8:e62782. [DOI] [PMC free article] [PubMed] [Google Scholar]
- 47. Ng SF, Lin RC, Laybutt DR, Barres R, Owens JA, Morris MJ. Chronic high-fat diet in fathers programs β-cell dysfunction in female rat offspring. Nature. 2010;467:963–966. [DOI] [PubMed] [Google Scholar]
- 48. Cropley JE, Suter CM, Beckman KB, Martin DI. Germ-line epigenetic modification of the murine Avy allele by nutritional supplementation. Proc Natl Acad Sci USA. 2006;103:17308–17312. [DOI] [PMC free article] [PubMed] [Google Scholar]
- 49. Nilsson E, Larsen G, Manikkam M, Guerrero-Bosagna C, Savenkova MI, Skinner MK. Environmentally induced epigenetic transgenerational inheritance of ovarian disease. PLoS One. 2012;7:e36129. [DOI] [PMC free article] [PubMed] [Google Scholar]
- 50. Livaja M, Wang Y, Wieckhorst S, et al. . BSTA: a targeted approach combines bulked segregant analysis with next-generation sequencing and de novo transcriptome assembly for SNP discovery in sunflower. BMC Genomics. 2013;14:628. [DOI] [PMC free article] [PubMed] [Google Scholar]