

Abstract
Protein arginine methyltransferases (PRMTs) methylate arginine residues on histones and target transcription factors that play critical roles in many cellular processes, including gene transcription, mRNA splicing, proliferation, and differentiation. Recent studies have linked PRMT-dependent epigenetic marks and modifications to carcinogenesis and metastasis in cancer. However, the role of PRMT2-dependent signaling in breast cancer remains obscure. We demonstrate PRMT2 mRNA expression was significantly decreased in breast cancer relative to normal breast. Gene expression profiling, Ingenuity and protein-protein interaction network analysis after PRMT2-short interfering RNA transfection into MCF-7 cells, revealed that PRMT2-dependent gene expression is involved in cell-cycle regulation and checkpoint control, chromosomal instability, DNA repair, and carcinogenesis. For example, PRMT2 depletion achieved the following: 1) increased p21 and decreased cyclinD1 expression in (several) breast cancer cell lines, 2) decreased cell migration, 3) induced an increase in nucleotide excision repair and homologous recombination DNA repair, and 4) increased the probability of distance metastasis free survival (DMFS). The expression of PRMT2 and retinoid-related orphan receptor-γ (RORγ) is inversely correlated in estrogen receptor-positive breast cancer and increased RORγ expression increases DMFS. Furthermore, we found decreased expression of the PRMT2-dependent signature is significantly associated with increased probability of DMFS. Finally, weighted gene coexpression network analysis demonstrated a significant correlation between PRMT2-dependent genes and cell-cycle checkpoint, kinetochore, and DNA repair circuits. Strikingly, these PRMT2-dependent circuits are correlated with pan-cancer metagene signatures associated with epithelial-mesenchymal transition and chromosomal instability. This study demonstrates the role and significant correlation between a histone methyltransferase (PRMT2)-dependent signature, RORγ, the cell-cycle regulation, DNA repair circuits, and breast cancer survival outcomes.
Protein arginine methylation is a common posttranslational modification that is mediated by a family of eukaryotic enzymes, protein arginine N-methyltransferases (PRMTs). These enzymes transfer methyl groups from the methyl donor S-adenosyl-L-methionine to guanidine nitrogen atoms in arginine residues of target proteins. The addition of methyl groups by PRMTs may reduce the ability of arginine residues to serve as hydrogen bond donors and therefore have the potential to alter the function and activity of target proteins. Currently there are nine genes encoding the PRMT family members that fall into two specific classes based on dimethylarginine species production. Type I arginine N-methyltransferases including PRMT1, PRMT2, PRMT3, coactivator-associated argninine methyltransferase 1 (PRMT4), PRMT6 and PRMT8 produce ω-NG-monomethylated arginine intermediate and catalyze the formation of ω-NG-NG-asymmetric dimethylarginines. The type II arginine N-methyltransferases, PRMT5 and PRMT7, produce ω-NG-monomethylated arginine intermediates and are able to catalyze the formation of ω-NG-NG-symmetric dimethylarginines. PRMT9 is yet to be classified in relation to dimethylarginine species production.
The members of the PRMT family have widespread and varied expression along with shared and nonredundant substrate specificity, which in certain circumstances can be context dependent. The ubiquitous nature in terms of expression and potential substrates supports increasing evidence that PRMTs can influence a diverse range of cellular processes including growth, proliferation, differentiation, transcription, DNA repair, signal transduction, RNA processing, cell localization, and apoptosis (1). As would be expected of proteins that regulate such diverse processes, their deregulation or aberrant expression has been linked to the pathogenesis of a number of human diseases, including cancer (2, 3).
Human PRMT2 was discovered in 1998 by exon trapping and homology to the yeast methyltransferase HMT1 gene (4). The human PRMT2 cDNA, identified from expressed sequence tags, exhibits widespread tissue expression and has been demonstrated to exhibit weak type I arginine methyltransferase enzyme activity (5). Studies aimed at identifying a functional role for PRMT2 have found that it can act as a transcriptional cofactor being involved in the transcriptional activity of a number of steroid hormone/nuclear receptors, including estrogen receptors (ERs), retinoic acid receptors, and androgen receptors (6, 7). PRMT2 has also been found to be involved in β-catenin-mediated gene expression and the arginine methylation of signal transducer and activator of transcription-3 to regulate leptin signaling and to influence the nuclear factor-κB signaling pathway involved in programmed cell death and lipopolysaccharide-induced inflammatory response (8).
Several studies have identified proteins, such as the heterogeneous nuclear ribonucleoprotein adenovirus early region 1B-associated protein (E1B-AP5) that interact with PRMT2, suggesting a role in host cell adenoviral replication (9). PRMT2 has also been found to interact with the retinoblastoma protein to influence E2F1 transcriptional activity and cell-cycle regulation in PRMT2 (−/−) mouse embryonic fibroblasts (10). Reduction of PRMT2 has been shown to increase E2F transcription factor 1 (E2F1) expression in an estrogen-dependent manner and alter the expression of E2F1-dependent genes. The expression of PRMT2 and several proposed splice variants (PRMT2-α, -β, -γ) have been found to be up-regulated in certain breast cancer cell lines and a small breast cancer tissue cohort (11). This increase in PRMT2 expression was demonstrated to be associated with ER positivity, indicating a potential role of PRMT2 in estrogen-mediated signaling and potential involvement in breast cancer etiology and progression.
We report that PRMT2 is significantly decreased in human breast cancer relative to normal breast tissue. Genome-wide expression profiling after attenuation of PRMT2 expression in MCF-7 breast cancer cells demonstrated that PRMT2 is involved in the regulation of the cell cycle and carcinogenesis. Protein-protein interaction (PPI) network analysis further identified the interconnected network of genes associated with the kinetochore and DNA repair. Wound-healing assays demonstrated decreased cell migration in PRMT2 knockdown cells. RT-quantitative PCR (qPCR) analysis revealed that PRMT2 depletion increases the expression of retinoid-related orphan receptor-γ (RORγ) mRNA. Interestingly, there is an inverse correlation between PRMT2 and RORγ expression in several human breast cancer cohorts. Accordingly, increased RORγ expression is associated with a high distance metastasis-free survival (DMFS) rate of breast cancer patients. Kaplan-Meier (K-M) survival analysis revealed that the PRMT2_DOWN signature (down-regulated after PRMT2 depletion) is linked with a poor probability of DMFS and has the ability to predict breast cancer risk. A weighted gene coexpression network analysis (WGCNA) (12) revealed that genes modulated by PRMT2 form transcriptional circuits regulating many aspects of cell-cycle control and DNA repair. Importantly, these networks are linked with pan-cancer metagene signatures that represent two critical hallmarks of cancer progression, namely epithelial-to-mesenchymal transition (EMT) and chromosomal instability (CIN) (13). This study clearly demonstrates a critical role for PRMT2 expression in breast cancer outcomes and implicates PRMT2 as an important regulator of transcriptional circuits that are common to many cancers.
Materials and Methods
Cell culture and transfection
The MCF-7 cancer cell line was purchased from the American Type Culture Collection and freshly passaged, frozen, and subsequently stored in liquid nitrogen until required for further experimentation. Cells were thawed, cultured, and passaged less than 6 months for any experimental procedure. No additional verification and/or authentication of the cell line was performed by the authors of this manuscript. The MCF-7 cells were maintained in DMEM nutrient mixture F-12 plus 10% fetal bovine serum and maintained at 37°C and 5% CO2. For small interfering RNA (siRNA) experiments, cells were transfected for 48 hours with PRMT2-specific siRNA or control siRNA at a final concentration of 10 nM using RNAiMAX (Invitrogen) as described previously (14). To examine the depletion of PRMT2 expression levels, MCF-7 cells were transfected with siRNA according to the manufacturer's instructions. The siRNA used were as follows: PRMT2-siRNA-1, sense 5′-CCCUGACGGAUAAAGUCAU-3′, PRMT2-siRNA-1, antisense 5′-GGGACUGCCUAUUUCAGUA-3′; PRMT2-siRNA-2, sense 5′-CCUGGUUUAGCGUCCACUU-3′, PRMT2-siRNA-2, antisense 5′-GGACCAAAUCGCAGGUGAA-3′.
Silencer Select negative control (Ambion) was used as a negative control (control-siRNA), which has a proprietary unreleased sequence.
Microarray data analysis
Labeling and hybridization of the Illumina BeadArray analysis were performed by the Australian Genome Research Facility Ltd using the Illumina HumnaHT-12 V4 chips. Illumina array raw data were transferred to Agilent's commercialized GeneSpring GX software to normalize differentially expressed genes between control and PRMT2 knockdown RNA samples. Input raw data were normalized with percentile shift normalization to remove variation produced among samples during array labeling, hybridization, and scanning. A moderated t test was then used to identify changes in gene expression, followed by Benjamini-Hochberg false discovery rate (FDR) test to remove false positives. Genes were considered to be differentially expressed at a value of P < .05. The volcano plot exhibiting differentially expressed genes was generated by the GeneSpring GX program. PRMT2-dependent genes identified by microarray analysis were subjected to Ingenuity Pathway Analysis (QIAGEN) to analyze functional pathways and upstream regulators.
RNA isolation, reverse transcription, and RT-qPCR
RNA was isolated from MCF-7 cells, using the RNeasy RNA column system with on-column deoxyribonuclease treatment (QIAGEN), as described previously (15). Briefly, cDNA was synthesized from 600 ng of total RNA using TaqMan reverse transcription reagents, according to the manufacturer's instructions (Applied Biosystems). RT-qPCR was performed using a 96-well or 384-well ViiA7 Fast RT-PCR system with TaqMan primer/probe sets (Applied Biosystems): PRMT2 (Hs00181759_m1), TP53 (p53; Hs01034249_m1), CDKN1A (p21; Hs00355782_m1), CCND1 (Hs00765553_m1), RORC (RORγ total; Hs01076122_m1), RORC (RORγ1: Hs00172858_m1), ABL1 (Hs01104728_m1), AURKB (Hs00945858_g1), CCNB1 (Hs01030099_m1), CDK1 (Hs00938777_m1), and SKP2 (Hs01021864_m1). All gene expression levels were normalized to RPLP0 expression (Applied Biosystems; catalog number 4326314E). Target cDNA levels were analyzed by RT-qPCR in 10-μL reactions using a TaqMan PCR master mix (Applied Biosystems), TaqMan probe/primer sets, and cDNA (5% of the starting 600 ng of RNA). The relative expression compared with control was calculated by using the δδcycle threshold (Ct) method. For each experiment, six replicate wells of cells were used for each experimental condition.
Western blot
Cellular extracts (15 μg) together with 2× sodium dodecyl sulfate loading dye were heated to 95°C for 5 minutes and loaded onto a 10% sodium dodecyl sulfate polyacrylamide gel. Proteins were separated for 2 hours at 100 V and electroblotted/transferred onto a polyvinylidene fluoride membrane (Millipore) by running for 2 hours at 100 V at 4°C. Nonspecific binding sites were blocked by immersing the membrane in 5% skim milk with Tris-buffered saline-Tween 20 (TBST) or 5% BSA with TBST for 1 hour at room temperature. The primary antibodies for PRMT2 (Abcam; catalog number ab154154) or p21 (Cell Signaling; catalog number 2947) were diluted in blocking buffer, and a membrane was incubated on a rocker overnight at 4°C. The membrane was washed with TBST and incubated with an appropriate secondary antibody for 1 hour at room temperature. Expression signals were detected by Millipore Immobilon Western chemiluminescent horseradish peroxidase substrate (Millipore) and visualized using autoradiography by X-OMAT 2000 film developer (Kodak). The film was scanned with Microtek Scanmaker i800 (Microtek Lab), and the results were quantified using ImageJ software (National Institutes of Health, Bethesda, Maryland).
Analysis of breast cancer microarray data sets
Statistical analysis was performed using an online survival analysis tool (KMplot 2012 data; http://kmplot.com) or an open source program R (http://www.r-project.org). K-M survival analysis was generated based on PRMT2 probes (210384_at) or RORγ probes (206419_at, NM_005060) from breast cancer microarray data. Cluster and gene expression analysis was performed on the publicly available microarray data from the 54 breast cancer cell lines (E-TABM-157) (16). ER expression status and expression of PRMT1 (206445_s_at), PRMT2 (210384_at), PRMT3 (213320_at), coactivator-associated argninine methyltransferase 1 (PRMT4; 212512_s_at), PRMT5 (217786_at), PRMT7 (219408_at), PRMT8 (207772_s_at), and PRMT9 (222119_s_at) were curated and presented by the heatmap.2 function of the gplots package. The publicly available breast cancer microarray data sets including UNT (17), UPP (18), TRANSBIG (19), MAINZ (20), and NKI (21) were downloaded from Bioconductor (http://bioconductor.org). The 1279 genes that were differentially expressed by PRMT2 knockdown relative to controls in a significant manner (>2-fold, P < .05) were subjected to Ingenuity Pathway Analysis with Entrez-gene ID annotation. The PRMT2-dependent signature scores were computed by calculating an average expression of genes for each tumor sample.
Patients were split into lower quantile (≤33%) or upper quantile (≥66%) subgroups according to their signature score. Using the SurvComp package, survival analysis was performed to examine survival end points of two patient subgroups separately. When DMFS was not available, we used relapse-free survival data. The concordance index was calculated by the concordance index function of the Genefu package in five different breast cancer data sets or manually combined overall data set (22). The PRMT2-dependent signature was then compared with previously published NPI (23), GGI (17), and GENIUS (24). Individual hazard ratios (HRs) for PRMT2 or RORγ were computed using the HR function and are presented on the forest plot (22).
Protein-protein interaction module detection
PPI network information was obtained from iRefIndex 9.0 (25) and a simplified network comprising 4737 nodes and 101 526 edges was used for analysis. PPI module detection was performed using the Bioconductor package BioNet (26). BioNet finds connected subgraphs with low P values. A binomial uniform mixture model was fitted to the distribution of P values, and scores were derived for each network node at a given FDR (q = 0.05). Scores were then used to detect modules by applying the fast heuristic search algorithm (runFastHeinz). Detected modules were visualized using the Bioconductor package RedeR (27).
WGCNA and gene ontology (GO) pathway analysis
Normalized expression data from both analyses (28, 29) were used to generate a network by following the standard procedure of WGCNA (12). Briefly, pair-wise Pearson correlations were calculated between each gene pair and connection strengths used to calculate topological overlap (TO), a robust and biologically meaningful measurement of gene similarity based on two genes' coexpression relationships with all other genes in the network. Genes were hierarchically clustered using 1-TO as the distance measure, and initial module assignments were determined using a dynamic tree-cutting algorithm (30). Pearson correlations between each gene and each module eigengene were calculated (referred to as a gene's module membership) along with the corresponding P values (31). The module eigengene is commonly used as a representative value for a module and is defined as the first principal component of a module and is the component that explains the maximum possible variability for all genes in a module. HTSanalyseR (32) was used for GO analysis and incorporated gene module membership for gene set enrichment analysis. Module eigengenes were used for K-M analysis and intrinsic subtype association.
Human breast tissue samples analysis by TaqMan low-density arrays (TLDAs) and RT-qPCR
The purified RNA samples from normal human breast and human breast cancer cohorts for this study have been previously described (15, 33). The breast tissue samples were obtained from primary invasive ductal carcinoma (IDC) or normal breast of breast reduction mammoplasty or volunteered normal breast biopsy tissue with no known history of breast disease. Support for this cohort analysis was from a Collaborative Program Grant (to C.L.C., W.D.T., P.J.L., G.E.O.M., J.W.F., P.J.F., and E.R.S.) from the National Breast Cancer Foundation of Australia. This study was approved by the human research ethics committees of the participating institutions. PRMT2 mRNA expression in human breast cancer relative to normal breast was measured on custom TLDAs (Applied Biosystems) using a 384-well ViiA7 Fast RT-PCR system. The geNorm software imbedded within the ABI/Intergromics StatMiner version 4.1 software package was used to select the most appropriate and stable combination of internal control genes. TLDAs were performed according to the manufacturer's instructions and analyzed as described previously (33–35). The TaqMan gene expression assay (Hs00181759_m1) was used for the analysis of PRMT2 and the relative expression was normalized against five selected control genes including MRPL19 (Hs00608519_m1), PGK1 (Hs99999906_m1), PPIA (Hs99999904_m1), TFRC (Hs99999911_m1), and UBC (Hs00824723_m1). Significance was assigned by the use of the empirical Bayes statistic function followed by the stringent refinement and filtering of data using the Benjamini-Hochberg procedure to limit the P value FDR. TLDAs were analyzed using the normalized Ct values (δCt) of the replicates between the control/calibrator and the target sample after the FDR test (34, 35). For the examination of p21, RT-qPCR was implemented as described earlier, using IPO8 (Hs00183533_m1) as the control. The relative expression compared with control was calculated by using the δδCt method.
NR expression profiling by TLDA
TLDAs for NR expression profiling in MCF-7 cells after control-siRNA or PRMT2-siRNA-1 transfection were used according to the manufacturer's instructions and analyzed as described earlier (15, 33). The TaqMan gene expression assays (Applied Biosystems; catalog number 4379961) used the selected controls including glyceraldehyde-3-phosphate dehydrogenase (GAPDH) (Hs99999905_m1), β-glucuronidase B (GUSB) (Hs99999908_m1), and Ubiquitin C (UBC) (Hs00824723_m1). A total of six plates of TLDAs of PRMT2 knockdown MCF-7 cells were analyzed using the relative quantification method of Ct and the normalized Ct values (δCt) of the replicates between the control/calibrator and the target sample.
Wound-healing migration assay
Cells were transfected with control-siRNA or PRMT2-siRNA in a six-well plate. Scratch wounds were created across MCF-7 cell monolayers using sterile 200-μL plastic pipette tips. Wells were subsequently rinsed with PBS and replaced with fresh complete media. Images of wounds were taken at 0-, 24-, and 48-hour time point using a ×4 objective fitted on a Nikon Ti-U inverted fluorescence microscope under a bright field. Images were acquired using a Nikon Digital Sight DS-U2 with 5mp color and 1.3mp monocamera on the NIS-Elements BF and F software. Gap closure of scratch wounds was measured using the ImageJ software (National Institutes of Health).
DNA repair assays
For the UV damage assay, MCF-7 cells were transfected with control-siRNA or PRMT2-siRNA-1 using RNAiMAX (Life Technologies) and incubated for 24 hours. UVB irradiation was performed with 25 mJ/cm2 in PBS as described previously (36). Genomic DNA was collected from individually transfected six-well plates prior to UV irradiation or 4 minutes, 4 hours, 24 hours, or 48 hours afterward. A DNeasy blood and tissue DNA extraction kit (QIAGEN) was used for harvesting genomic DNAs. One hundred nanograms of total genomic DNA for each condition were transferred to a nylon filter and probed for cyclobutane pyrimidine dimer (CPD) levels using anti-CPD (1:1000, TDM-2; MBL International Corp). Following an antimouse-horseradish peroxidase-conjugated secondary antibody staining incubation (1:10 000), the membrane was exposed to X-ray film. UV damage assay experiments were repeated twice, independently in duplicate. A representative figure was shown.
For the homologous recombination repair assay, we used the dual reporter-green fluorescent protein (GFP) assay following the procedure described elsewhere (37, 38). Briefly, MCF7DRGFP cells were cultured as described for MCF-7 and seeded at 3 × 10⁵ cells per milliliter−1 in 3-cm dishes. After 24 hours at 37°C in a 5% CO2 incubator, cells were transfected with 8 μL of RNAi max Lipofectamine (Invitrogen) and 90 nM of PRMT2-siRNA-1 or the silencer select negative control siRNA. After 24 hours of culture, cells were transfected again with 8 μL of Lipofectamine 2000 (Invitrogen) and 10 μg of SceI plasmid or the empty vector as a control and cultured further for 48 hours. After that time, cells were harvested and analyzed by flow cytometry on a LSRII (BD Science). Data were analyzed using FlowJo (TreeStar), and then the number of GFP-positive cells were normalized against the scramble control and plotted.
Statistical analysis
A Students' t test or two-way ANOVA with Tukey's multiple comparison test was applied to determine the statistical significance of data. Significance was denoted by P values with NS meaning not significant (*, P < .05, **, P < .01, and ***, P < .001).
Results
PRMT2 expression is decreased in breast cancer: PRMT2-dependent gene expression regulates multiple pathways (including cell cycle and DNA repair) involved in breast cancer
We assessed the relative expression level of PRMT2 mRNA in IDC tissues from [combined ER positive (ER+ve) and ER negative (ER−ve) breast cancer patients, n = 66] relative to normal breast tissues (from combined pre- and postmenopausal women with no known history of breast cancer disease, n = 50). The relative expression of PRMT2 mRNA (normalized against the expression of five internal controls) was significantly decreased in the IDC breast cancer cohort relative to expression in the normal breast cohort (Figure 1A). This finding (for PRMT2) is consistent with the TLDA-based analysis of more than 300 coregulators (including PRMT2) described in the Supplemental Data of our recently published study (39), which examined the expression of more than 300 coregulator genes in pre- and postmenopausal breast tissue, and in ER+ve and ER−ve breast cancer.
Figure 1.
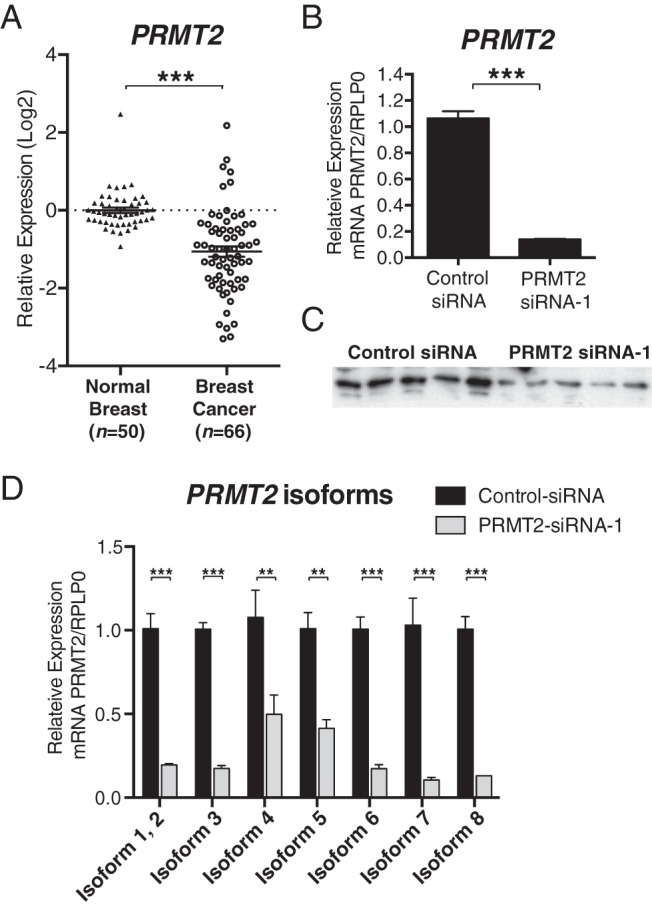
Significance of PRMT2 in breast cancer A, Decreased mRNA expression of PRMT2 in breast cancer. PRMT2 mRNA expression level is presented in relative quantification with log2 scale from IDC human breast cancer tissue samples (n = 66) relative to normal breast tissue samples (n = 50). The nonparametric Wilcoxon rank sum test was conducted with the Integromics Statminer software package. For normalization, selected geNorm controls (MRPL19, PGK1, PPIA, TFRC, and UBC) were used. PRMT2 knockdown validation by RT-qPCR and Western blot analysis. B, MCF-7 cells were transfected with control-siRNA or PRMT2-siRNA (n = 6) for 48 hours. Relative gene expression level was determined for PRMT2 using Taqman gene expression assay (Applied Biosystems) normalized to an endogenous control (RPLP0). Data are presented as the mean (SEM) of six transfected cultures. C, Western blot analysis of whole-cell extracts collected after 72 hours of transfection with either control-siRNA or PRMT2-siRNA-1. D, PRMT2 isoforms were measured by RT-qPCR. Relative mRNA expression was determined using Sybr Green Assay and normalized to RPLP0. Data are presented as the mean (SEM) of three transfected cultures.
We then examined expression of the PRMT family in 54 breast cancer cell line using a publicly available microarray dataset (16). The rationale was to identify a well-characterized human breast cancer cell line that expressed PRMT2 so that we could subsequently examine the effect of PRMT2 depletion. The curated PRMT expression data in the multiple cell lines demonstrated that PRMT2 mRNA expression is highly abundant in the MCF-7 breast cancer cell line (Supplemental Figure 1A). We then decided to further investigate the effect of PRMT2 knockdown in this line.
To identify PRMT2-dependent gene expression, we examined the effect of PRMT2 depletion in MCF-7 cells using siRNA coupled with an Illumina microarray analysis with the universal HumanHT-12_V4 BeadChip. MCF-7 cells were transfected with two PRMT2-siRNAs and a control-siRNA for 48 hours (Supplemental Figure 1B). We confirmed that PRMT2-siRNA-1 specifically reduced both the mRNA level and the protein level of PRMT2 in MCF-7 cells (Figure 1, B and C). PRMT2 has been found to produce at least eight isoforms (National Center for Biotechnology Information database), and we observed that PRMT2-siRNA-1 significantly attenuates the expression of all 8 isoforms (Figure 1D). After the percentile shift normalization with the GeneSpring software, microarray analysis revealed that more than 1200 genes were significantly differentially expressed (>2-fold change, P < .05) (Figure 2A). The top 10 up- and down-regulated genes were listed with fold changes and adjusted p value after multiple correction testing (Figure 2, B and C). Comprehensive Ingenuity pathway analysis revealed that PRMT2-dependent genes are involved in several functions and cellular pathways including cell-cycle control, DNA replication/repair, and carcinogenesis (Figure 2, D and E). The Ingenuity analysis suggested that PRMT2-dependent gene expression was a critical component of cell-cycle regulation and predicted the cell-cycle regulators including cyclin D1 (CCND1), TP53 (p53), and CDKN1A (p21) as important upstream regulators (Figure 2F). The ingenuity analysis indicated CCND1/cyclin D1 pathway was inhibited, and the CDKN1A/p21 was activated (Figure 2F). We proceeded to validate the relative expression of the mRNAs encoding p53, p21, and cyclin D1 by RT-qPCR. We observed no significant change in p53 expression (Figure 2G). However, we identified significantly increased p21 mRNA levels and p21 protein expression (∼2-fold) in PRMT2 knockdown MCF-7 cells, respectively (Figure 2, H and I).
Figure 2.

PRMT2-dependent gene expression regulates multiple pathways involved in breast cancer. A, The volcano plot represents the magnitude of differential gene expression between control-siRNA transfected cells and PRMT2-siRNA-1 transfected cells (n = 4). Red indicates differentially expressed genes in a significant manner (P < .05). Top 10 up-regulated (B) or down-regulated (C) genes were presented with fold change and adjusted P value. Ingenuity analysis of Illumina microarray data after PRMT2 knockdown, showing the top ten functional (D) and canonical (E) pathways. F, Ingenuity analysis predicted top upstream regulators based on PRMT2-dependent gene expression changes. G and H, Real-time quantification of p53 and p21 in the control transfection and PRMT2 knockdown. RPLP0 endogenous control was used for normalization. Data are presented as the mean (SEM) of six transfected cultures. I, Western blot analysis shows p21 and GAPDH in MCF-7 cells after transfection with control-siRNA or PRMT2-siRNA-1 for 72 hours. Quantification of p21 protein expression from Western blot (n = 5). J, p21 expression was measured in T47D and MDA231 cells after control-siRNA or PRMT2-siRNA-1 transfected. RPLP0 was used for normalization. Data are presented as the mean (SEM) of six transfected cultures. K, p21 expression in IDC (n = 10) compared with normal breast tissues (n = 12). IDC samples separated into ER+ve (n = 4) and ER−ve (n = 6) subgroups were compared with normal breast tissues (n = 12). IPO8 endogenous control was used for normalization. L, Real-time quantification of PRMT2 and CCND1 from TLDA. Data are presented as the mean (SEM) of three transfected cultures. RPLP0 and HPRT1 were used for normalization. M, CCND1 mRNA was measured in control siRNA or PRMT2 siRNA-1 transfected T47D and MDA231 cells. Data are shown as the mean (SEM) of four transfected cultures. N, PRMT2 mRNA expression was measured by RT-qPCR in pCM5 or pCM5-PRMT2-transfected MCF7 and MDA231 cells. Data are presented as the mean (SEM) of four experiments. RPLP0 was used for normalization. O, CCND1 mRNA expression was measured by RT-qPCR in pCM5 or pCM5-PRMT2 transfected MCF7 and MDA231 cells. Data are presented as the mean (SEM) of four experiments.
Moreover, we examined the effect of PRMT2 depletion in another two well-characterized cell lines, T47D (ER+ve) and MDA231 (ER−ve) cells (Supplemental Figure 1C), and we observed that PRMT2 depletion in these two additional breast cancer cell lines produced significant increases in p21 mRNA expression (Figure 2J). Furthermore, to corroborate the effects of PRMT2 depletion, we evaluated three additional PRMT2 siRNAs [denoted as PRMT2 siRNA-3–5, stealth siRNAs (set of three: HSS142546, 142548, and 179372)] to confirm that these are not off-target effects. We observed only one of these stealth siRNAs (PRMT2-siRNA-3) weakly attenuated PRMT2 expression in MCF-7 cells (Supplemental Figure 1D) and similarly attenuated PRMT2 expression in (ER−ve) MDA231 cells (Supplemental Figure 1E). PRMT2-siRNA-3 depletion of PRMT2 also resulted in the significant increase in p21 mRNA expression in MCF-7 and MDA231 cells (Supplemental Figure 1F). In concordance, p21 mRNA was significantly increased as follows: 1) in the human IDC (n = 10) relative to normal breast (n = 12), 2) in ER+ve (n = 4), and 3) ER−ve (n = 6) human breast cancer tissues (Figure 2K).
Finally, we observed that CCND1/cyclin D1 mRNA expression was significantly decreased in MCF-7, T47D, and MDA231 cells after PRMT2 depletion, respectively (Figure 2, L and M). Furthermore, overexpression of PRMT2 in MCF-7 and (ER−ve) MDA231 cells, respectively (Figure 2, N and O) revealed increased expression of the mRNA encoding CCND1/cyclinD1. These data suggest that PRMT2-dependent gene expression plays an important role in the control of p21, and cyclinD1 mRNA expression and cell-cycle regulation in breast cancer cells and human breast cancer cohorts.
PPI network analysis identifies an interconnected network of genes involved in the kinetochore and DNA repair
We next wanted to determine whether the identified PRMT2-modulated genes formed interconnected subnetworks of genes having defined biological functions. To do so, we implemented a fast heuristic search algorithm capable of identifying significant gene subnetworks within a larger PPI network, in this case the human interactome (25). Using an FDR of 0.01, we identified a significant subnetwork comprising 499 genes (nodes) and 5517 connections (edges) between genes. Within this subnetwork of genes, we identified a set of highly interconnected PRMT2 down-regulated genes that are core members of the kinetochore and DNA repair pathways (Figure 3A) (26, 27). Moreover, we validated the differential expression of several critical genes (ABL1, AURKB, BRCA1, CCNB1, CDK1, and SKP2) involved in the kinetochore and DNA repair by RT-qPCR (Figure 3B). These pathways are commonly deregulated in cancer and are associated with chromosome instability and more aggressive forms of breast cancer.
Figure 3.

Protein-protein interaction diagram of PRMT2-dependent genes depicting the identified optimal scoring subnetwork. A, The complete network is shown in the upper left section of Figure 3. A magnified portion of the subnetwork showing key functional interactions between gene members of the kinetochore and DNA repair pathways is also shown. PRMT2 mediated differential expression is designated by node coloring (red indicates up-regulation in PRMT2 knockdown cells, whereas blue indicates down-regulation in PRMT2 knockdown cells). The legend provides a map between node coloring and log fold change of expression. B, MCF-7 cells were transfected with control siRNA or PRMT2 siRNA-1 for 48h (n = 6). RNA was harvested and analyzed by TaqMan RT-qPCR to detect expression of ABL1, AURKB, BRCA1, CCNB1, CDK1, and SKP2. Results are shown as relative expression levels that were normalized to RPLP0. Data are presented as the mean (SEM) of six transfected cultures. Significance was calculated using a two-way ANOVA with Tukey's multiple comparison test.
PRMT2 expression regulates the expression of the nuclear receptors (NRs), liver receptor homolog-1 (LRH-1) and RORγ and affects breast cancer cell migration: PRMT2 and RORγ are inversely correlated in breast cancer
Gene expression profiling of the NR superfamily in PRMT2 depleted MCF-7 cells revealed the striking increase in the expression of the mRNA encoding RORγ, which also appeared in the top up-regulated gene list from the microarray data (see Figure 2B). We subsequently evaluated and extracted the expression of the entire NR superfamily from the microarray data. Figure 4A demonstrates that attenuation of PRMT2 expression significantly influences the expression of the several mRNAs encoding NR (P < .05). Interestingly, RORγ and LRH-1 are highly up- and down-regulated (∼10 fold) by PRMT2 knockdown, respectively (Figure 4A). We further validated PRMT2-dependent NR mRNA expression on the ABI human NR TLDAs (n = 6) including 16 internal control genes to measure the expression of all 48 NRs by RT-qPCR (19). Differential expression of the NR, in PRMT2-siRNA-1 transfected MCF-7 cells relative to control-siRNA transfected cells, were analyzed and normalized against the StatMiner-geNorm-nominated most stable controls that displayed the minimum expression variation (UBC, GAPDH, and GUSB). The TLDA analysis revealed that several NRs (NURR1, NOR1, LRH-1, PPARA, RORγ, THRA, and VDR) were differentially expressed in a significant manner after PRMT2 depletion relative to controls (Figure 4B and Supplemental Figure 2). Importantly, the increase and decrease in RORγ and LRH-1 mRNA expression, respectively, were validated by TLDA (Figure 4B). Furthermore, the increase of RORγ mRNA expression in PRMT2-depleted MCF-7 cells was additionally confirmed by manual TaqMan RT-qPCR analysis (Figure 4C). We observed that PRMT2-siRNA-3 transfected MCF-7 cells did not produce an increase in RORγ mRNA expression. However, this siRNA targeted only PRMT2 isoforms 1 and 2 (Supplemental Figure 3A) in contrast to PRMT2-siRNA-1, which decreased all PRMT2 isoforms.
Figure 4.

PRMT2 expression regulates the expression of the NRs, LRH-1 and RORγ and affects breast cancer cell migration. A, Fold changes of nuclear receptors were presented in log10 scale from microarray data (P < .05). B, TLDA was used for relative quantification of nuclear receptors (n = 6). Benjamini-Hochberg multiple testing correction was conducted with Integromics Statminer software package. For normalization, selected geNorm controls (GAPDH, GUSB, and UBC) were used. Fold changes of nuclear receptors were presented in log10 scale from TLDA (P < .05). Relative gene expression level was determined for total RORγ (C) and RORγ1 (D) using Taqman gene expression assay (Applied Biosystems) normalized to RPLP0. Data are presented as the mean (SEM) of six transfected cultures. E, Wound-healing assay was performed at 0, 24, and 48 hours after wound initiation with ×4 magnification. F, Percentage of migration was quantified relative to 0 hour time point. Significance was calculated using a two-way ANOVA with Tukey's multiple comparison test. G, An inverse correlation between PRMT2 and RORγ expression. Scatter plot of PRMT2 and RORγ expression pattern in MAINZ breast cancer data set. A linear regression line was presented in red color. The coefficient of correlation (R) was calculated using the cor.test function of the stats package.
Finally, there are two isoforms (RORγ1 and RORγ2) that are produced from the RORγ gene. The NR, RORγ1 (also referred to as RORγ and widely expressed), is a DNA-binding factor and critical regulator of multiple biological processes including metabolism and circadian rhythms, whereas RORγ2 (also known as RORγt and exclusively expressed in thymus) is essential for the differentiation of Th17 cells, lymph node organogenesis, and development of Peyer's patches. Isoform-specific qPCR analysis revealed that PRMT2 depletion selectively increased RORγ1 and not RORγ2 mRNA expression (Figure 4D).
LRH-1 expression has been shown to be involved in breast cancer metastasis and mobility (40). Moreover, RORγ expression has been demonstrated to be negatively correlated with metastasis in human breast cancer (33). Accordingly, we proceeded to examine whether attenuation of PRMT2 expression affects breast cancer cell migration. Wound-healing assays demonstrated decreased migration in PRMT2-depleted MCF-7 cells (Figure 4, E and F). We also observed that the overexpression of PRMT2 in a cell line expressing lower levels of PRMT2, MDA231 cells, increased cell migration (Supplemental Figure 3C). This suggests PRMT2 plays a role in breast cancer.
We then examined the correlation between RORγ and PRMT2 mRNA expression in more than 50 breast cancer cell lines. The expression pattern of PRMT2 and RORγ was presented in the heat map using the publicly available microarray data of breast cancer cell lines (Supplemental Figure 3D) (16). Subsequently, scatter plot analysis in the MAINZ (20) breast cancer dataset (n = 200) demonstrated an inverse correlation between PRMT2 and RORγ expression exists in the ER+ve patients but not in the ER−ve subgroup (Figure 4G). We also found an inverse correlation in the ER+ve subgroup of the UNT (17) cohort in a consistent manner (Supplemental Figure 3E), indicating that PRMT2 expression negatively correlates with RORγ expression.
Increased RORγ expression increases DMFS in breast cancer patients
To further assess the effect of RORγ expression on the clinical outcome of metastatic breast cancer patients, we used a K-M survival analysis. Interestingly, our wound-healing assay demonstrated that PRMT2 depletion correlated with decreased migration. These observations and analysis were consistent with further K-M survival analysis that revealed high RORγ expression increases the probability of DMFS in the data set from Gene Expression Omnibus (GEO), European Genome Archive (EGA), The Cancer Genome Atlas (TCGA) databases (41, 42) (Figure 5A). We also found that the high RORγ expression is related to the higher probability of survival of metastatic breast cancer patients in the MAINZ (20) data sets (Figure 5B) and UNC (28) metastatic breast cancer data set (Figure 5C). This indicates that RORγ expression inversely correlated with PRMT2 expression is significantly associated with DMFS. Furthermore, HR analysis [using use 95% confidence intervals and Cox regression (proportional hazard) models in R] of PRMT2 and RORγ expression on five independent breast cancer data sets were calculated and presented on a forest plot (Figure 5, D and E). These data support that higher PRMT2 expression decreases the probability of DMFS in breast cancer patients. However, elevated RORγ expression improves the probability of DMFS.
Figure 5.

Long-term distant metastasis-free survival outcomes of breast cancer patients based on RORγ expression. A, K-M survival analysis was generated with a survival analysis tool (23). Breast cancer patients were divided into high and low RORγ expression groups according to the median expression. A significant log rank test value of P < .001 was obtained. B and C, Patient falling in MAINZ and UNC data sets was examined with RORγ expression. Low RORγ expression group and high RORγ expression group were split according to 33% and 66% quantiles. A significant log rank test value of P < .01 was obtained. D and E, Hazard ratio (HR) of PRMT2 and RORγ in cohorts. Using the hazard.ratio function of the genefu package, individual HRs of five independent human breast cancer cohorts (NKI, MAINZ, UNT, TRANSBIG, and UPP) was computed. The HR was plotted with lower and upper 95% confidence interval (CI) in the forest plot using the odds ratio scale.
The PRMT2-dependent gene signature is significantly associated with survival outcomes in human breast cancer cohorts
K-M analysis (with a single PRMT2 probe) on the Kmplot.com web site indicated that decreased PRMT2 expression marginally (but significantly) increased the probability of DMFS (Supplemental Figure 3B). However, PRMT2 is an epigenetic coregulator that targets histones and a broad range of transcription factors/pathways; therefore, we investigated the clinical relevance of the entire PRMT2-dependent gene expression. We used the PRMT2-gene signature (ie, all the genes differentially expressed in a significant manner after PRMT2 depletion to examine DMFS outcomes using publicly available independent human breast cancer cohort data sets including NKI (21), TRANSBIG (19), and UNT (17). The PRMT2-dependent gene signature (PRMT2_Total) is significantly associated with DMFS in the breast cancer cohorts (Figure 6, A–C), ie, decreased expression of the PRMT2-dependent signature was clearly associated with improved DMFS. Furthermore, the PRMT2-dependent gene signature was separated on the basis of gain (PRMT2_UP) and loss (PRMT2_DOWN) of expression. The PRMT2_UP and PRMT2_DOWN gene signatures corresponded to the gene sets whose expression was increased and decreased, respectively, after PRMT2 depletion. Subsequently, we generated the average gene expression scores of PRMT2_UP and PRMT2_DOWN genes for individual patient breast tumor samples (22). K-M survival analysis of the NKI, TRANSBIG, and UNT cohorts underscored that the PRMT2-dependent PRMT2_DOWN (but not the PRMT2_UP) signature is significantly associated with DMFS in the breast cancer cohorts (Figure 6, D–F, vs G–I). For example, the high PRMT2_DOWN signature score (that correlated with increased expression of the PRMT2_DOWN signature set of genes) is associated with a decreased probability of DMFS. In contrast, the low PRMT2_DOWN signature score (that correlated with decreased expression of the PRMT2_DOWN signature set of genes) is associated with an increased probability of DMFS (Figure 6, D–F, vs G–I).
Figure 6.

PRMT2-dependent gene signature is associated with DMFS. A–C, K-M survival analysis of breast cancer patients was conducted in NKI, TRANSBIG, and UNT cohorts showing high and low PRMT2_Total expression average score. A significant log rank test P value was obtained. D–F, K-M survival analysis of breast cancer patients was conducted in NKI, TRANSBIG, and UNT cohorts showing high and low PRMT2_DOWN expression average score. A significant log rank test P value was obtained. G–I, K-M survival analysis was performed using PRMT2_UP signature in NKI, TRANSBIG, and UNT cohorts. No significant log rank test was obtained. J, Concordance index was computed with the PRMT2_DOWN signature in five cohorts. K, Overall concordance index was generated with the combined data set to compare present breast cancer predicting signatures (NPI, GGI, and GENIUS) against PRMT2_DOWN signature using the genefu package. Broken red line (concordance index = 0.5) indicates no predictive ability. A value of 0 or 1 indicates perfect separation of patients with survival outcomes. Overall concordance index scores were plotted with lower and upper 95% confidence interval (CI) in the forest plot.
We also evaluated the concordance index of the PRMT2_DOWN gene signature using the algorithm capable of quantifying discriminatory power of prediction (43). We compared other current signature models including NPI (23) (Supplemental Figure 4A), GGI (17) (Supplemental Figure 4B), and GENIUS (24) (Supplemental Figure 4C) against our signature in several cancer cohorts. The average concordance index found with our signature of 0.63 (Figure 6, J and K) indicates our PRMT2_DOWN gene signature has a similar discriminatory ability to predict breast cancer risk. A value of 0.5 for the concordance index indicates no predictive discrimination, whereas a value of 0 or 1 represents perfect separation of patient groups with different clinical outcomes (43).
PRMT2 has been identified to function as an ER coregulator (6). Moreover, the cell cycle in MCF-7 cells is regulated in an estrogen (E2) and ER-dependent manner; therefore, we investigated whether there was any overlap in the E2 signature in MCF-7 cells (∼800 genes) (44) and the PRMT2-dependent signatures in MCF-7 cells (∼1200 genes). We used Cytoscape to compare the two signatures and identified 139 overlapping genes (Supplemental Figure 4D). Application of the one-sided Fisher's exact test revealed a P value of 2.7e-37, indicating that the overlapping genes in the PRMT2 signature are significantly overrepresented in the E2/ER response gene signature. Interestingly, the overlap (11%–17%) in signatures involves genes in the kinetochore and DNA repair network (Supplemental Figure 4D), and in the overlapping subset of genes, the expression of the PRMT2-dependent genes was decreased, whereas most overlapping genes in the E2-dependent signature were increased in expression (Supplemental Figure 4D). Notably, greater than 80% of the genes in the PRMT2-dependent signature were distinct and unique in comparison with the E2-dependent signature in MCF-7 cells. This underscored the specific regulatory footprint of this transcriptional coregulator.
Weighted gene coexpression network analysis identifies coexpressed gene sets and transcriptional modules relevant to breast cancer survival
WGCNA provides a means of identifying modules of highly correlated genes that function as control points for developmental gene hierarchies and/or biological processes that promote distinct cellular properties or fates. To detect transcriptional circuits that are associated with PRMT2 expression and/or activity in breast cancer, we applied WGCNA to a compendium of breast cancer expression data (28, 29). This analysis identified seven major gene modules representing between 200–2000 genes per module and designated here by different module numbers 1–7 with colors: green, brown, purple, salmon, turquoise, pink, and red (Figure 7, A–C, and Supplemental Figure 5A).
Figure 7.

WGCNA revealed multiple coexpression modules in breast cancer cohorts, illustrating an inverse correlation between PRMT2 and RORγ. A, Cluster dendrogram generated by hierarchical clustering of genes on the basis of topological overlap. Modules of correlated genes were assigned colors. All unassigned genes were placed in the gray module. Pairwise correlations were calculated for each gene to PRMT2 gene expression levels, PRMT2_UP mean expression scores, PRMT2_DOWN mean expression scores, ER gene expression levels, and RORγ gene expression levels. The P value significance is shown as a colored bar and was a significant correlation (P < .05, yellow), and a significant anticorrelation (P < .05, blue) is indicated for each gene. The module7/red exhibits significant correlation to PRMT2 gene expression levels and PRMT2_DOWN mean expression scores. In contrast, the module7/red shows significant anticorrelation to the PRMT2_UP mean expression scores, ER gene expression levels, and RORγ gene expression levels. B, Heat map showing statistical significance of correlation between the identified modules and expression scores/levels. Pearson correlation and Student's asymptotic P value for correlation are provided in each cell. Dark orange represents positive correlation and azure blue represents negative correlation. C, GO terms most enriched in the identified module. D, Box plot showing relative module eigengene values for the module7/red across the intrinsic breast cancer subtypes. A Kruskal-Wallis value of P < 0.01 was observed. E, K–M estimate for patients exhibiting high module eigengene values for the module7/red (red line) vs those exhibiting low module eigengene values (black line). A significant log rank test value of P < .01 was obtained. F, Box plot showing PRMT2_DOWN signature values across the intrinsic breast cancer subtypes. A Kruskal-Wallis value of P < .01 was observed. G, K–M estimate for patients exhibiting high average expression score of PRMT2_DOWN signature values (red line) vs those exhibiting low average expression score of PRMT2_DOWN signature values (black line). A significant log rank test value of P < .01 was obtained.
To determine whether any of the modules were correlated with PRMT2 expression, we first calculated a module eigengene (ME) for each module, which is defined as the most representative gene member (ie, a weighted summary) among all genes in the module (31). We then calculated the association between PRMT2 expression and each ME (Figure 7B). This analysis classified module2/brown, module6/pink, and module7/red as having significant positive correlation with PRMT2 gene expression and module1/green as having significant anticorrelation. As detailed earlier, knockdown of PRMT2 in ER-positive MCF-7 cells is accompanied by specific PRMT2-dependent gene signature associated with clinical outcomes. To determine whether PRMT2-modulated genes are correlated with the identified modules, we separated the PRMT2-dependent gene signature on the basis of gain (PRMT2_UP) and loss (PRMT2_DOWN) of gene expression (after PRMT2 depletion) and calculated the average gene expression scores for each tumor sample. The respective scores were then used to compute the correlation of association with the MEs as before (Figure 7B). This analysis clearly demonstrated a highly significant positive correlation between the PRMT2_UP genes and module3/purple, module4/salmon and module1/green and a highly significant negative correlation with module7/red. Conversely, when considering the PRMT2_DOWN genes we observed a significant positive correlation with module7/red, module6/pink, and module2/brown and a highly significant negative correlation with module1/green. Given the interplay between PRMT2, ER, and RORγ, we performed a similar correlation analysis for ER and RORγ gene expression values. We observed significant positive associations between ER and RORγ and the module1/green and significant negative correlations between these genes and the module7/red and module6/pink (Figure 7B).
Furthermore, we conducted a gene set analysis using GO terms. Two approaches were implemented: 1) hypergeometric tests for unexpected overlap between module genes and GO terms and 2) gene set enrichment analysis to measure whether a GO term shows a concordant trend to module association (32). To perform this analysis, we used module gene sets ranked in order of module affiliation (ie, module membership ranked from 1 to −1) (Figure 7B and Supplemental Figure 5B). This ranking process determines the direction of GO term association relative to module membership (Figure 7C and Supplemental Figure 6). Significantly, we found that genes with strong module7/red membership were enriched for GO terms including cell-cycle checkpoint, G1/S transition of mitotic cell-cycle control, and DNA repair. Also of particular note, we found that module3/purple membership was significantly associated with GO terms including extracellular matrix and cell adhesion.
Cancers share common hallmarks that pertain to traits associated with metastasis and proliferation. Pan-cancer metagene signatures corresponding to these hallmarks have recently been identified (13). The first of these metagene signatures relates to the ability of cancer cells to metastasize and comprise genes that are associated with EMT. The second of these metagene signatures is associated with proliferation and chromosomal instability and comprises kinetochore-associated genes. A visual comparison of the genes comprising the EMT and CIN metagene signatures and those comprising module3/purple and module7/red suggested a significant level of overlap (Supplemental Figure 7A). To stringently examine this relationship, we calculated the correlation of association between each metagene signature expression score and the MEs. This analysis demonstrated a significant correlation between the following: 1) the MES metagene signature score and module3/purple and 2) the CIN metagene signature and module7/red (Supplemental Figure 7A).
We also assessed whether intrinsic subtype, as determined by the PAM50 and the claudin-low subtype predictors (28), was correlated with module7/red (Figure 7D), module1/green, or module3/purple (Supplemental Figure 7B). This analysis clearly demonstrated an association between module7/red, module1/green, and module3/purple module memberships and intrinsic subtype. With respect to module1/green, we observed highest module membership within the luminal A subtype. The module3/purple exhibited highest module membership within the claudin-low subtype (Supplemental Figure 7B). This subtype exhibits aggressive characteristics including expression of mesenchymal markers and low expression of genes involved in tight junctions and cell-cell adhesion (28). Module7/red shared the highest membership with the basal-like subtype, which is predominantly associated with ER, progesterone receptor, and human epidermal growth factor receptor 2 (HER2, also known as ERBB2) negativity and aggressive forms of the disease (Figure 7D, Kruskal-Wallis P < .01).
Decreased PRMT2 expression and the PRMT2_DOWN signature are strongly associated with metastasis-free survival. We therefore set out to determine whether the module7/red and module3/purple were associated with these key clinical features. In so doing, we stratified patients on the basis of their module membership and performed K-M analysis and log-rank tests based on available data (Figure 7E and Supplemental Figure 7C). The module3/purple did not show a significant association between module membership and patient survival (Supplemental Figure 7C). In contrast, module7/red membership was significantly associated with poor DMFS outcomes (Figure 7E) and elevated expression of the PRMT2_DOWN signature (see Figure 7, A and B). Examining the correlation of PRMT2_DOWN signature with intrinsic subtypes, we also demonstrated that increased expression of the PRMT2_DOWN gene signature (ie, high PRMT2_DOWN) is significantly associated with the basal-like subtype (Figure 7F, Kruskal-Wallis P < .01) and poor probability of DMFS (Figure 7G), and this is in agreement with the influence of module7/red membership on breast cancer (Figure 7, D and E). Moreover, in concordance with the previous signature and survival analysis, we established that decreased expression of the PRMT2_DOWN gene signature (ie, low PRMT2_DOWN expression of the genes reduced by PRMT2 depletion) is significantly associated with greater probability of DMFS (Figure 7G).
Finally, given that MCF7 cells are luminal breast cancer cells, we set out to determine whether the genes comprising the PRMT2-down signature are preferentially associated with either the luminal A or luminal B subtypes. We found that the average expression of genes in the PRMT2 down signature are significantly higher in luminal B tumors relative to luminal A tumors (P = 1.5e-15). In support of this finding, we also observed significantly higher module 7/red (cell cycle checkpoint, P = 6.e-28) eigengene values (a measure of module membership) in luminal B tumors relative to luminal A tumors (Supplemental Figure 7, D and E). Importantly, luminal B tumors are an aggressive form of ER-positive breast cancer and often acquire resistance to adjuvant tamoxifen therapy.
PRMT2 depletion increases the (nucleotide excision) repair of UV-induced DNA lesions and improves homologous recombination repair (of double stranded breaks)
The ingenuity, PPI interactome, and the WGCNA analysis implicated DNA repair pathways after PRMT2 depletion. Consequently, we directly tested the hypothesis that PRMT2 expression effects DNA repair. We tested the ability of PRMT2 to regulate the repair (ie, the removal of UV-induced lesions CPDs). Control-siRNA or PRMT2-siRNA-1 transfected MCF-7 cells were irradiated with 25 mJ/cm2 as described previously (36). Subsequently, genomic DNA was isolated 4 minutes, 4 hours, 24 hours, and 48 hours after the irradiation, Southwestern blotted, and probed for CPD levels using anti-CPD (TDM-2; MBL International Corp). This revealed that decreased PRMT2 expression improved the clearance of CPD damage after UV irradiation (Figure 8A), ie, PRMT2 depletion increases base/nucleotide excision repair in MCF-7 breast cancer cells.
Figure 8.
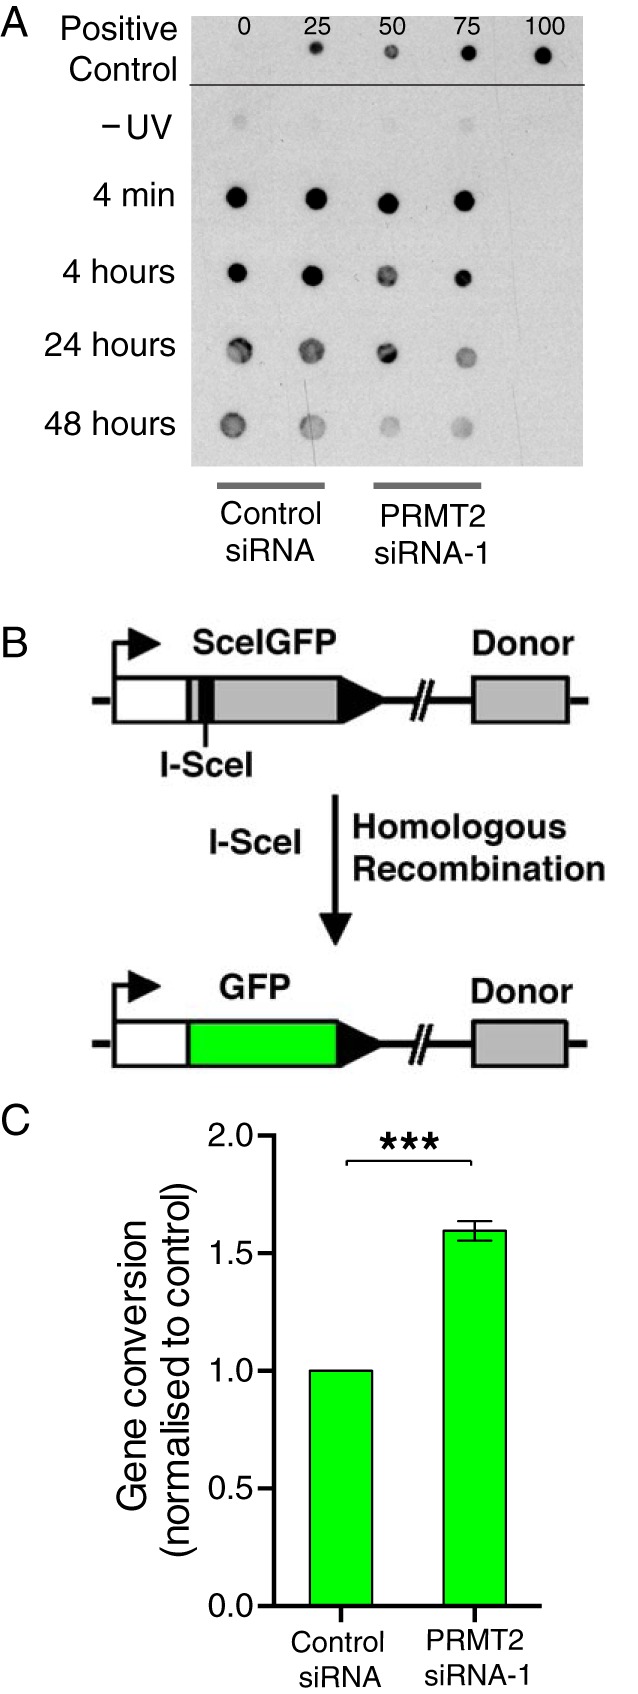
PRMT2 is involved in UV-induced DNA damage repair and homologous recombination. A, MCF-7 cells were transfected with control-siRNA or PRMT2-siRNA-1 for 24 hours. Genomic DNAs were collected at five different time points before or after UV treatment (25 mJ/cm2) and transferred to a nylon filter for Southwestern blot. Experiments were conducted twice independently in duplicate and representative data were shown. B, A schematic graph shows DR-GFP recombination reporter system. C, MCF-7 cells containing the DR-GFP plasmid were transfected with control-siRNA or PRMT2-siRNA-1 for 24 hours. Cells were transfected with the pCBAsce plasmid to generate DSB. GFP expression by homologous recombination was measured by a flow cytometry. Gene conversion was calculated by normalizing to control. The experiment was repeated three times independently.
We subsequently investigated whether PRMT2 was directly involved in the DNA repair of double-strand breaks (DSBs) by homologous recombination, a pathway often found deregulated in breast cancer disease (45–47). We used the stable MCF-7 cell line containing the DR-GFP recombination reporter system (37). These cells were transfected with the negative control (scramble) siRNA and the PRMT2-siRNA-1, and 24 hours later the cells were transfected with the vector (pCBAsce) encoding the restriction enzyme I-SceI that introduces a site-specific DSB within the upstream copy of the GFP gene (38). Flow cytometry was performed 48 hours after the second transfection. Wild-type recombinant GFP expression depends on homology-directed recombination between the DSB-containing sequence and a downstream inactive donor GFP (Figure 8B). We quantified the fraction of GFP-expressing cells and observed a reproducible approximately 2-fold increase in homologous recombination after PRMT2 depletion relative to the negative siRNA control-transfected cells (Figure 8C). These results suggested that PRMT2 depletion increases homologous recombinational DNA repair, in concordance with the nucleotide excision repair of UV DNA damage experiments.
Discussion
In this study, we used qPCR analysis, RNA interference (RNAi) analysis, expression profiling, migration assays, K-M survival, and bioinformatic analysis to elucidate the effects of PRMT2 expression in breast cancer cell lines and in several human breast cancer cohorts. Our study showed that PRMT2 was significantly decreased in human breast cancer relative to normal (pre- and postmenopausal) breast tissue. Moreover, PRMT2 depletion decreases cell migration (in vitro), is inversely correlated to RORγ expression, and PRMT2-dependent gene expression affects metastasis-free survival. WGCNA analysis of the PRMT2 signature identified a subset of PRMT2-dependent genes involved in cell-cycle checkpoint, G1/S transition of mitotic cell-cycle control, and DNA repair. Second, significantly, these circuits are correlated with pan-cancer metagene signatures associated with EMT, proliferation and CIN, and comprise kinetochore-associated genes.
To identify novel PRMT2-dependent signaling pathways after PRMT2 depletion, we examined PRMT2 expression in more than 50 breast cancer cell lines and selected MCF-7 human breast cancer cells because they abundantly express PRMT2, and have been used and characterized extensively in other studies. Transfection of PRMT2-siRNA, followed by gene expression profiling, identified 1279 PRMT2-dependent differentially expressed genes (>2-fold, P < .05). Our microarray study revealed that 654 genes were up-regulated and 625 genes were down-regulated in response to PRMT2 knockdown, indicating PRMT2 plays a significant role in both coactivation and corepression of transcription. Pathway enrichment analysis demonstrated that PRMT2 is involved in wide range of cellular programs including cell-cycle checkpoint and carcinogenesis. In addition, CCDN1 (cyclin D1), let-7 microRNA, TP53, ERBB2, and CDKN1A (p21) were predicted as top upstream regulators. Specifically, the analysis indicated the cyclinD1 pathway was inhibited, and the p21 was activated pathway. It has been shown that CCDN1 (48), let-7 microRNA (49), and ERBB2 (50) are significantly involved in breast cancer progression. For example, we observed p21 mRNA expression was increased in PRMT2 depleted MCF-7 cells, and human breast cancer cohorts, and cyclin D1 mRNA expression was decreased. It has been shown that PRMT6, genetically similar to PRMT2, negatively regulates p53 expression in mouse embryonic fibroblasts (51) and p21 expression in breast cancer (52), indicating that PRMT2 might have similar function in concordance with these recent PRMT6 studies. Very recently, Su et al (2014) demonstrated that attenuation of PRMT2 expression, suppresses the expression of cyclinD1 mRNA expression in the context of Wnt signaling (53).
PPI network analysis identified a set of highly interconnected PRMT2-dependent down-regulated genes that are core components of the kinetochore and DNA repair machinery. Changes in chromosome number (ie, aneuploidy) is driven by genetic/chromosome instability. This process is modulated by the cell-cycle checkpoint proteins, which safeguard the efficacy of mitotic chromosome separation. The checkpoint system interacts with machinery, denoted as kinetochores, which operate as a conduit for the interaction of chromosomes and microtubules during mitosis. These processes and machinery are critical in the events of carcinogenesis, and may provide a valuable mine for the unearthing of novel chemotherapeutic drugs. Our study identified many PRMT2-dependent genes involved in chromosomal instability/kinetochore and DNA repair, for example, BUB miotic checkpoint serine/threonine kinase B the mitotic spindle checkpoint proteins that modulates chromosomal instability (54), BRCA1, the DNA repair gene (55) Aurora kinase B, the microtubule-kinetochore protein (56), and KIF2C a proposed potential therapeutic target of dual therapy with epothilone compounds (ie, microtubule stabilizers) with a kinesin inhibitors (57). Importantly, these genes identified in our network are critical members of the CIN metagene signature.
The computational analysis of the PRMT2-dependent gene signature by three different approaches, IPA/ingenuity pathway anaylsis, PPI network interactome analysis, and the WGCNA analysis, all indicated that PRMT2-dependent gene expression regulated the DNA repair pathways. To empirically confirm the computational analysis, we investigated the role of PRMT2 in the (nucleotide excision) repair of UV-induced DNA lesions (ie, CPDs) and homologous recombination mediated repair of double stranded breaks (DSB). We observed an increase in nucleotide excision (of CPDs) and homologous recombination DNA mediated repair (of DSB) after PRMT2 depletion. These data are in concordance, with improved DMFS and decreased expression of the PRMT2-dependent signature. This provides rigorous data on the link between the PRMT2-dependent genetic program and the DNA repair system in breast cancer.
The depletion of PRMT2 resulted in the differential and significant expression of several NRs, including NR4A2 (NURR1), NR4A3 (NOR1), NR5A2 (LRH-1), PPARA, RORγ, THRA, and VDR. In particular, RORγ and LRH-1 were dramatically up- and down-regulated, respectively. Previously, LRH-1 has been shown to promote motility and invasion of human breast cancer cells in the context of cancer metastasis. For example, decreased LRH-1 expression resulted in low motility and weak invasiveness of MCF-7 cells. Accordingly, we hypothesize that PRMT2 may affect the motility of breast cancer cells because LRH-1 was significantly down-regulated by the depletion of PRMT2. In concordance, we observed reduced migration after PRMT2-siRNA transfection into MCF-7 cells relative to transfection of the control siRNA. This is in agreement with the K-M survival analysis that demonstrated decreased PRMT2 increases the probability of DMFS.
Recently (2013) Muscat et al (33) demonstrated a negative association between RORγ expression and histological grade in human breast cancer cohorts. Our K-M survival analysis revealed increased RORγ expression also increases the probability of DMFS in the MAINZ data sets (20) and UNC metastatic breast cancer data set (28). We also identified an inverse correlation between PRMT2 and RORγ in the human breast cancer data sets, in accordance with our result that RORγ expression was increased by PRMT2 knockdown. Furthermore, HR analysis of PRMT2 or RORγ expression in five independent breast cancer data sets suggested that PRMT2 expression decreases DMFS in breast cancer patients; in contrast, RORγ expression increases the probability of DMFS. Our results are in agreement with a recently published study in somatotroph adenomas, in which high RORγ expression is associated with tumor size reduction and low RORγ expression correlates poor clinical recovery after treatment of somatostatin analogs (58).
Identification of the PRMT2-dependent gene expression in breast cancer cells led us to investigate the clinical relevance and significance of the PRMT2 gene signature in several publicly available breast cancer cohorts. We observed decreased expression of the PRMT2-dependent signature was associated with improved DMFS. Furthermore, we observed a significantly decreased probability of DMFS in patient cohorts exhibiting high average scores (ie, increased expression) of the PRMT2_DOWN gene signature relative to the group with low PRMT2_DOWN average scores. Furthermore, concordance index analysis demonstrated that the PRMT2_DOWN gene signature (Figure 6, J and K, and Supplemental Figure 4, A–C) displayed prognostic capacity to forecast breast cancer risk.
We also identified a small but significant overlap between the E2/ER and PRMT2-dependent signatures in MCF-7 cells consistent with the role of PRMT2 as an ER coactivator (6). The overlapping genes were involved in the kinetochore and DNA repair network (Supplemental Figure 4D). This suggests that PRMT2 operates as an important coregulator in the E2/ER-dependent regulation of genes involved in DNA repair and in concordance with the role of E2/ER in DNA repair/transcriptional regulation (reviewed in reference 59). Furthermore, in the overlapping subset of genes, the expression of the PRMT2-dependent genes was reduced, whereas most overlapping genes in the E2-dependent signature (44) were induced in expression (Supplemental Figure 4D). This is consistent with the fact that we compared the E2 activation signature with the PRMT2 knockdown signature. Significantly, more than 80% of the genes in the PRMT2 dependent signature were distinctive from the E2-dependent signature in MCF-7 cells, demonstrating the broader role, unique regulatory footprint, and scope of this epigenetic coregulator in the control of gene expression in breast cancer cells.
WGCNA established a significant association between PRMT2-dependent genes and control circuits governing cell-cycle checkpoint, G1/S transition of mitotic cell-cycle control, and DNA repair. Significantly, these regulatory circuits are associated with pan-cancer metagene signatures linked with EMT and CIN (13). Specifically, we observe a significant association between the following: 1) the MES metagene signature score and the module3/purple; and 2) the CIN metagene signature and the module7/red. The module3/purple comprises several genes that are among the top 15 genes in the MES metagene signature and include COL5A2, COL1A2, SPARC, CTSK, FBN1, VCAN, AEBP1, and SERPINF1. Many of the genes in the module7/red are among the top 25 genes in the CIN metagene signature and include BRCA1, CENPA, AURKB, BIRC5, TPX2, KIF2C, CCNB2, MELK, CCNA2, KIF20A, NUSAP1, BUB1B, TTK, KIF11, and NCAPH. These kinetochore-associated genes comprise microtubule-associated proteins that regulate the mitotic spindle and key components of mitotic checkpoint signaling. Also among the genes common to the CIN metagene signature and module7/red is MKI67, which is used as a proliferation rate marker in a several cancers.
These results have important implications for understanding the role of PRMT2 in breast cancer and metastasis. We have identified more than 1200 PRMT2-dependent genes in breast cancer cells (>2-fold, P < .05), and pathway analysis revealed the involvement of PRMT2-dependent genes in important aspects of the cell-cycle control, carcinogenesis, and DNA repair. Underscoring the prominent role of NRs in breast cancer, our study has demonstrated that PRMT2 depletion influences expression of several NRs, including a striking increase of RORγ in MCF-7 cells. Furthermore, we have observed an inverse correlation between PRMT2 and RORγ expression in human breast cancer cohorts, and K-M survival analysis also revealed that increased RORγ expression improves DMFS, whereas increased PRMT2 expression results in poorer DMFS survival rates in metastatic breast cancer patients. We have also found that the breast cancer patients with high average score of PRMT2_DOWN signature exhibited decreased probability of DMFS, implicating a significant association of PRMT2-dependent genes in breast cancer survival. Furthermore, WGCNA with breast cancer cohorts uncovered seven coregulated gene clusters (modules) that are correlated with pan-cancer metagene signatures linking to EMT and CIN. This study unraveled correlated expression between PRMT2 and NR (including an inverse correlation with RORγ) within modules that are associated with pan-cancer metagenes.
Acknowledgments
T.G.O. is a University of Queensland PhD candidate. G.E.O.M., E.R.S., P.J.F., and C.L.C. are research fellows of the National Health and Medical Research Council of Australia. Prince Henry's Institute is supported by the Victorian Government's Operational Infrastructure Support Program. Human RNA used in this study from breast cancer and normal breast was provided by the Nuclear Receptor Breast Cancer Consortium, which was supported from a collaborative program grant from the National Breast Cancer Foundation Australia (2008–2013). Breast cancer and normal tissues were provided by Australian Breast Cancer Tissue Bank, which is supported by the National Health and Medical Research Council of Australia, the Cancer Institute New South Wales and the National Breast Cancer Foundation or by the Victorian Cancer BioBank Australia, which is supported by the Victorian Government. Tissues and samples were made available to researchers on a nonexclusive basis. Normal breast biopsies were obtained from the Susan G. Komen for the Cure Tissue Bank at the IU Simon Cancer Center. We thank the contributors to the Susan G. Komen for the Cure Tissue Bank, including Indiana University, which collected the samples used in this study, as well as the patients and families whose participation and help made this work possible.
Author contributions included the following: T.G.O., P.B., E.D., A.G.S., S.G., D.H.D., and G.E.O.M. participated in the project conception, design, trouble shooting, and/or interpretation of the reported experiments or results, and T.G.O., P.B., E.D., A.G.S., J.G., N.E., J.W.F., P.J.F., E.R.S., W.D.T., P.J.L., C.L.C., S.G., D.H.D., and G.E.O.M. participated in the acquisition and/or analysis of data. All authors participated in the drafting and/or editing and revising of the manuscript. G.E.O.M., P.B., E.D., A.G.S., and D.H.D. provided technical expertise and supervisory support.
This work was supported by The University of Queensland and the Cancer Council Queensland Project Grant 1071301.
Disclosure Summary: The authors have nothing to declare.
Funding Statement
This work was supported by The University of Queensland and the Cancer Council Queensland Project Grant 1071301.
Footnotes
- AURKB
- Aurora kinase B
- CCND1
- cyclin D1
- CIN
- chromosomal instability
- CPD
- cyclobutane pyrimidine dimer
- Ct
- cycle threshold
- DMFS
- distance metastasis-free survival
- DSB
- double-strand break
- E2
- estrogen
- E2F1
- E2F transcription factor 1
- EMT
- epithelial-to-mesenchymal transition
- ER
- estrogen receptor
- ER+ve
- ER positive
- ER -ve
- ER negative
- FDR
- false discovery rate
- GAPDH
- glyceraldehyde-3-phosphate dehydrogenase
- GFP
- green fluorescent protein
- GO
- gene ontology
- GUSB
- β-glucuronidase B
- HR
- hazard ratio
- IDC
- invasive ductal carcinoma
- K-M
- Kaplan-Meier
- ME
- module eigengene
- NR
- nuclear receptor
- PPI
- protein-protein interaction
- PRMT
- protein arginine N-methyltransferase
- qPCR
- quantitative PCR
- RNAi
- RNA interference
- RORγ
- retinoid-related orphan receptor-γ
- siRNA
- small interfering RNA
- TBST
- Tris-buffered saline-Tween 20
- TLDA
- TaqMan low-density array
- TO
- topological overlap
- UBC
- Ubiquitin C
- WGCNA
- weighted gene coexpression network analysis.
References
- 1. Bedford MT, Richard S. Arginine methylation: an emerging regulator of protein function. Mol Cell. 2005;18(3):263–272. [DOI] [PubMed] [Google Scholar]
- 2. Aletta JM, Hu JC. Protein arginine methylation in health and disease. Biotechnol Annu Rev. 2008;14:203–224. [DOI] [PubMed] [Google Scholar]
- 3. Yang Y, Bedford MT. Protein arginine methyltransferases and cancer. Nat Rev Cancer. 2013;13(1):37–50. [DOI] [PubMed] [Google Scholar]
- 4. Scott HS, Antonarakis SE, Lalioti MD, Rossier C, Silver PA, Henry MF. Identification and characterization of two putative human arginine methyltransferases (HRMT1L1 and HRMT1L2). Genomics. 1998;48(3):330–340. [DOI] [PubMed] [Google Scholar]
- 5. Lakowski TM, Frankel A. Kinetic analysis of human protein arginine N-methyltransferase 2: formation of monomethyl- and asymmetric dimethyl-arginine residues on histone H4. Biochem J. 2009;421(2):253–261. [DOI] [PubMed] [Google Scholar]
- 6. Qi C, Chang J, Zhu Y, Yeldandi AV, Rao SM, Zhu YJ. Identification of protein arginine methyltransferase 2 as a coactivator for estrogen receptor α. J Biol Chem. 2002;277(32):28624–28630. [DOI] [PubMed] [Google Scholar]
- 7. Meyer R, Wolf SS, Obendorf M. PRMT2, a member of the protein arginine methyltransferase family, is a coactivator of the androgen receptor. J Steroid Biochem Mol Biol. 2007;107(1–2):1–14. [DOI] [PubMed] [Google Scholar]
- 8. Iwasaki H, Kovacic JC, Olive M, et al. Disruption of protein arginine N-methyltransferase 2 regulates leptin signaling and produces leanness in vivo through loss of STAT3 methylation. Circ Res. 2010;107(8):992–1001. [DOI] [PMC free article] [PubMed] [Google Scholar]
- 9. Kzhyshkowska J, Schutt H, Liss M, et al. Heterogeneous nuclear ribonucleoprotein E1B-AP5 is methylated in its Arg-Gly-Gly (RGG) box and interacts with human arginine methyltransferase HRMT1L1. Biochem J. 2001;358(Pt 2):305–314. [DOI] [PMC free article] [PubMed] [Google Scholar]
- 10. Yoshimoto T, Boehm M, Olive M, et al. The arginine methyltransferase PRMT2 binds RB and regulates E2F function. Exp Cell Res. 2006;312(11):2040–2053. [DOI] [PubMed] [Google Scholar]
- 11. Zhong J, Cao RX, Zu XY, et al. Identification and characterization of novel spliced variants of PRMT2 in breast carcinoma. FEBS J. 2012;279(2):316–335. [DOI] [PubMed] [Google Scholar]
- 12. Zhang B, Horvath S. A general framework for weighted gene co-expression network analysis. Stat Appl Genet Mol Biol. 2005;4:Article17. [DOI] [PubMed] [Google Scholar]
- 13. Cheng WY, Ou Yang TH, Anastassiou D. Biomolecular events in cancer revealed by attractor metagenes. PLoS Comput Biol. 2013;9(2):e1002920. [DOI] [PMC free article] [PubMed] [Google Scholar]
- 14. Harrison MJ, Tang YH, Dowhan DH. Protein arginine methyltransferase 6 regulates multiple aspects of gene expression. Nucleic Acids Res. 2010;38(7):2201–2216. [DOI] [PMC free article] [PubMed] [Google Scholar]
- 15. Dowhan DH, Harrison MJ, Eriksson NA, et al. Protein arginine methyltransferase 6-dependent gene expression and splicing: association with breast cancer outcomes. Endocr Related Cancer. 2012;19(4):509–526. [DOI] [PubMed] [Google Scholar]
- 16. Neve RM, Chin K, Fridlyand J, et al. A collection of breast cancer cell lines for the study of functionally distinct cancer subtypes. Cancer Cell. 2006;10(6):515–527. [DOI] [PMC free article] [PubMed] [Google Scholar]
- 17. Sotiriou C, Wirapati P, Loi S, et al. Gene expression profiling in breast cancer: understanding the molecular basis of histologic grade to improve prognosis. J Natl Cancer Inst. 2006;98(4):262–272. [DOI] [PubMed] [Google Scholar]
- 18. Miller LD, Smeds J, George J, et al. An expression signature for p53 status in human breast cancer predicts mutation status, transcriptional effects, and patient survival. Proc Natl Acad Sci USA. 2005;102(38):13550–13555. [DOI] [PMC free article] [PubMed] [Google Scholar]
- 19. Desmedt C, Piette F, Loi S, et al. Strong time dependence of the 76-gene prognostic signature for node-negative breast cancer patients in the TRANSBIG multicenter independent validation series. Clin Cancer Res. 2007;13(11):3207–3214. [DOI] [PubMed] [Google Scholar]
- 20. Schmidt M, Böhm D, von Törne C, et al. The humoral immune system has a key prognostic impact in node-negative breast cancer. Cancer Res. 2008;68(13):5405–5413. [DOI] [PubMed] [Google Scholar]
- 21. van't Veer LJ, Dai H, Van De Vijver MJ, et al. Gene expression profiling predicts clinical outcome of breast cancer. Nature. 2002;415(6871):530–536. [DOI] [PubMed] [Google Scholar]
- 22. Schroder MS, Culhane AC, Quackenbush J, Haibe-Kains B. survcomp: an R/Bioconductor package for performance assessment and comparison of survival models. Bioinformatics. 2011;27(22):3206–3208. [DOI] [PMC free article] [PubMed] [Google Scholar]
- 23. Galea MH, Blamey RW, Elston CE, Ellis IO. The Nottingham Prognostic Index in primary breast cancer. Breast Cancer Res Treat. 1992;22(3):207–219. [DOI] [PubMed] [Google Scholar]
- 24. Haibe-Kains B, Desmedt C, Rothé F, Piccart M, Sotiriou C, Bontempi G. A fuzzy gene expression-based computational approach improves breast cancer prognostication. Genome Biol. 2010;11(2):R18. [DOI] [PMC free article] [PubMed] [Google Scholar]
- 25. Razick S, Magklaras G, Donaldson IM. iRefIndex: a consolidated protein interaction database with provenance. BMC Bioinform. 2008;9(1):405. [DOI] [PMC free article] [PubMed] [Google Scholar]
- 26. Beisser D, Klau GW, Dandekar T, Müller T, Dittrich MT. BioNet: an R-Package for the functional analysis of biological networks. Bioinformatics (Oxford, England). 2010;26(8):1129–1130. [DOI] [PubMed] [Google Scholar]
- 27. Castro MA, Wang X, Fletcher MN, Meyer KB, Markowetz F. RedeR: R/Bioconductor package for representing modular structures, nested networks and multiple levels of hierarchical associations. Genome Biol. 2012;13(4):R29. [DOI] [PMC free article] [PubMed] [Google Scholar]
- 28. Harrell JC, Prat A, Parker JS, et al. Genomic analysis identifies unique signatures predictive of brain, lung, and liver relapse. Breast Cancer Res Treat. 2012;132(2):523–535. [DOI] [PMC free article] [PubMed] [Google Scholar]
- 29. Cancer Genome Atlas Network. Comprehensive molecular portraits of human breast tumours. Nature. 2012;490(7418):61–70. [DOI] [PMC free article] [PubMed] [Google Scholar]
- 30. Langfelder P, Zhang B, Horvath S. Defining clusters from a hierarchical cluster tree: the Dynamic Tree Cut package for R. Bioinformatics (Oxford, England). 2008;24(5):719–720. [DOI] [PubMed] [Google Scholar]
- 31. Horvath S, Dong J. Geometric interpretation of gene coexpression network analysis. PLoS Comput Biol. 2008;4(8):e1000117. [DOI] [PMC free article] [PubMed] [Google Scholar]
- 32. Wang X, Terfve C, Rose JC, Markowetz F. HTSanalyzeR: an R/Bioconductor package for integrated network analysis of high-throughput screens. Bioinformatics (Oxford, England). 2011;27(6):879–880. [DOI] [PMC free article] [PubMed] [Google Scholar]
- 33. Muscat GE, Eriksson NA, Byth K, et al. Research resource: nuclear receptors as transcriptome: discriminant and prognostic value in breast cancer. Mol Endocrinol (Baltimore, Md). 2013;27(2):350–365. [DOI] [PMC free article] [PubMed] [Google Scholar]
- 34. Myers SA, Eriksson N, Burow R, Wang S-CM, Muscat GE. β-Adrenergic signaling regulates NR4A nuclear receptor and metabolic gene expression in multiple tissues. Mol Cell Endocrinol. 2009;309(1):101–108. [DOI] [PubMed] [Google Scholar]
- 35. Raichur S, Fitzsimmons R, Myers S, et al. Identification and validation of the pathways and functions regulated by the orphan nuclear receptor, ROR α1, in skeletal muscle. Nucleic Acids Res. 2010;38(13):4296–4312. [DOI] [PMC free article] [PubMed] [Google Scholar]
- 36. Smith AG, Luk N, Newton RA, Roberts DW, Sturm RA, Muscat GE. Melanocortin-1 receptor signaling markedly induces the expression of the NR4A nuclear receptor subgroup in melanocytic cells. J Biol Chem. 2008;283(18):12564–12570. [DOI] [PubMed] [Google Scholar]
- 37. Chun J, Buechelmaier ES, Powell SN. Rad51 paralog complexes BCDX2 and CX3 act at different stages in the BRCA1-BRCA2-dependent homologous recombination pathway. Mol Cell Biol. 2013;33(2):387–395. [DOI] [PMC free article] [PubMed] [Google Scholar]
- 38. Richardson C, Moynahan ME, Jasin M. Double-strand break repair by interchromosomal recombination: suppression of chromosomal translocations. Genes Dev. 1998;12(24):3831–3842. [DOI] [PMC free article] [PubMed] [Google Scholar]
- 39. Doan TB, Eriksson NA, Graham D, et al. Breast cancer prognosis predicted by nuclear receptor-coregulator networks [published online April 4, 2014]. Mol Oncol. doi:10.1016/j.molonc.2014.03.017. [DOI] [PMC free article] [PubMed] [Google Scholar]
- 40. Chand A, Herridge KA, Thompson EW, Clyne C. The orphan nuclear receptor LRH-1 promotes breast cancer motility and invasion. Endocr Related Cancer. 2010;17(4):965–975. [DOI] [PubMed] [Google Scholar]
- 41. Györffy B, Lanczky A, Eklund AC, et al. An online survival analysis tool to rapidly assess the effect of 22,277 genes on breast cancer prognosis using microarray data of 1,809 patients. Breast Cancer Res Treat. 2010;123(3):725–731. [DOI] [PubMed] [Google Scholar]
- 42. Mihály Z, Kormos M, Lánczky A, et al. A meta-analysis of gene expression-based biomarkers predicting outcome after tamoxifen treatment in breast cancer. Breast Cancer Res Treat. 2013:1–14. [DOI] [PubMed] [Google Scholar]
- 43. Harrell F, Lee KL, Mark DB. Tutorial in biostatistics multivariable prognostic models: issues in developing models, evaluating assumptions and adequacy, and measuring and reducing errors. Stat Med. 1996;15:361–387. [DOI] [PubMed] [Google Scholar]
- 44. Coser KR, Chesnes J, Hur J, Ray S, Isselbacher KJ, Shioda T. Global analysis of ligand sensitivity of estrogen inducible and suppressible genes in MCF7/BUS breast cancer cells by DNA microarray. Proc Natl Acad Sci USA. 2003;100(24):13994–13999. [DOI] [PMC free article] [PubMed] [Google Scholar]
- 45. Shivji MK, Venkitaraman AR. DNA recombination, chromosomal stability and carcinogenesis: insights into the role of BRCA2. DNA Repair. 2004;3(8–9):835–843. [DOI] [PubMed] [Google Scholar]
- 46. Powell SN, Kachnic LA. Roles of BRCA1 and BRCA2 in homologous recombination, DNA replication fidelity and the cellular response to ionizing radiation. Oncogene. 2003;22(37):5784–5791. [DOI] [PubMed] [Google Scholar]
- 47. Erkko H, Xia B, Nikkila J, et al. A recurrent mutation in PALB2 in Finnish cancer families. Nature. 2007;446(7133):316–319. [DOI] [PubMed] [Google Scholar]
- 48. Dai M, Al-Odaini AA, Fils-Aime N, et al. Cyclin D1 cooperates with p21 to regulate TGFβ-mediated breast cancer cell migration and tumor local invasion. Breast Cancer Res. 2013;15(3):R49. [DOI] [PMC free article] [PubMed] [Google Scholar]
- 49. Sun X, Qin S, Fan C, Xu C, Du N, Ren H. Let-7: a regulator of the ERα signaling pathway in human breast tumors and breast cancer stem cells. Oncology Rep. 2013;29(5):2079–2087. [DOI] [PubMed] [Google Scholar]
- 50. Weigelt B, Peterse JL, van't Veer LJ. Breast cancer metastasis: markers and models. Nat Rev Cancer. 2005;5(8):591–602. [DOI] [PubMed] [Google Scholar]
- 51. Neault M, Mallette FA, Vogel G, Michaud-Levesque J, Richard S. Ablation of PRMT6 reveals a role as a negative transcriptional regulator of the p53 tumor suppressor. Nucleic Acids Res. 2012;40(19):9513–9521. [DOI] [PMC free article] [PubMed] [Google Scholar]
- 52. Phalke S, Mzoughi S, Bezzi M, et al. p53-independent regulation of p21Waf1/Cip1 expression and senescence by PRMT6. Nucleic Acids Res. 2012;40(19):9534–9542. [DOI] [PMC free article] [PubMed] [Google Scholar]
- 53. Su X, Zhu G, Ding X, et al. Molecular basis underlying histone H3 lysine-arginine methylation pattern readout by Spin/Ssty repeats of Spindlin1. Genes Dev. 2014;28(6):622–636. [DOI] [PMC free article] [PubMed] [Google Scholar]
- 54. Musacchio A, Salmon ED. The spindle-assembly checkpoint in space and time. Nat Rev Mol Cell Biol. 2007;8(5):379–393. [DOI] [PubMed] [Google Scholar]
- 55. Moynahan ME, Chiu JW, Koller BH, Jasin M. Brca1 controls homology-directed DNA repair. Mol Cell. 1999;4(4):511–518. [DOI] [PubMed] [Google Scholar]
- 56. Nigg EA. Mitotic kinases as regulators of cell division and its checkpoints. Nat Rev Mol Cell Biol. 2001;2(1):21–32. [DOI] [PubMed] [Google Scholar]
- 57. Eschenbrenner J, Winsel S, Hammer S, et al. Evaluation of activity and combination strategies with the microtubule-targeting drug sagopilone in breast cancer cell lines. Front Oncol. 2011;1:44. [DOI] [PMC free article] [PubMed] [Google Scholar]
- 58. Lekva T, Berg JP, Heck A, et al. Attenuated RORC expression in the presence of EMT progression in somatotroph adenomas following treatment with somatostatin analogs is associated with poor clinical recovery. PloS One. 2013;8(6):e66927. [DOI] [PMC free article] [PubMed] [Google Scholar]
- 59. Schultz-Norton JR, Ziegler YS, Nardulli AM. ERα-associated protein networks. Trends Endocrinol Metab. 2011;22(4):124–129. [DOI] [PubMed] [Google Scholar]