Abstract
The application of nanomaterials to detect disease biomarkers is giving rise to ultrasensitive assays, with scientists exploiting the many advantageous physical and chemical properties of nanomaterials. The fundamental basis of such work is to link unique phenomena that arise at the nanoscale to the presence of a specific analyte biomolecule, and to modulate the intensity of such phenomena in a ratiometric fashion, in direct proportion with analyte concentration. Precise engineering of nanomaterial surfaces is of utmost importance here, as the interface between the material and the biological environment is where the key interactions occur. In this tutorial review, we discuss the use of plasmonic nanomaterials in the development of biodiagnostic tools for the detection of a large variety of biomolecular analytes, and how their plasmonic properties give rise to tunable optical characteristics and surface enhanced Raman signals. We put particular focus on studies that have explored the efficacy of the systems using physiological samples in an effort to highlight the clinical potential of such assays.
1. Introduction
Upon reduction in size of materials into the nanoscale, unique and interesting phenomena often arise that are not observed in the bulk material. Materials scientists have unveiled many such phenomena in a large variety of materials, for example quantum confinement of excitons in inorganic semiconductor nanoparticles (quantum dots), superparamagnetism in iron oxide nanoparticles (SPIONS), and localised surface plasmon resonance (LSPR) in noble metal nanoparticles. The practical application of these nanomaterials and their associated nanoscale phenomena to real world problems is an exciting task for scientists worldwide, and great progress has been made in the many associated fields of research. Since the advent of nanotechnology as a distinct discipline there has been particular excitement in regard to its application in healthcare, and revolutions in both diagnosis and treatment of disease have long been expected. However, the path from lab bench to clinic is long and fraught with pitfalls, and although a few nanomaterials have made it through, difficulties in regulation (and frankly fundamental understanding) of nanomaterials has made the translational period of these technologies rather arduous. Nevertheless, great progress has been made on the fundamental side, with countless examples of novel and high performance technologies being published every year, and the field is primed to make the transition from research interest to clinical reality.1
Diagnostic procedures are fundamental in the effective treatment of all diseases, and therefore a focus on diagnostic tools is of great importance. Whilst developments in treatment or prevention are vitally important factors in overcoming disease, without accurate and timely diagnosis life-threatening conditions can go undiagnosed, with vital time lost in pursuing treatment. For routine clinical diagnostics, immunoassays have been extensively used, with the enzyme-linked immunosorbent assay (ELISA) still proving to be the gold standard for detection of proteins in physiological samples. The ELISA principle has been frequently extended and adapted to improve its performance, and has been continually improved upon. However the technique has inherent limitations, such as the many washing steps required, which seriously limit rapidity. There has been a lot of effort to develop quantitative lateral flow devices, such as those used for pregnancy tests, for rapid point-of-care testing as an attempt to reduce time for diagnosis versus ELISA. However, in general such devices cannot compete with ELISA in terms of limits of detection (LODs). Polymerase chain reaction (PCR)-based diagnostics are excellent for nucleic acid detection, however the process is complicated, requiring for example amplification steps using primers, and is not generally suited to rapid diagnostics.
Whilst traditional diagnostic tools have been used to great effect in clinical practice, progress in fundamental biological studies of disease have been revealing a variety of new biomarkers (e.g. microRNAs) that are either too low in abundance or are not suitable for detection by traditional means. For us to achieve the ideal of molecular profiling of disease and personalised medicine, it is imperative that diagnostic technologies keep up with the discoveries being made on the fundamental side. This increased demand for molecular biomarker detection is pushing the development of ultrasensitive sensors, and it is here where new and exciting nanomaterial discoveries are finding application and showing great promise.
Various nanomaterials, including quantum dots, magnetic nanoparticles and carbon nanotubes, have been used as signal transducers in biosensing systems.2 The advantages of these systems include numerous available signalling mechanisms, strong signal intensities, finely tuneable surface chemistries and extremely large ensemble surface areas. Very small quantities of nanomaterials are required to give a strong signal, which facilitates integration into miniaturised devices, and customisable nanoparticle optical properties allow for multiple targets to be detected simultaneously. With reference to gold nanoparticles (AuNPs), their physical properties, ease of synthesis and diverse functionalisation options make them a particularly versatile platform for creating diagnostic biosensors.
Inorganic nanoparticles require surface modification to aid their colloidal stability and functionalisation, which is generally performed by capping the particles with molecules that bestow favourable properties upon them. To stop particles aggregating in solution, they can either be capped with charged molecules providing electrostatic repulsion (e.g. saturated with carboxylic acid groups that are negatively charged at physiological pH), or coated with polymers that provide steric hindrance to aggregation (e.g. polyethylene glycol, dendrimers). Such capping agents are fundamental both in the synthesis and colloidal stability of the nanoparticles. Multivalent surface structures of the nanoparticles fabricated through the conjugation with different functional groups provide an effective biointerface for specific interaction with biorelevant targets such as DNA, protein and cells. Relatively easy functionalisation routes for nanomaterials allow us to create the desired functionalities for application in clinical diagnostics. However, certain nanomaterials pose a great challenge in ensuring robust surface modification and stabilisation in biologically relevant media. Gold nanorods (GNRs) can be included in this group due to their strong lateral inter-particle dispersion interaction forces. A number of approaches have been used including covalently bound quaternary amines and physisorbed charged polymers, although a typical approach is to use thiol-terminated polyethylene glycol to form a steric layer around the particles. Ensuring this layer is densely packed is critical to facilitate effective steric stabilisation in electrolyte rich aqueous solvents such that, even upon reduction of the polymer solubility, the steric layer is sufficiently thick to prevent nanorod aggregation.
Although nanomaterials show great promise for use in diagnostics, there are some hurdles to overcome in creating nanobiosensors that work effectively in physiological conditions. The most pressing concern is that of non-specific interactions of the nanobiosensor with non-target biomolecules in the physiological solutions, where the fraction of target molecules is miniscule in relation to the other molecules present. This is a serious potential stumbling block in nanobiosensor based research, with most studies only reporting sensitive detection in pure buffers, with relatively few proof-of-principle studies in physiological conditions.
In this tutorial review, we will focus on studies that have tested their plasmonic nanobiosensor systems using physiological samples in an effort to focus on the translation of these technologies towards clinical applications. Additionally, we will be discussing the nanoscale mechanisms that facilitate sensing, rather than the instrumentation required to read the signals produced.
2. LSPR-based assays
Metal nanoparticles, such as AuNPs, show great promise for use in clinical diagnostics as they exhibit surface plasmon resonance (SPR)-related optical phenomena that can be linked to the presence or absence of target biomolecules. SPR arises due to the collective oscillation of electrons when stimulated by incident light, where the frequency of incident photons compliments the natural frequency of surface electrons oscillating against their attraction to the positive nuclei. The optical excitation of surface plasmons in metal nanoparticles leads to nanoscale spatial confinement of electromagnetic fields, or localised surface plasmon resonance (LSPR), where the local field increases to a maximum when the wavelength of the incident light matches the LSPR frequency of the nanoparticle. In plasmonic nanoparticles, this LSPR yields a pronounced absorbance peak in the visible frequency range, and strong electromagnetic fields at the particle surface that polarise the local volume around the nanoparticle. This means that interactions at the nanoparticle–solution interface affect the resonance conditions, and this is detectable as a shift in the LSPR (measured by absorption/extinction or scattering), and a colour change of the nanoparticle solution.
The SPR of spherical and well-dispersed AuNPs typically gives rise to brilliant red colour solutions. However, changing the morphology of Au nanostructures has a great effect on their photophysical properties, therefore allowing tuning of the SPR wavelength and a changing colour of the solution. In the case of gold nanorods (AuNRs), the free electrons can oscillate along both the long and short axes, yielding two plasmon wavelengths corresponding to their transverse and longitudinal directions. By changing the aspect ratio of the rods, it is possible to tune the longitudinal plasmon wavelength into the near infrared (NIR) region, which makes them amenable for use as sensors in the biological window (700–900 nm), where the absorbance of haemoglobin and water is minimal, thereby allowing optimal penetration of light through blood and tissue. Additionally, they exhibit stronger light absorption and a higher scattering cross-section in the SPR wavelength regions than AuNPs. For Au nanostars, an enhanced field is observed around the tips of their protrusions, which are easily accessible by analyte molecules, and the LSPR peak shifts to the NIR.3
2.1. Nanoparticle assembly-based assays
The optical properties of plasmonic nanoparticles are strongly dependent upon interparticle separation distances. When in close proximity, there is interparticle plasmon coupling and an associated perturbation in the LSPR band of the ensemble, leading to a red-shift in the absorbance peak. This means that when disperse particles in solution become aggregated, there is a pronounced colour shift from red to blue. It is the ability to link the aggregation state of plasmonic nanoparticles to the presence/absence of target biomolecules that has led to the creation of various assays based on colourimetric shifts.4,5 Aggregation-based LSPR shift has been widely studied for the detection and sensing of various analytes, with notable fundamental work performed by Chad Mirkin's group.6 Such systems present the possibility of simple ‘one-step’ assays with easily read colourimetric output. Additionally, they generally yield a larger LSPR shift than that seen by direct analyte capture (discussed below). However, a limitation of colourimetric detection is that the LSPR shift in generally in a region of high absorbance by native proteins in physiological fluids such as serum and plasma, therefore the ultimate sensitivity of such measurements can be limited. Other drawbacks of such systems can include relatively low sensitivity and narrow dynamic range. Nevertheless, there are some key examples of aggregation based assays that have been tested with physiological samples.
A study that has attracted considerable attention since its publication is that of Medley et al., who developed one of the original colourimetric AuNP-based aggregation assays, for the detection of cancer cells, and demonstrated its efficacy using spiked bovine serum.7 The group used AuNPs coated with oligonucleotide aptamers that were selected using the cell-SELEX methodology, in which live whole cancer cells served as the target. In solution, binding of the aptamer-conjugated AuNPs to the surface of the targets cells caused effective AuNP aggregation and a visible colour change of solution as the LSPR band red-shifted. The limit of detection (LOD) was calculated to be only 90 cells, in clean conditions. In the spiked bovine serum, the assay functioned as expected, with an increased signal at 650 nm. However, given the colour of serum, colourimetric detection was not possible, with the team suggesting that the coloured components of serum would have to be removed in a pre-processing step in order to achieve it.
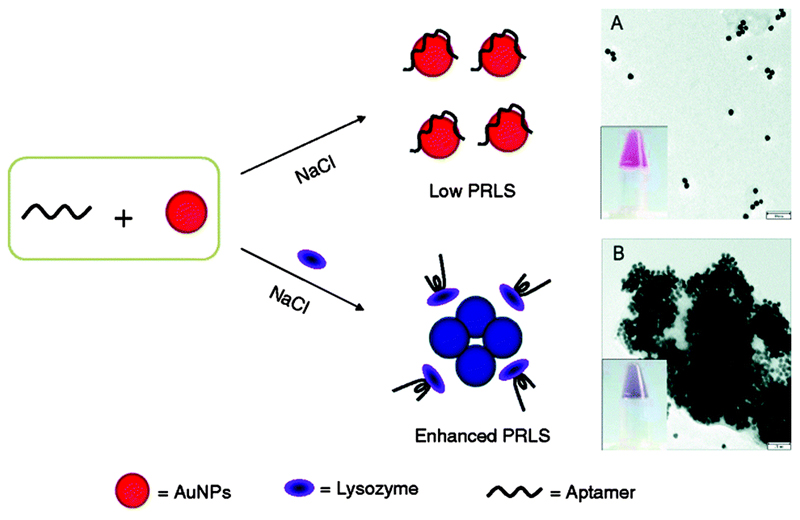
Wang et al. have developed a colourimetric AuNP-based LSPR sensor for the detection lysozyme in saliva and urine.8 Lysozyme is one of the major proteins in saliva, and is important part of the body's defence system. Increase in lysozyme abundance is related to a number of conditions, including leukaemia, tuberculosis and acute bacterial infections. In this sensor system, AuNPs were stabilised in solution by coating them with a lysozyme DNA aptamer, such that in the presence of salt they remained well dispersed in solution. However, in the presence of lysozyme, the aptamer would preferentially bind to the protein, and become desorbed from the AuNP in the process. This action destabilised the AuNPs, causing them to aggregate and the solution to undergo a colour change from red to blue (Fig. 1). For detection, the team studied the plasmon resonance light scattering (PRLS) intensity using a spectrofluorimeter to synchronously scan the excitation and emission monochromator at Δλ = 0 nm. A lysozyme concentration of 1 nM was sufficient to produce visually detectable change in solution colour, whilst the PLRS method allowed detection at 0.1 nM, in pure buffers. The group also studied simulated saliva and recovery from human urinary specimens, analysing the effect of individual potentially interfering substances. Some effect on PRLS signal was observed for several components (e.g. urea, glycosaminoglycans), although lipase and α-amylase, the primary protein constituents of saliva, did not how a significant interfering effect on the analysis of lysozyme in simulated saliva.
Fig. 1.
Aggregation of DNA aptamer-stabilised AuNPs for colourimetric sensing of lysozyme, with corresponding TEM images showing (A) dispersed and (B) aggregated AuNPs after the addition of lysozyme. Adapted from ref. 8, and reprinted with permission from Springer.
2.2. Enzyme-controlled nanoparticle growth for colourimetric sensing
Above we have discussed assays that use pre-synthesised nanomaterials, with changes in LSPR arising from interactions of those materials with each other. Dramatic shifts in the LSPR peak can be observed when there is a physical change in the nanomaterial structure, for example nucleation and growth of new particles or controlled growth of shell structures on pre-existing particles. These shifts will in general be much larger than those observed in direct analyte capture. By linking such changes in nanomaterial structure to the presence or absence of a given analyte, it is possible to create ultrasensitive diagnostics assays. The examples discussed below use the action of enzymes to bring about these structural and material changes.
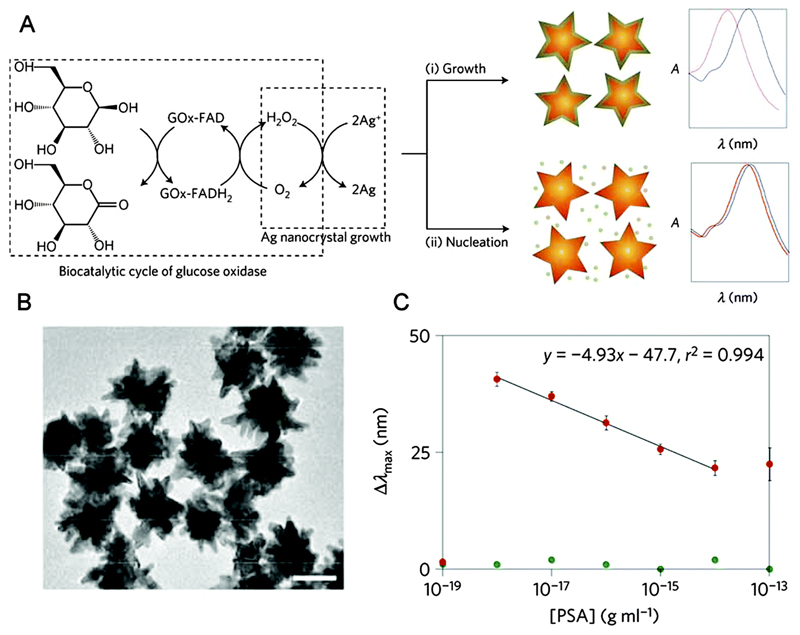
Conventional biosensors generate a signal that is directly proportional to the concentration of the analyte, therefore the lowest concentrations of analyte induce the smallest responses in signal. An assay developed in our group took the opposite approach, using a novel signal-generation mechanism where the signal is inversely proportional to the analyte concentration.9 This means that when the concentration of the target molecule is at its lowest, the signal is at its highest. The sensor was based on the growth of Ag nanostructures in the presence of Au nanostars, which acted as plasmonic nanosensors for the Ag reduction process (Fig. 2). The epitaxial growth of Ag on Au resulted in a blue shift in the LSPR of the nanostars, and it is the ability to link this growth with the abundance of analyte which allowed this system to detect disease biomarkers. The key concept was to use the enzyme glucose oxidase (GOx) to control the growth of Ag nanostructures. GOx generates hydrogen peroxide that reduces silver ions, and therefore determines the mode of crystallisation of Ag to favour either the nucleation of Ag nanoparticles in solution, or the epitaxial growth of a Ag coating around the nanostars. At low GOx concentrations, the shortage of reducing agent favoured the formation of the Ag coating, generating a large blue shift of the LSPR of the nanostars. At high GOx concentrations, independent nucleation was favoured and less Ag was deposited around the nanostars, resulting in a diminished LSPR shift. The GOx was linked to an antibody and used as a label in the style of a classic enzyme-linked immunoassay on the surface of the Au nanostar. Since the concentration of GOx was directly related to the concentration of analyte, a higher analyte concentration led to a higher GOx concentration, which favoured the formation of Ag nanoparticles and therefore a lower LSPR shift. Conversely, at lower concentrations of analyte less GOx was present and the LSPR shift was higher. This mechanism was the origin of the inverse sensitivity at the basis of this assay. The assay was used to detect prostate specific antigen (PSA), an important cancer-related biomarker, in whole serum. Detection was possible down to 10–18 g mL−1 (4 × 10⁻²⁰ M), a remarkably low limit of detection.
Fig. 2.
(A) Glucose oxidase-controlled deposition/nucleation of Ag, controlling the LSPR shift of Au nanostars. (B) TEM image of the Au nanostars (scale bar, 50 nm). (C) Dose–response curve showing inverse sensitivity, with LSPR spectral shift reducing with increasing PSA concentration in serum. Adapted from ref. 9, and reprinted with permission from Nature Publishing Group.
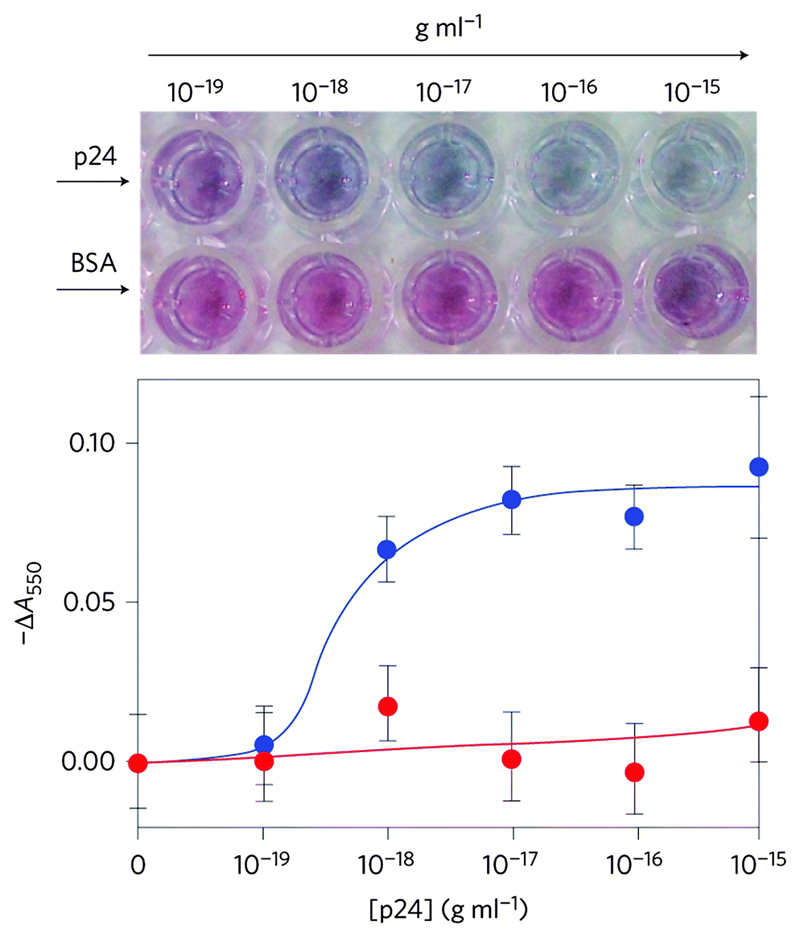
Ultrasensitive detection of analytes is usually only obtainable using sophisticated and expensive equipment and reagents. In resource limited settings, where such techniques could aid in tackling some of the most devastating conditions experienced by man, such techniques are often unavailable. To tackle this issue, our group has developed an ultrasensitive ELISA which used the plasmonic properties of AuNPs to generate a colourimetric response to ultralow concentrations of analyte, and allowed naked eye detection (Fig. 3).10 As in a standard ELISA test, the analyte molecule was captured by specific capture antibodies anchored to a disposable substrate. Once captured, subsequent washes introduced a primary antibody, then an enzyme labelled secondary antibody complex. The enzyme was catalase which catalyses the decomposition of hydrogen peroxide to water and oxygen. The AuNP precursor material (gold(III) chloride trihydrate) was added into the ELISA wells, whereupon it reacted to form nanoparticles. The concentration of hydrogen peroxide in the system affects the growth of AuNPs, with high concentrations favouring the formation of non-aggregated, spherical nanoparticles that give rise to a red solution, and low concentrations favouring the growth of polydisperse and aggregated AuNPs which appear blue in solution. Through the formation of the immunosandwich complex, the concentration of analyte was linked to growth of AuNPs in solution via the concentration of hydrogen peroxide in the system. The blue and red colours were easily distinguishable to the naked eye, which does away with the need for expensive analytical equipment to read the signal. As the system was based on immunorecognition it performed very well in physiological conditions, and detection was possible in whole serum. Prostate specific antigen (PSA) and HIV-1 capsid antigen p24 were detected in whole serum at an ultralow concentration of 10–18 g mL−1. Furthermore, the ability of the assay to detect p24 in the serum of HIV-infected patients was tested against a gold standard nucleic acid-based test. The plasmonic ELISA was actually able to detect, at a glance, HIV-positive samples that were undetectable by current standard tests. Although this assay requires various washing steps, as with any ELISA, the ultrasensitivity afforded by the plasmonic response of the AuNPs in this system is remarkable, and could open doors to clinically viable ultrasensitive assays.
Fig. 3.
Enzyme controlled AuNP nucleation and aggregation state through H2O2 evolution gives rise to a colourimetric response to HIV-1 capsid antigen p24, showing BSA as a control. Adapted from ref. 10, and reprinted with permission from Nature Publishing Group.
2.3. Refractive index shift by direct analyte interaction
Field effects due to LSPR decrease rapidly with distance from the particle surface. This gives rise to a nanoscale volume surrounding the particle in which perturbations in refractive index (RI) can be detected. If analyte molecules enter this volume, they change the local refractive index and cause a measurable shift in the LSPR of the particle. This yields an interesting method of sensitive analyte detection that can be achieved with a variety of system arrangements. The general strategy benefits from being label-free (in a large number of biological sensors, the analyte needs to be labelled before it can be detected). However, the labelling process can interfere with the analyte's natural behaviour and interactions, and increases the complexity of the assay, therefore label-free methods can have significant advantages. Label-free techniques have traditionally suffered from a lack of sensitivity due to the lack of signal amplification that would be provided by a label, however numerous advances in the field of LSPR-based biosensors have given rise to very high sensitivities.
Sensors generally feature two functional components: a recognition element to allow selective and specific binding with the target analyte, and a transducer component to provide the signalling of the capture event. The signal is provided by the plasmonic nanoparticle through its LSPR shift. Various recognition elements have been explored, including biotin–streptavidin, antibody–antigen, aptamer–protein, enzyme–peptide, toxin–receptor interactions, and nucleic acid hybridisation.
Solution-based LSPR assays. Plasmon-enabled diagnostic assays are commonly performed in the solution phase with colloidally stable plasmonic nanostructures. The advantage here is that one effectively has an extremely large surface area for sensing due to the small size of the particles, and high diffusion rates in the sample should allow for increased speed and sensitivity compared to surface-based approaches. Assays where the analyte molecule is directly captured on the nanoparticle surface tend to yield a relatively small shift in the LSPR peak, therefore it is necessary to have an absorbance spectroscopy setup to enable detection. However, such equipment does not have to be dedicated to a specific assay, and generic lab equipment such as a plate reader would be sufficient to perform a complex analysis. Below we discuss a number of assays that use dispersed plasmonic nanoparticles, specifically AuNRs for direct analyte detection.
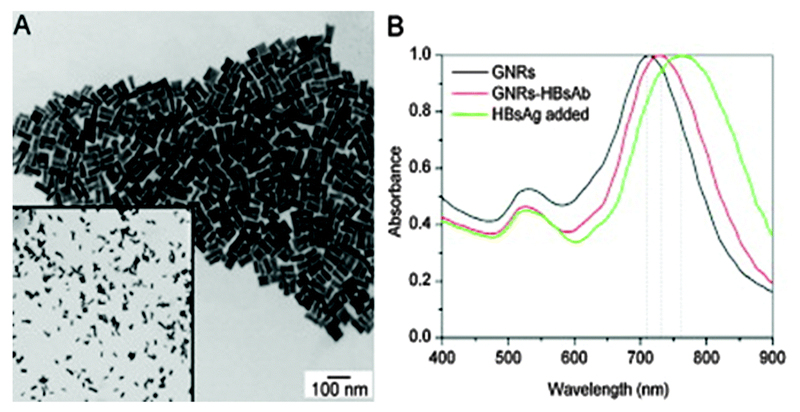
In order to perform sensing directly in physiological fluids, using techniques that require transmission of electromagnetic radiation, it is extremely beneficial to use the near-infrared region of the spectrum where light penetration is at its optimum. This means developing LSPR sensors that work in the region of ca. 700–900 nm. AuNRs possess ideal properties for this as their longitudinal resonance mode can be tuned to peak in this bioimaging region. Wang et al. used this phenomenon to develop an LSPR-based biosensor for the detection and quantification of hepatitis B surface antigen (HBsAg) in blood serum and plasma, which indicates active viral replication of hepatitis B virus (Fig. 4).11 The LSPR shift occurred in a region spanning 700–750 nm, which allowed sensitive detection in physiological solutions. The HBsAg was detected using a monoclonal antibody conjugated to the surface of AuNRs by physical adsorption, rather than in a specific manner, and the surface was blocked using BSA. An ELISA-based validation experiment was performed to directly compare the AuNR biosensor with a clinical standard tool. In pure buffers, the AuNR biosensor could measure the HBsAg concentration to an LOD of 0.01 IU mL−1, which was ca. 40 times lower than the LOD of the ELISA. Although the dynamic range and LOD was not characterised in the clinical samples that they studied, their assay was consistently able to distinguish hepatitis B positive samples from negative controls, with the positive samples exhibiting red-shifts ranging from 4.3 to 30 nm relative to a blank experiment.
Fig. 4.
(A) TEM image of AuNRs used to detect hepatitis B surface antigen (HBsAg). (B) Absorbance spectrum, showing a red shift in the spectrum on addition of the analyte. Adapted from ref. 11, and reprinted with permission from Elsevier.
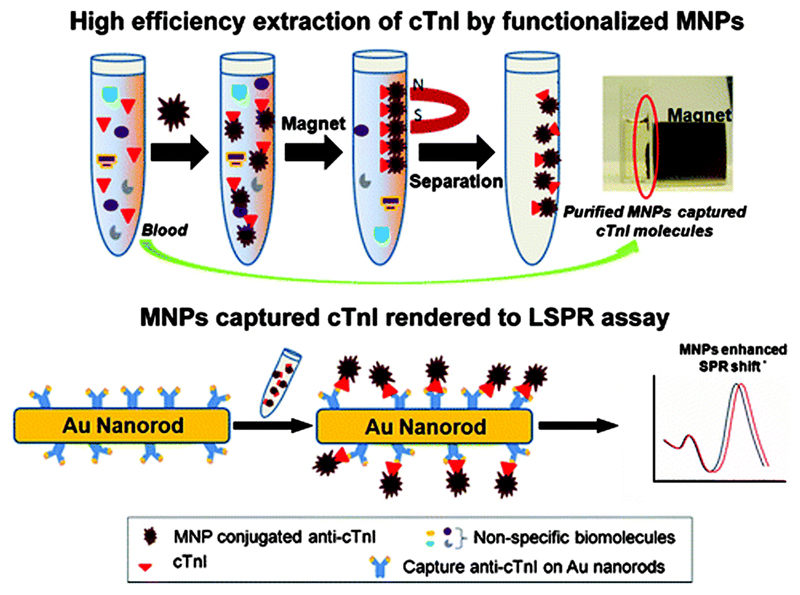
The degree of peak shift observed for direct analyte capture is strongly and proportionally dependent on the molecular weight and refractive index of the captured molecule, therefore increasing these parameters allows a way of enhancing the shift effect. Such an approach was taken by Tang et al. who developed a AuNR assay for the detection of cardiac troponin I (cTnI), an important biomarker of myocardial damage.12 Magnetic nanoparticles (MNPs, Fe3O4) were used to enhance the LSPR shift upon analyte binding (Fig. 5), as the high refractive index and mass of the iron oxide nanoparticles led to a significant perturbation of LSPR when they were in close proximity to AuNRs. Additionally, the high surface-to-volume ratio allowed a high density of chemical binding, and the magnetic properties allowed direct capture, separation and enrichment of target molecules in complex physiological conditions. In the assay, two different anti-cTnI antibodies were employed that bound to different epitopes on the cTnI molecule. One of these antibodies was conjugated to the MNPs, the other to the AuNRs. The MNPs were added to blood plasma, whereupon they bound the target cTnI, followed by magnetic separation of the cTnI. The analyte solution and AuNR solutions were then combined, and the analyte bound to the antibody on the AuNR surface, thus bringing the MNP into close proximity to the Au surface. An LOD of ca. 30 pM in blood plasma was obtained, which is three orders of magnitude lower than comparable studies. There was an average of 210% increase in the red shift by the application of Fe3O4 MNPs compared to the analyte alone, revealing the efficacy of this approach.
Fig. 5.
A schematic illustration of the bioseparation of target molecules from blood plasma using functional Fe3O4 MNPs, followed by the MNP mediated LSPR assay. The use of MNPs facilitates enhancement of the LSPR shift. Adapted from ref. 12, and reprinted with permission from The American Chemical Society.
The idea of multiplexing, where multiple analytes can be detected in a single solution, can be tackled using several types of nanomaterial-based biosensors. One such example is the use of AuNRs, as their longitudinal plasmon wavelength can be finely tuned by changing the aspect ratio of the particles. By having several different populations of AuNRs in a single solution, it is possible to link detection of specific analytes to certain particle populations, thereby allowing multiplexed detection. This approach was demonstrated by Huang et al., who developed a system to simultaneously detect S. japonicum and tuberculosis pathogens in human serum without sample pre-treatment.13 Antibodies of the different antigens were conjugated to two different populations of AuNRs by 1-ethyl-3-(3-dimethylaminopropyl)carbodiimide (EDC)-mediated coupling of amines on the antibodies to carboxylic acid groups on the AuNR surface ligand (mercaptoundecanoic acid, MUA), with detection being signified by a shift in the LSPR. The assay was conducted in a homogeneous solution-based assay, and the measurement was performed using a standard visible/NIR spectrometer setup. The AuNR-based biosensor reported here was able to distinguish between uninfected samples and positive (infected) samples in a semi-quantitative manner.
Surface-based LSPR assays. SPR is one of the most widely used technologies for the study of biomolecular interactions, and has been used in research for a number of decades. Standard SPR assays work by measuring the change in reflectivity of a planar gold surface as a function of refractive index change as molecules are selectively bound to or removed from the gold surface. In general, commercially available SPR equipment consists of a microfluidic setup to wash buffers and sample solutions over the sensing surface, an optical system that analyses surface (bio)chemical activity, and an electronic system that allows data processing. Although SPR has not traditionally been used for clinical diagnostics, there has been much research into creating new SPR-based systems that are suitable for routine clinical and point-of-care (POC) applications (see Duval and Lechuga,14 and references therein). In fact, the sensitivity of such SPR systems is typically greater than current LSPR-based systems. However, there are some inherent advantages of LSPR sensing that make it worth pursuing. Firstly, the ability to perform assays by measuring absorbance/transmission rather than reflectance makes the optics required much simpler, opening the possibility of running high sensitivity assays on standard lab equipment (e.g. a plate reader) and miniaturised optical setups. Secondly, the sensing volume is reduced in LSPR sensors compared to SPR sensors, therefore LSPR-based systems are less sensitive to bulk refractive index changes, and more specific to local refractive index changes.
For surface-based assays, it is necessary to immobilise some nanobiosensors components on a substrate. An important advantage of immobilisation is that washing steps can be performed with sequential washes over static sensor components, whereas solution-phase nanobiosensors require some sort of nanoparticle capture (e.g. magnetic) or precipitation followed by washing, which is time consuming. However, moving from solution to surface-based sensing negates the enhanced sensing surface area that arises with small particles dispersed in solution. The task of immobilisation on substrates is also non-trivial, and great care must be taken in choosing appropriate substrates that are high performance but cost-effective, with materials such as paper, polymer fibre mats, elastomers, plastics and graphene offering exciting opportunities.15 In the following text, a number of studies are reviewed where surface-based plasmonic biosensing has been performed, and we discuss the associated issues with detection in physiological conditions.
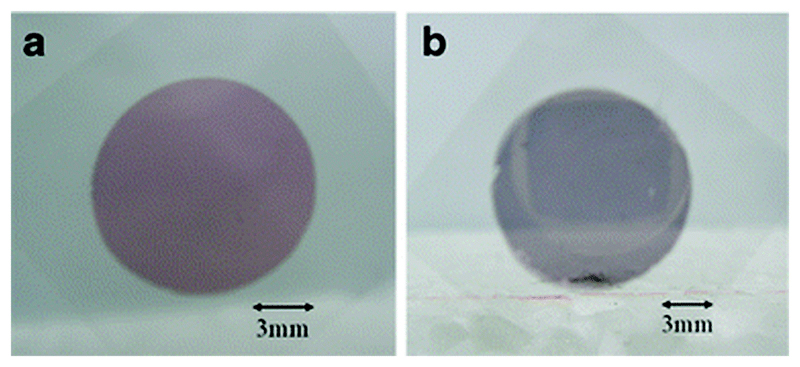
By immobilising AuNPs on a surface, it is possible to utilise some of the advantageous plasmonic properties of these particles whilst getting the benefits of surface-based sensing. Chen and Chen have done this by developing a two-layer AuNP-based LSPR substrate for the detection of analytes in serum by reading absorbance/transmission, and they have demonstrated the efficacy of their system by detecting fibrinopeptide A in human serum samples.16 Fibrinopeptide A is a phosphopeptide derived from the digestion of fibrinogen by thrombin, which plays a significant role in vertebrate blood clotting. Additionally, there is some evidence to suggest that the level of fibrinopeptide A in serum may be raised in cancer patients, therefore the ability to monitor its serum concentration could be beneficial. The team used layer-by-layer assembly of spherical AuNPs of 84 nm mean diameter onto glass slides, which yielded an LSPR absorption band at ca. 800 nm resulting from dipole–dipole interactions between the AuNPs (Fig. 6). An important point here is that this degree of tuning of the LSPR absorption band is not possible with standard flat Au sensing surfaces, but is possible using a nanostructured surface. The AuNP layer was then coated with a thin film of TiO2, which is known to be an effective way of binding phosphorylated species. Using a test sample they demonstrated a limit of detection of ca. 5 pmol with an LSPR shift of 3 nm. As a clinical validation step, the team used their system to detect phosphorylated fibrinopeptide A species in human serum samples. Its concentration in blood plasma ranges from 4.4 to 11.7 μM, with 20–30% of it becoming phosphorylated after thrombin digestion, and they proved that their system could detect the analyte in 100-fold dilutions of serum, with a wavelength shift proportional to the concentration of the serum samples.
Fig. 6.
Glass substrates with (a) one layer and (b) two layers of 84 nm AuNPs. The dual layer of AuNPs brings the LSPR peak into the NIR region of the spectrum facilitating sensing in plasma and serum. Adapted from ref. 16, and reprinted with permission from Springer.
As discussed previously, a major limiting factor in the label-free methodology is reducing the nonspecific interactions with constituents in a physiological sample in order to increase the intensity of specific response from the target analyte. Some systems will have an inherent tolerance of non-specific interference, but the ultimate LOD will usually suffer from such interactions. It is desirable to engineer surfaces so that they are actively resistant to any non-specific interactions, such that they are robust enough to be used with a variety of sample types and to achieve ultrasensitivity. There is a body of research that looks at using zwitterionic polymers to produce anti-biofouling surfaces for items such as medical implants, and this concept can be used in the protection of nanobiosensor components. For example, Yamamichi et al. developed of a “wash-free” single-step assay for quantifying antibodies in human serum based on LSPR of AuNPs that were adhered to the bottom of 96-well microtiter plates for reading by absorbance/transmission.17 After immobilisation of ca. 100 nm mean diameter AuNPs on the amine functionalised well bottom, a polyampholite polymer (composed of diallylamine hydrochloride salt and maleic acid) was coated on the NPs through static ionic interaction between its amine groups and the Au surface. The polymer also allowed immobilization of antigen groups or blocking agents through its carboxyl groups, through which human blood group A trisaccharide antigen molecules were bound to the surface. Addition of a diluted sample of human serum into the wells allowed binding of the antigen and antibody, leading to a measurable shift in the LSPR using a standard plate reader. These shifts were converted into a quantitative measurement of bound anti-A antibody using the standard response curve. The assay displayed equivalent efficacy with and without a washing step to remove the serum, showing that their methods to minimise non-specific interactions were successful. The authors emphasised two specific advantages of their system: firstly that it is a simple, single-step operation, and secondly, that it can be performed in microtiter plates which are easily able to perform high throughput sensing because the required sample is small and the operation is simple.
As noted above, the mass and refractive index of an analyte are important factors in the degree of LSPR shift observed upon direct binding, therefore for a similar refractive index a larger analyte will lead to a greater perturbation of the LSPR, and therefore a more pronounced shift. Guo and Kim took advantage of this effect for a surface-bound sensor by creating an aptamer–antigen–antibody sandwich complex, which when bound to a AuNR led to an order of magnitude improvement in the LOD for the detection of thrombin.18 This assay was analysed by measuring LSPR scattering with a darkfield microscope. A thiol-modified thrombin aptamer (5′-C6-S-S-(T)5-GGT TGG TGT GGT TGG-3′) was conjugated to the AuNR surface, then the AuNRs were immobilised on a glass chip. During the assay, running a thrombin solution over the chip would result in binding of the thrombin to the AuNR via the aptamer interaction. Next, a solution containing anti-thrombin antibodies was run over the chip, which upon binding resulted in an analyte complex of increased mass relative to the native thrombin, generating a significant LSPR shift. An important aspect of this system was its re-usability: washing the chip with high concentration of salt would disrupt the hydrogen bonds responsible for the aptamer–thrombin binding, thus the chip could be washed and reused (apparently 80 times with the variation of relative binding efficiency less than 5%). An averaged LOD of 1.6 pM was achieved after the antibody-induced signal enhancement. The reliability of this biosensor to detect thrombin in complex matrices was evaluated by the detection of samples with thrombin-spiked, undiluted human serum. A matrix effect was observed, where peak shifts were weaker due to non-specific interactions with non-target molecules. However, the LSPR enhancing effect of the aptamer–antigen–antibody complex is a promising development and could be employed in future clinically relevant biosensors, likely in conjunction with some engineering of sensor surfaces against non-specific interactions.
The successful management of viral diseases such as HIV and hepatitis B is heavily dependent upon efficient and accurate methods of pathogen detection. Inci et al. manufactured an LSPR-based sensor based on AuNP layers with the intention of developing a versatile POC system that could be employed in various settings (clinics, airports, offices etc.).19 The measurement was performed by measuring absorbance/transmission using a compact plate reader. A polystyrene substrate was employed, upon which a polylysine layer was deposited in order to functionalise the surface with amine groups, followed by an AuNP layer. The Au layer was functionalised with 11-mercaptoundecanoic acid (MUA), then with NeutrAvidin via EDC-mediated coupling. NeutrAvidin, a deglycosylated version of avidin, has a near-neutral isoelectric point (pH 6.3) which minimises non-specific interactions. Finally, the surface was prepared with biotinylated anti-gp120 polyclonal antibodies, which are able to bind multiple HIV subtypes. The surface was blocked with a 10% BSA solution, creating a final sensing surface that was resistant against nonspecific adsorption. The efficacy of this system was proved by detecting multiple HIV with high repeatability, sensitivity, and specificity, down to 98 ± 39 copies per mL, using spiked whole blood and clinical discarded HIV-infected patient whole blood samples. The fact that no sample pre-processing steps were required, (e.g. spin-down or sorting) is a vital step towards rapid POC sensing, and the total assay time was just over 1 hour. The team behind this work claim that their sensor system can be adapted to detect other pathogens having reasonably well-described biomarkers by adapting the surface chemistry.
The immobilisation of plasmonic nanostructures on surfaces provides advantages in terms of chip-integration and device development, however there are inherent disadvantages to the approach. An important study by Otte et al. demonstrated that both the attachment method and substrate composition have a very strong influence on ultimate sensitivity (Fig. 7).20 In these studies, readings of reflectance were recorded using a custom optical setup to read LSPR spectra. The transparent substrates employed in such systems have a higher refractive index than the aqueous solutions used in biosensing assays, which can have the effect of shifting the electromagnetic near-field toward the substrate, thus reducing the useable sensing volume in the sample solution. This group looked specifically at Au nanodisks on borosilicate glass, where simulations showed a drop in surface sensitivity from 4.05 nm nm−1 for a Au nanodisk free in solution, to 2.75 nm nm−1 for the surface bound nanodisk. This issue was tackled by developing suspended nanodisks, where a chemical etch technique created supported nanostructures sat atop dielectric pillars. This had the effect of exposing a larger amount of the Au surface to the environment, and of redistributing the electromagnetic field to further expose hot spots to the sensing environment. With a sufficient etch depth the nanodisks start to behave as if they were free in solution, a situation that utilises the advantages of both solution- and surface-based assays. The suspended nanodisks were tested experimentally using a DNA hybridisation assay, where 24-mer receptor probes immobilised on the surface of the nanodisks captured 32-mer single-stranded DNA sequences from solution. A sensing performance improvement of 41% was observed for the suspended versus non-suspended nanodisks, showing the efficacy of their approach.
Fig. 7.
A simulation study comparing the near-field electric field profile of Au nanodisks on a borosilicate glass substrate (RI = 1.52) in water (RI = 1.33). (A) Au nanodisks lying flat on the glass exhibit a shifted EM near-field towards the substrate, reducing the ‘hot spots’ on the exposed top surface where sensing would occur. (B) Au nanodisks supported on dielectric pillars exhibit larger exposed surface areas for sensing and increased ‘hot spots’ exposed for sensing. Adapted from ref. 20, and reprinted with permission from The American Chemical Society.
3. SERS-based assays
Surface-enhanced Raman scattering (SERS) provides a sensitive spectroscopic technique for detection of analytes at the molecular level. Raman scattering is associated with inelastic interactions between monochromatic electromagnetic radiation and a test sample.21 In this process, while most of the scattered photons conserve the energy of the incident ones (Raleigh scattering), a fraction of the photons gain energy (anti-Stokes Raman scattering) from or lose energy (Stokes Raman scattering) to the vibrational and rotational motion of the analyte molecule. The modulation of energies of these photons corresponds to the energy difference between vibrational states of the interacting molecule. These energy differences of the photons thus result in a Raman spectrum that provides the chemical ‘fingerprint’ to identify the analyte. However, the Raman signals are inherently weak due to the very small number of scattered photons (1 in 106–1010),22 which poses severe limitations on identifying analytes in low concentrations. A dramatic signal enhancement was observed by Jeanmaire and Van Duyne23 when test molecules were adsorbed onto or near a roughened noble metal (usually Au or Ag) surface, providing a new paradigm of Raman-based diagnostics. The enhancement of SERS signals is attributed to the multiplicative effects of electromagnetic and chemical enhancement mechanisms. By utilizing different nanomaterials the amplification of Raman signals can be achieved by a factor of 1010, for example with Au nanostars.24 The phenomenon of SERS has paved the way for new applications of Raman techniques.
Rapid, label-free identification is an important aspect for the detection of biorelevant targets in biological matrices. SERS is particularly well-suited for this purpose because of its high sensitivity, with potential detection limits down to single molecule, fingerprinting ability with high structural specificity, and high flexibility. In addition, the low interference from water results in minimal background signals from aqueous biological samples that enables ultrasensitive detection of bioanalytes. Another important aspect of Raman measurements is the ability to identify analytes in a wide spectral range due to the intrinsic nature of the Raman effect, unlike other spectroscopic techniques requiring a particular excitation/emission wavelength for an analyte. The SERS approach provides a particular advantage in multiplexed biosensing since the Raman peaks feature narrow spectral widths, minimising the overlap between multiple labels. Other advantages of using a single excitation source for multiple labels include resistance of SERS labels to photobleaching and lack of time-consuming sample preparation steps, making the SERS approach a versatile technique for biosensing applications.
The SERS technique has shown great promise as a diagnostic tool for medical samples, which usually have a complex biochemical composition, and are obviously aqueous. In biological conditions, nanostructured materials have demonstrated excellent potential as SERS probes that can produce a high response to very small amounts of target against the background. Efficient SERS substrates with uniform and reproducible response have been explored via both top-down approaches, involving patterned complex nanostructures on a surface, and bottom-up methods utilising chemically synthesised nanoparticles that can be assembled in suspension or onto well-defined arrays on a substrate. In particular, Au and Ag nanoparticles with tuneable plasmonics represent the most versatile source of SERS substrates. Biosensing using SERS has traditionally followed two approaches: (i) label-free intrinsic SERS, where an enhanced Raman signal from the analyte is produced in close vicinity of a nanostructured metal surface; (ii) extrinsic SERS labels/tags, where the metal surface is functionalised with Raman reporter molecules and target-specific ligands such as antibodies, and an amplified signal from the Raman reporter is obtained upon the recognition of target analyte. In this section, we will discuss some biosensing applications of these SERS approaches with an emphasis on their innovative methods using different plasmonic nanomaterials.
3.1. Biosensing using intrinsic label-free SERS
In label-free SERS detection, compact adjacency of the analyte and the metal surface is central to the signal enhancement, and hence optimisation of the surface ligands of nanomaterial surfaces plays a crucial role.
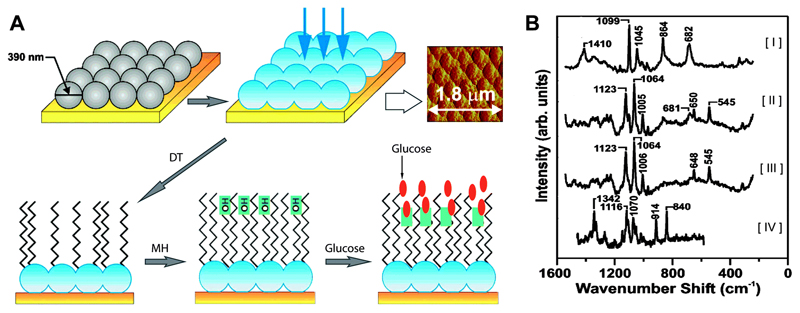
Glucose sensing. Among the many small molecule bioanalytes intrinsically detectable with SERS, glucose is an important analyte owing to its connection with diabetes mellitus. A major challenge for glucose sensing by SERS is the small normal Raman cross section and weak/no adsorption of glucose to bare SERS-active surfaces, such as roughened Ag.24 To overcome this challenge, Van Duyne's group successfully employed Ag film over nanospheres (AgFON) as the SERS substrate functionalised with a self-assembled monolayer (SAM) of 1-decanethiol (DT) (Fig. 8).25 The SAM functions as a partition layer that concentrates glucose near the AgFON surface. It is important to note that without the partition layer glucose was undetectable, but the presence of the layer enabled the detection at concentrations lower than 5 mM. By employing a chemometric analysis, quantitative detection of glucose over a large, clinically relevant concentration range was reported.
Fig. 8.
(A) AgFONs were prepared by depositing metal through a mask of self-assembled nanospheres. The AgFON was then functionalised by successive immersions in ethanolic solutions of DT and MH. Glucose is able to partition into and out of the DT/MH layer. The resulting structure is shown in the atomic force micrograph (top right). (B) SERS spectra used for quantitative detection of glucose, where the spectra represent [I] DT monolayer on AgFON substrate; [II] mixture of DT monolayer and glucose; [III] residual glucose spectrum produced by subtracting [I] from [II]; and [IV] normal Raman spectrum of crystalline glucose for comparison. Adapted from ref. 25, and reprinted with permission from The American Chemical Society.
Recently, in vivo transcutaneous glucose monitoring on rat models was developed by the same group.26,27 AgFON surfaces were functionalised with a mixed SAM of DT and 6-mercapto-1-hexanol (MH) (Fig. 8), and implanted subcutaneously in rats. The DT/MH SAM provided an amphiphilic functionality that formed hydrophilic pockets and localised the glucose molecules within the SERS-active field on the AgFON surface. The SAM also excluded interfering molecules such as serum proteins that can cause spectral congestion. The SERS probe was implanted in a subcutaneous pocket created by an incision in the skin of a rat. The glucose concentration was monitored in the interstitial fluid of six separate rats. This approach allowed the detection of glucose directly with high accuracy, especially in the low glucose concentration range as well as over a long period of time, with only a one time calibration. The sensor retained its functionality at lower glucose concentrations over 17 days after subcutaneous implantation, including 12 days under the laser safety level for human skin exposure.27 Therefore, the SERS based sensor shows great promise of reliable continuous glucose monitoring for optimal glycemic control benefiting both diabetic and ICU patients.
DNA detection. Adverse changes in a DNA sequence may cause inherited disorders, therefore the ability to detect single nucleotide polymorphism (SNP) plays an important role in disease diagnosis. Intrinsic SERS measurements provide an effective tool for single- or double-stranded DNA (ssDNA and dsDNA, respectively) oligomer detection. Label-free SERS detection of DNA generally requires a thiolated end that enables the DNA to attach onto the signal enhancing metal surface. Halas and co-workers reported the detection of thiolated DNA sequences that were bound to Au nanoshells to provide the characteristic SERS spectra, which were dominated by adenine vibrational bands at 729 cm−1 shift.28 While spectral quality and reproducibility can be critically limited by large variations in molecular conformation and/or packing density of the DNA molecules on the substrate, this study overcomes this limitation by a gentle thermal cycling pre-treatment of DNA prior to adsorption on the Au nanoshell surface. The pre-treatment promoted extended linear conformation of the ssDNA and dsDNA with a dramatic increase in the reproducibility of the SERS spectra. In addition to DNA detection, this method also enabled probing of the changes in the SERS spectrum of dsDNA upon interaction with cisplatin and transplatin, cis and trans forms of a common chemotherapy agent, providing an opportunity for SERS to contribute to pharmaceutical research. An alternative approach to thermal pre-treatment for achieving label-free, target-specific and highly sensitive SERS of DNA electrophoresis has been employed by Lee and co-workers,29 who used negatively charged plate electrodes as SERS substrates for the detection of positively charged adenine. A constant electric field was shown to produce a 51-fold amplification of signal over open circuit detection of adenine.
Detection of unthiolated DNA sequences by the label-free SERS method has been achieved by MgSO4 induced aggregation of silver nanoparticles (AgNPs).30 Short DNA sequences were non-specifically adsorbed through the nucleotide side chains onto the enhancing surface of the NPs. The aggregation inducing electrolyte (MgSO4) does not bind strongly to the Ag surface and therefore allows the DNA sequence to bind through its constituent bases. The obtained SERS spectra showed features associated with all the constituent bases. Additionally, DNA sequences with one base difference such as adenine (A) to guanine (G) and cytosine (C) to adenine polymorphisms were studied. An A to G SNP in a 25-mer DNA sequence exhibited significant changes on the SERS spectra that were reproducible. Good agreement was observed between the experimental spectral change and the model spectra generated by subtracting the poly-A spectrum from that of deoxyguanosine monophosphate (dGMP), highlighting the robustness of the method. A similar trend was observed for a single C to A polymorphism. More recently, SERS on a three-dimensional Ag nanofilm formed by dry MgSO4 aggregated AgNPs has been successfully employed to detect and differentiate between patients with colorectal cancer and healthy controls using serum RNA.31 Using SERS spectra combined with a multivariate analysis, patient RNA signature was differentiated from that of healthy subjects with 89.1% diagnostic sensitivity, and 95.6% specificity.
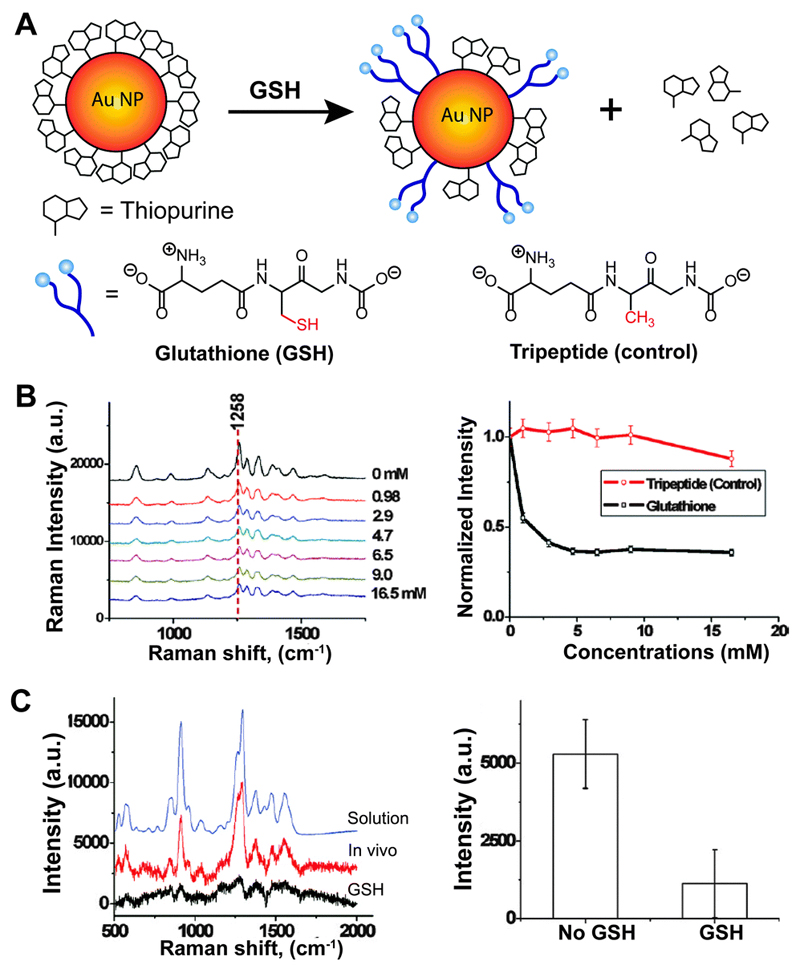
Intracellular monitoring of drug effects. An effective approach has been introduced by Ock and co-workers32 using label-free SERS and live cell imaging techniques to study the release of purine analogues, which present potential antileukemic and antineoplastic drugs for the treatment of many cancer diseases. In this study, 6-mercaptopurine (6MP) and 6-thioguanine (6TG) adsorbed on the surface of AuNPs (ca. 20 nm diameter) were displaced by an external stimulus of glutathione (GSH) and the displacement was observed by monitoring the decrease in the corresponding SERS intensities (Fig. 9A). The change in SERS intensity in aqueous suspension as a function of GSH concentration is shown in Fig. 9B. The strongest Raman band corresponding to the C–N stretching of the purine ring was used to monitor the drug release from the NP surface. A tripeptide with a methyl group instead of a thiol group was used as an inactive GSH derivative in a negative control experiment, establishing the GSH-mediated drug release mechanism. Similar results were obtained for in vitro studies with mammalian cells after injecting glutathione monoester (GSH-OEt) that boosts intracellular GSH concentration. The SERS approach was also efficient for monitoring drug release in vivo by subcutaneous injection of 6TG modified AuNPs in nude mice. The characteristic SERS band intensity of 6TG appeared to decrease upon GSH-OEt injection, whereas the control tripeptide did not show a significant influence.
Fig. 9.
(A) GSH-mediated release of thiopurines adsorbed on AuNPs. (B) GSH concentration-dependent SERS intensity of 6MP adsorbed on AuNPs suspended in water. The tripeptide control shows no change in SERS intensity of the adsorbed drug molecules. (C) In vivo SERS spectra of 6TG adsorbed on AuNPs after treatment of GSH and the corresponding stick diagram to compare with that of no GSH treatment. Adapted from ref. 32, and reprinted with permission from The American Chemical Society.
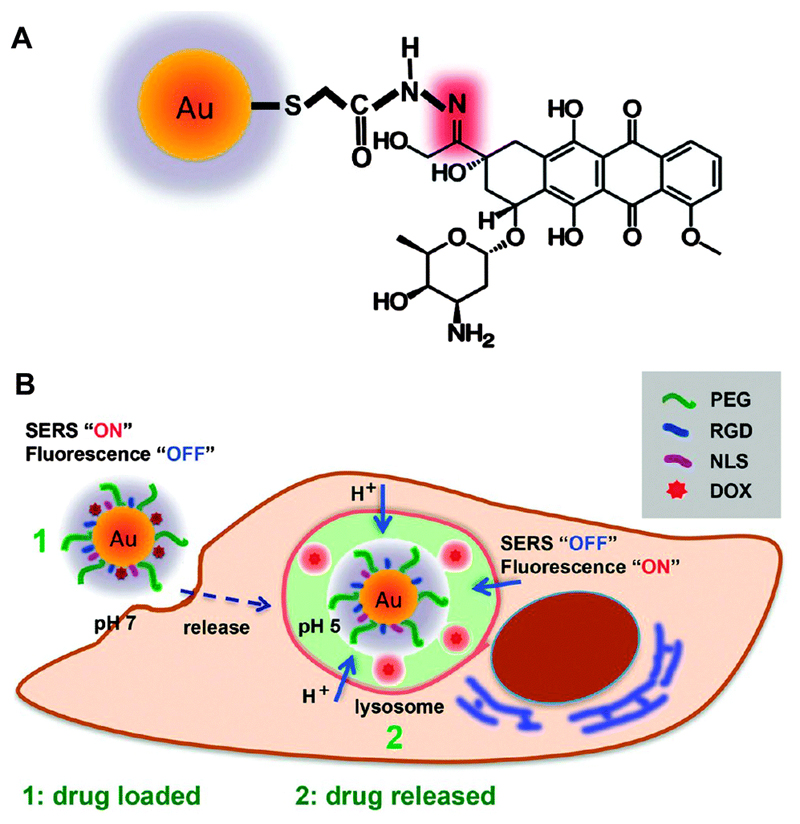
Using SERS/fluorescence imaging spectroscopy, the precise course of drug release and delivery of an anticancer drug from AuNP carriers has been investigated in real time at a single cell level.33 A pH-responsive drug delivery system was prepared through the conjugation of doxorubicin (DOX) to a AuNP surface via a pH-sensitive hydrazone linker (Fig. 10A). When DOX was bound to the surface of the AuNP, its characteristic SERS spectrum could be observed, while the fluorescence was quenched. Once the DOX-loaded AuNPs were internalised by the cells, the hydrazone bond was cleaved at the acidic pH of the lysosomes followed by the drug release (Fig. 10B). Once the DOX molecules were detached from the AuNP surface, its SERS signal was greatly reduced, changing the acquired Raman spectrum pattern and in turn allowing for the visualization of its fluorescence signal. Thus, monitoring the plasmonic enhancement of the Raman signals coupled with quenching of the fluorescence of DOX enabled the real time tracking of the drug release from the AuNP surface and its subsequent delivery into the lysosomes. Thus, intrinsic SERS provides a great platform for monitoring the controlled release of drug molecules from AuNPs in real time inside living cells when appropriate chemistries are applied.
Fig. 10.
(A) Illustration of AuNPs functionalised with the anticancer drug doxorubicin (DOX) using a pH-sensitive hydrazine linkage (highlighted in red). (B) Schematic diagram of pH-triggered drug release tracking in acidic lysosomes by monitoring the SERS spectra and fluorescence signal from the DOX molecules. Adapted from ref. 33, and reprinted with permission from The Royal Society of Chemistry.
3.2. Biosensing using extrinsic SERS labels/tags
The complex biochemical composition of biological specimens makes the interpretation of intrinsic SERS spectra challenging, making the identification of a particular biomolecular signature of interest a difficult task. To overcome these constraints, various SERS labels or nanotags have been utilised extensively in medical and bioanalytical applications, where the known signature of the tag enables the identification of the target analyte. A typical SERS label or nanotag consists of three primary components: (1) Raman reporter molecules to provide characteristic Raman signatures; (2) a plasmonic metal nanostructure to enhance the Raman signal from the reporter molecules; (3) a recognition element for the corresponding target molecule. These three components are usually integrated into a single nanoparticle entity.
DNA detection using extrinsic SERS. A common detection scheme of the extrinsic SERS approach for DNA binding events includes the functionalisation of Au or Ag NPs with a Raman reporter and a single stranded DNA. When the single strand DNA is hybridised with its complementary strand, typically bound to another Au or Ag surface, the amplified SERS signal of the reporter molecule is observed. Among many examples of DNA detection using SERS-tags, we highlight here the multiplexed detection of clinically relevant DNA targets.
A multiplexed SERS detection platform has been designed by Mirkin and co-workers using multiple Raman dye-functionalised AuNPs that were coded for specific targets.34 To obtain the Raman spectrum for each type of dye-labeled NPs, the particle probes were hybridised to glass beads that were modified with capture strands. Upon hybridisation, a Ag layer was deposited on the AuNPs to produce a highly sensitive SERS response. DNA sequences for eight pathogenic strains were labeled with the Raman dyes. Successful detection of the DNA sequences reflected the effectiveness of the composite NP probes for multiplexed parallel DNA detection. Similarly, Graham and co-workers used five different DNA sequences, each labeled with a different fluorescent dye and a AgNP.35 All the five DNA sequences were identified by eye without separation. The detection was quantitative with LODs from 10−11 to 10−12 M and without any interference from the dye labels. The linear response of all these probes at biologically relevant concentrations indicates a promising future for DNA detection with multiplex labels. In addition, the detection scheme can be generalised to any target since DNA sequence choice does not affect the SERS signal.
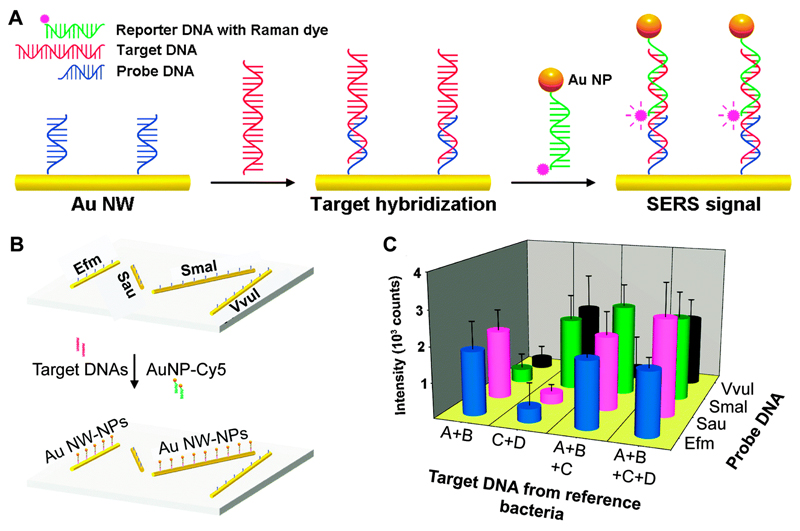
Recently, Kang et al. developed a Au particle-on-wire SERS sensor for multiplexed detection of pathogen DNA.36 It has been shown that hot spots at nanoscale gaps between a nanowire (NW) and NPs can become highly SERS-active and provide an efficient substrate SERS detection. In this work, Au nanowires (ca. 150 nm diameter) were functionalised with thiolated capture sequences and placed on a silicon wafer. AuNPs were functionalised with reporter DNA sequences and Raman dye molecules. Upon incubation of the capture sequence-coated nanowires with the target sequences, subsequent binding with the reporter DNA-functionalised Au NPs formed a particle-on-wire structure via sandwich hybridisation of probe–target–reporter sequences (Fig. 11A). Strong SERS signals from Raman dye molecules were observed only when the specific complementary target sequences bound. The high SERS enhancement factor of the Au particle-on-wire system with respect to a NW (2.6 × 10³) was noteworthy. A multiplexed pathogen DNA detection platform was fabricated by functionalising four Au nanowires with four different probe sequences followed by attaching on a single Si substrate (Fig. 11B). The particle-on-wire sensor was capable of identifying the pathogen DNA sequences correctly (Fig. 11C), indicating the great potential of the system for pathogen diagnosis.
Fig. 11.
(A) Schematic representation of the target DNA detection by Au particle-on-wire system. (B) Schematic of the patterned multiplex pathogen DNA detection using a particle-on-wire SERS sensor. Four different gold NWs were first functionalized with probe DNA corresponding to the four targets. These NWs were then hybridised with the target DNA, followed by incubation with reporter DNAs having Cy5 at 5′-termini and Au NPs at 3′-termini. Efm: Enterococcus faecium; Sau: Staphylococcus aureus; Smal: Stenotrophomonas maltophilia; Vvul: Vibrio vulnificus. (C) SERS intensities of 1580 cm−1 band (corresponding to the Raman reporter) when the sample contains two, three, and four kinds of target DNAs of which concentrations are 10−8 M each. Here, A = E. faecium; B = S. aureus; C = S. maltophilia; D = V. vulnificus. Adapted from ref. 36, and reprinted with permission from The American Chemical Society.
SERS immunoassays for protein biomarkers. A robust method for protein detection is offered by immunoassays, and multiple formats have been used for SERS-based immunoassays, including the use of Ag island films, colloids in solution, immobilised colloids, and modified colloids as probe molecules. A common format involves a sandwich assay where antibodies are first immobilised, then exposed to antigen, followed by exposure to a SERS tag that is composed of NPs conjugated with antibodies as well as probe molecules. The SERS tag is prepared by various ways, such as (i) immobilizing extrinsic Raman labels and antibodies into a shell that is coated on a AuNP core, (ii) conjugating Au-coated AgNP probe to both extrinsic Raman labels and capture antibodies, and (iii) conjugating antibodies to a AuNP using extrinsic Raman labels.
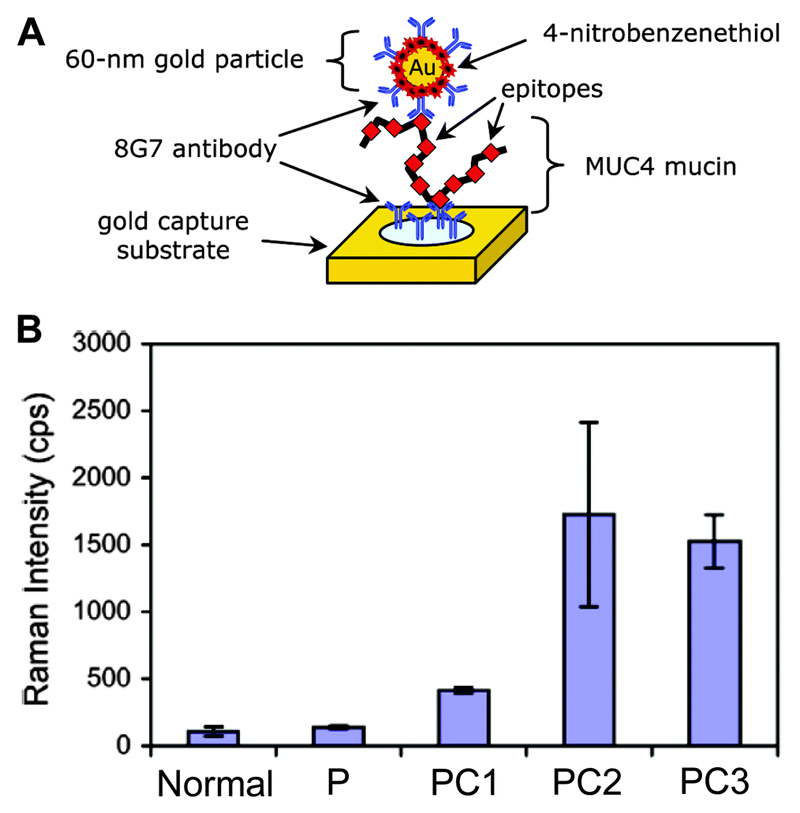
Using the sandwich assay format, hepatitis B virus surface antigen has been detected using murine monoclonal and polyclonal antibodies.37 To improve the LOD of the virus surface antigen to 0.5 mg mL−1, a silver staining step was incorporated into the immunoassay. In some cases, conventional immunoassays such as ELISA and radioimmunoassay (RIA) fail to detect the targets in physiologically relevant concentrations. Here, SERS immunoassays can provide an effective tool. For example, ELISA and RIA have been unsuccessful in the detection of mucin protein (MUC4), a promising biomarker for pancreatic cancer (PC), in serum. However, the SERS immunoassay has been successfully employed in quantitative detection of MUC4 in patient sera.38 In this study, a Au-coated glass slide was functionalised with capture antibody through coupling with dithiobis-(succinimidyl propionate) (DSP) ligands on the Au surface. Then, a SERS nanotag was prepared by first forming a mixed thiol monolayer composed of DSP and 4-nitrobenzenethiol (NBT), followed by conjugation with the detection antibody (8G7) (Fig. 12A). The fingerprint SERS spectrum of 4-NBT was used as the readout signal of the MUC4 protein in the immunoassays. After the successful quantitative detection of MUC4 in cell lysates, the SERS-immunoassays were extended to detect MUC4 in the sera of PC patients. Five sets of pooled sera samples were analysed: one from healthy individuals, one from patients with acute pancreatitis, and three from PC patients.38 The results demonstrate that sera pools from PC patients produced a significantly higher SERS response than the sera from normal individuals as well as with benign diseases (Fig. 12B). These studies show the great promise of SERS immunoassays for quantitative detection of biomarkers in biofluids for diagnostic and prognostic purposes.
Fig. 12.
(A) A schematic representation of the detection of MUC4 biomarker using a SERS nanotag. (B) SERS detection of MUC4 in pooled sera from normal individuals and patients with pancreatitis (P) or pancreatic cancer (PC1, PC2, and PC3). Each pool includes sera from 10 individuals. Adapted from ref. 38, and reprinted with permission from The American Chemical Society.
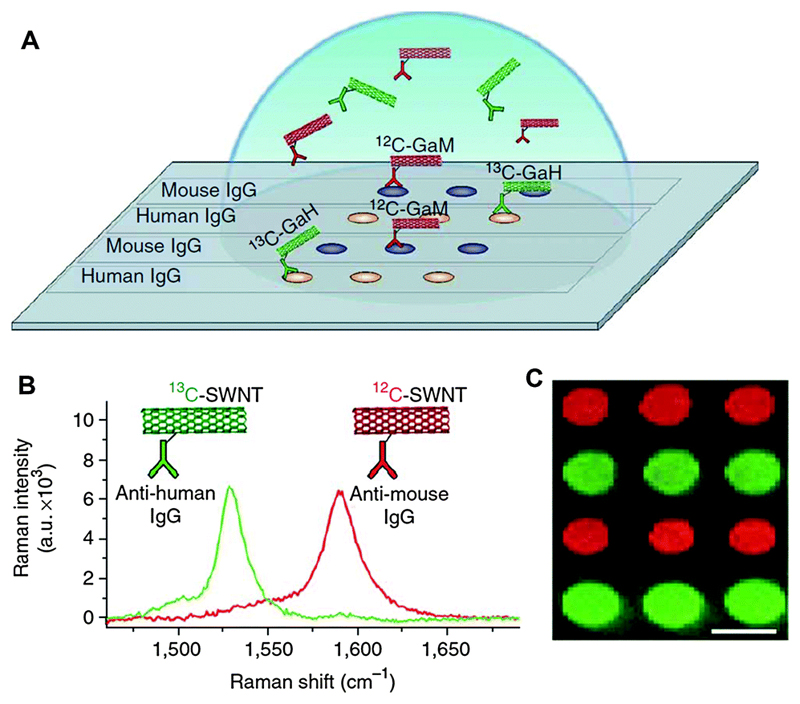
Many SERS-based immunoassays have used small Raman labels coupled to AuNPs functionalised with ligands, but the utility of the systems is often limited by the weak intensities of typical Raman labels, leading to low sensitivity. Dai and co-workers introduced a new platform for SERS-based immunoassays using functionalised, macromolecular single-walled carbon nanotubes (SWNTs) as multicolour Raman labels for achieving highly sensitive, multiplexed protein detection in a microarray format.39 They used a sandwich-assay scheme wherein an antibody from a serum sample was captured by immobilised proteins in a microarray, followed by incubation of SWNTs conjugated to goat anti-mouse antibody (GaM-IgG) that specifically bind to the capture antibody. The strong SERS signal generated by the SWNT tag enabled protein detection with an LOD of 1 fM, demonstrating great potential for extrinsic SERS detection toward sensitive protein detection. The SWNT labels were also used for multiplexed detection utilising 12C and 13C isotopic SWNTs. Through differential conjugation of minimally cross-reactive secondary antibodies, the SWNTs could detect two types of target proteins simultaneously (Fig. 13). Therefore, multicolour SWNTs provide an efficient SERS candidate with the potential of multiplexed protein and biomarker detection in the clinics.
Fig. 13.
(A) Two-layer, direct, microarray-format protein detection with distinct Raman labels based upon pure 12C and 13C SWNT tags. 12C and 13C SWNTs were conjugated to GaM and GaH-IgGs, respectively, providing specific binding to complimentary IgGs of mouse or human origin. (B) Raman scattering spectra of 12C (red) and 13C (green) SWNT Raman tags. (C) Raman scattering map of integrated 12C (red) and 13C (green) SWNT scattering above baseline, demonstrating easily resolved, multiplexed IgG detection. Adapted from ref. 39, and reprinted with permission from Nature Publishing Group.
Traditional SERS immunoassays, involving multiple incubations and washing steps, are usually time consuming and labour-intensive. Recently, a rapid and automated SERS immunoassay has been designed using optoelectrofluidics based on the electrokinetic motion of particles or fluids. In this study, polystyrene (PS) microspheres as the capture substrate were utilised for the sandwich immunoassay of alphafetoprotein (AFP).40 Immunoreaction on this substrate is significantly faster than the conventional immunoassays on solid substrates, because all the reactions occur in solution and overcome the diffusion-limited kinetics. The PS microspheres were functionalised with monoclonal AFP antibodies to capture the AFP antigens. AgNPs (40 nm diameter) were conjugated with a Raman active dye and polyclonal AFP antibody. The immunoassay was performed by mixing the functionalised PS microspheres, AgNP suspension, and the AFP solution in the sample chamber of the optoelectrofluidic device. After the sample injection, all the steps were automatically controlled, and SERS signals were recorded from the locally concentrated immunocomplexes. The assay required only 500 nL of AFP solution with a detection limit of 98 pg mL−1, and the assay required only ca. 5 minutes after sample injection.
SERS detection and imaging of mammalian cells and tissues. The use of extrinsic SERS in cellular and in vivo sensing is extensive due to the ability of extrinsic Raman labels to stand out in the background signals from a complex biological matrix and associate with specific biomolecules. Numerous studies on detection of cells and tissues in biological environments using SERS tags have brought the technology close to use in clinics.
Extrinsic SERS labels have been used to detect cancer cells in the presence of whole human blood, which can provide a useful tool for the detection of circulating tumour cells (CTC). In this study, a breast cancer cell line (SKBR3) with over-expressed HER2 receptors (human epidermal growth factor receptor) was used as a model CTC target.41 The cells were detected using a new type of SERS nanotag, comprised of one or more SERS-active AuNP and a sub-monolayer of Raman reporter molecules adsorbed to the AuNP (50 nm diameter) surface, all of which were encapsulated in a protective silica coating. The silica surface was functionalized with anti-HER2 antibodies for targeted binding to SKBR3 cells. In addition, magnetic beads were conjugated with epithelial cell-specific antibodies (epithelial cell adhesion molecule, anti-EpCAM) to specifically capture the tumour cells in the presence of other blood cells. After magnetically enriching the SKBR3 cells, the SERS studies showed a LOD of less than 10 cells per mL in buffer solution, with 99.7% confidence. Next, the cells were spiked directly into whole blood prior to the incubation with capture particles and SERS tags. The LOD of cells spiked in whole blood was ca. 50 cells per mL when the SERS spectra were recorded directly without washing or other processing steps. Notably, a low signal was observed for the background of whole blood with magnetic beads and SERS tags. However, the concentration of CTCs in blood of patients is usually <10 cells per mL. Studies should therefore be directed to further improve the sensitivity to be used in clinical diagnosis.
Apart from the studies on cells in biofluids, extrinsic SERS detection has been a robust technique for noninvasive, multiplexed molecular bioimaging in vivo. Recently, Gambhir and co-workers successfully identified ten spectrally unique SERS NPs in live animals and imaged their natural accumulation in the liver using Raman microspectroscopy.42 The same type of SERS nanotags described above with silica-coated AuNPs was used in this study. Multiplexed detection of ten nanotags containing different Raman reporter molecules was achieved when the NPs were excited with a 785 nm laser. Each SERS NP emits a unique Raman spectrum at this excitation based on the structure of the adsorbed reporter. This unique spectral fingerprint allowed identification of various combinations SERS NPs injected separately. Then, a mixture of five NPs with the most distinct spectra was injected via the tail-vein. The NPs were found to be naturally accumulated in the liver, which could be detected efficiently by the preclinical Raman microscope. Thus the ability of multiplexed detection of different SERS tags within deep tissue will allow more molecular targets to be interrogated simultaneously, thereby improving disease detection.
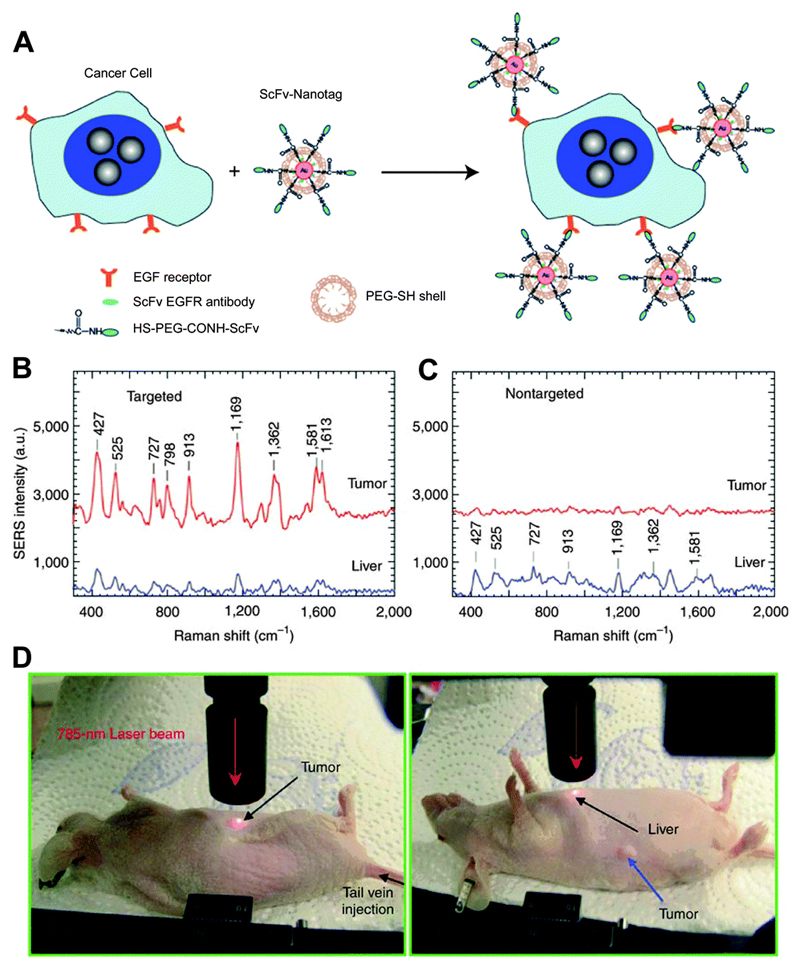
In addition to the biodistribution of nanoprobes, detection of tumours in live animals has been demonstrated by Nie and co-workers using SERS on antibody-conjugated AuNPs.43 A core size of 60–80 nm diameter of the NP was chosen to position the LSPR peaks within the ‘clear window’ (630–785 nm) where the optical absorption of water and haemoglobin is minimal. The SERS probes were prepared by modifying AuNPs using the Raman reporter 3,3′-diethylthiatricarbocyanine (DTTC) followed by stabilising with thiol-modified polyethylene glycols (PEG). These PEGylated SERS NPs were over 200 times brighter than NIR-emitting quantum dots. They could measure SERS spectra at targeted tumour sites up to 2 cm below skin. Single-chain variable fragment (ScFv) antibodies were conjugated to the PEG-NPs through hetero-functional PEG (HS-PEG-COOH) (Fig. 14A) to recognise the epidermal growth factor receptor (EGFR), which is overexpressed in many types of malignant tumours. The resultant NPs were injected into nude mice bearing human head-and-neck squamous cell carcinoma (Tu686) xenograft tumour for in vivo SERS detection. The SERS spectra demonstrated specific recognition of EGFR-positive tumour site (Fig. 14B) with some non-specific biodistribution into liver (Fig. 14C) and spleen, but not into brain, muscle or other major organs. This class of stable, biocompatible, and non-toxic NPs provides an important platform for in vivo tumour targeting and biodistribution studies. In a recent study, SERS detection of NPs from a depth of 4.5–5 cm was achieved,44 pointing towards successful implementation of the methodology in clinical settings.
Fig. 14.
(A) In vivo cancer marker detection using surface-enhanced Raman with scFv-antibody conjugated AuNPs that recognise the tumour marker. (B) SERS spectra obtained from the tumour (red) and liver (blue) by using targeted NPs and (C) non-targeted NPs. (D) Photographs showing a laser beam focusing on tumour or liver sites. In vivo SERS spectra were obtained with a 785 nm laser at 20 mW and 2 s integration. Adapted from ref. 43, and reprinted with permission from Nature Publishing Group.
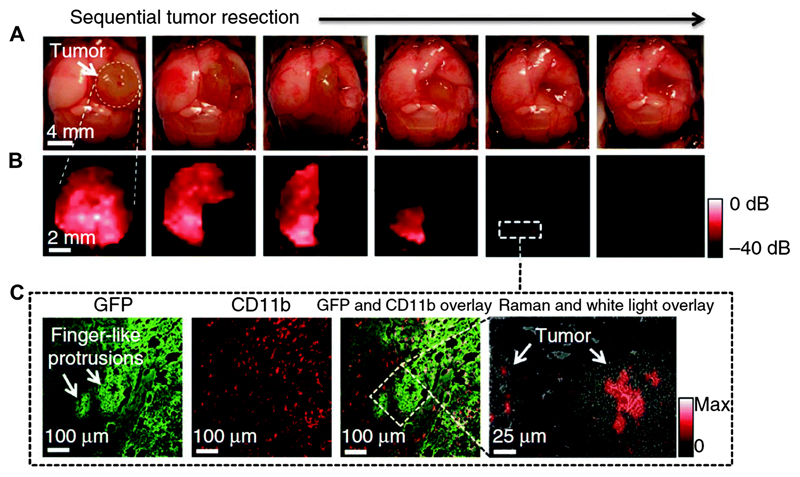
SERS imaging using extrinsic tags has provided a great way to identify brain tumour margins for effective surgery of brain tumours. Gambhir and co-workers have recently reported triple-modality MRI-photoacoustic-Raman (MPR) imaging to delineate the margins of brain tumours in live mice.45 The MPR NP comprises a 60 nm Au core modified with Raman reporter molecules, followed by coating with a 30 nm thick silica shell. The Au–silica core–shell NP was further modified with 1,4,7,10-teraazacyclododecane-1,4,7,10-tetraacetic acid (DOTA)–Gd3+, resulting in a silica encapsulated AuNP with Gd3+ on the surface. The MPR NPs were then used to visualise a brain tumour in live tumour-bearing mice injected via the tail vein. These NPs were devoid of any tumour targeting biomolecules, and relied on the enhanced permeability and retention (EPR) effect for accumulation in cells within the brain tumour.45 In vivo SERS imaging was performed to facilitate tumour resection on tumour-bearing mice. The sections of the detected brain tumour were first removed upon visual inspection. High resolution intraoperative SERS images were recorded after each resection step and correlated with the intraoperative photographs (Fig. 15A). In fact, several small foci of residual SERS signal (Fig. 15B) were found in the resection bed when the tumour resection seemed to be complete by visual inspection. Following the SERS images, the resection was further extended to include those foci located near the tumour–brain interface. SERS imaging of the MPR NP accumulated in the tumour thus enables the detection of cancerous foci that may not be visible to the naked eye.
Fig. 15.
SERS-guided intraoperative surgery using MPR NPs. (A, B) Living tumour-bearing mice underwent craniotomy under general anaesthesia. Quarters of the tumour were then sequentially removed (as illustrated in the photographs, (A)), and intraoperative Raman imaging was performed after each resection step (B) until the entire tumour had been removed, as assessed by visual inspection. (C) A subsequent histological analysis of sections from these foci showed an infiltrative pattern of the tumour in this location. The Raman spectroscopic image (right) shows the selective presence of the MPRs. Adapted from ref. 45, and reprinted with permission from Nature Publishing Group.
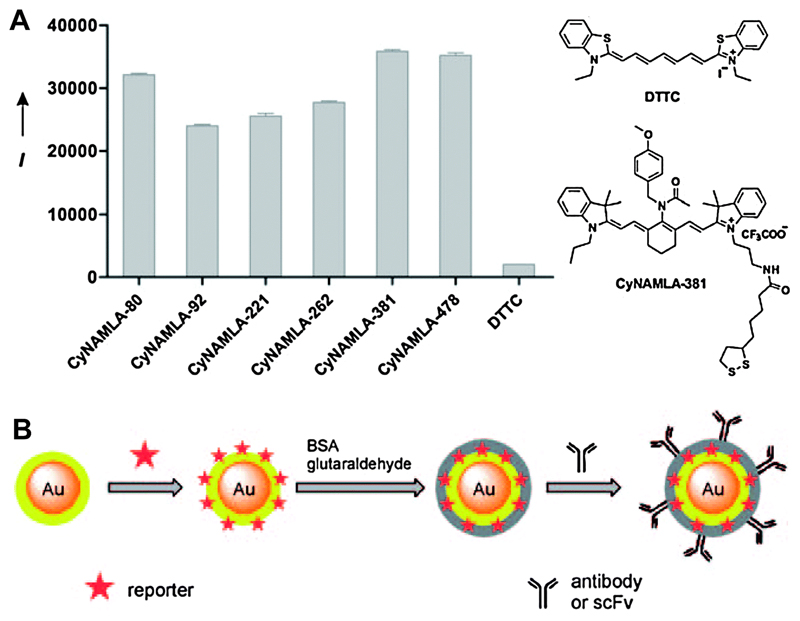
For in vivo detection, the Raman reporter should be active in the NIR region, whereas most of the commonly used Raman reporter dyes are active in the visible region. Therefore, a major challenge in SERS detection in vivo has been the development of NIR-sensitive Raman reporters. Samanta et al. reported the synthesis and screening of tricarbocyanine derivatives to provide an efficient NIR SERS-active compound for ultrasensitive in vivo cancer detection.46 A series of compounds were synthesised, attached onto a SERS substrate (60 nm AuNPs), and their SERS intensities were compared. The compound CyNAMLA-381 that displayed about 12-fold higher sensitivity than the standard DTTC was chosen as the best Raman reporter among the 80 derivatives (Fig. 16A). The selected CyNAMLA reporter-conjugated AuNPs were modified with BSA and glutaraldehyde (Fig. 16B) to prevent NP aggregation and desorption of the reporter molecules. The resulting cross-linked organic layer on the particle surface was then functionalised with anti-HER2 monoclonal antibody or scFv anti-HER2 antibody. The SERS probes were injected into nude mice bearing xenografts generated from SKBR-3 cells. The SERS spectra from the tumour site perfectly resembled the SERS spectra of the NPs. The high sensitivity and tumour specificity of the antibody-conjugated CyNAMLA-381 SERS nanotags registered their potential as non-invasive diagnostic tools for in vivo tumour imaging.
Fig. 16.
(A) SERS intensity (I) of some tricarbocyanine derivatives on 60 nm Au NPs recorded using 785 nm excitation. (B) Schematic of the preparation of BSA-stabilised and antibody- or single-chain variable fragment (scFv)-conjugated SERS nanotags. Adapted from ref. 46, and reprinted with permission from Nature Publishing Group.
4. Towards point-of-care testing
Above we have discussed various assays that are capable of detecting target biomolecules in physiological conditions, and show great clinical potential. However, there remains a great deal of work to take those assays from lab bench to clinic. Although there are a number of examples, in the current section we describe a particular case of a plasmon-enabled diagnostic platform that is successfully making the transition from the lab and into clinic, having gone from a fundamental study of bionanomaterials to incorporation in a device and marketing as a complete diagnostic platform. This is to provide an example of the path that the studies and assays described above could potentially take in the future, and to show that plasmonic biodiagnostics are likely to have a significant impact on future clinical practice.
Chad Mirkin and co-workers published a seminal paper in Nature in 1996, describing the use of oligonucleotide-functionalised AuNPs for the detection of target DNA sequences in a colourimetric assay format.47 The target DNA would induce aggregation of the AuNPs through hybridisation with the NP surface-bound probes, yielding a colour shift of solution from red to blue. This system was latterly developed into a microarray format scanometric assay,48 now commercialised as the FDA-cleared Verigene System™ by the Northwestern University spin-out Nanosphere, used in clinical practice, and sold in more than 20 countries. It is capable of detecting a wide range of targets for various diagnostic purposes, including clinical microbiology, cardiac, human genetic and pharmacogenetic testing. The system is based on the use of spherical nucleic acid (SNA)–AuNP conjugates (SNA–Au NPs), where a low density microarray is used to capture target DNA then SNA–AuNPs in a sandwich format, on a glass slide. Electroless deposition of Ag or Au on the AuNPs enhances the signal as it increases the scattering intensity of incident light. The glass slide acts as a waveguide, and light scattered by the metal spots is used to identify the target and determine its concentration. Importantly, the technique does not require target pre-amplification (such as PCR), as its LOD is 100 aM for large DNA targets. Mirkin's group have proven the efficacy of the scanometric method for protein detection, achieving an LOD of 300 aM of prostate specific antigen (PSA) in buffer and 3 fM in 10% serum (Fig. 17A).49 The system has more recently been configured to detect microRNAs (Fig. 17B),50 which are extremely promising diagnostic targets, but are not amenable for direct PCR amplification. Importantly, the narrow melting transitions of the duplexes formed from SNA–Au NP conjugates allows differentiation of perfectly complementary miRNAs from ones with single base mismatches, leading to a very high specificity for the assay. As a proof-of-concept the system was used to analyse tissue specimens from prostate cancer patients, where it exhibited an accuracy of 98.8% in detecting deregulated miRNAs involved in prostate cancer.
Fig. 17.
The scanometric assay optimised for (A) protein and (B) microRNA detection. The analyte is captured on a glass surface, then the SNA–Au NPs are washed across, binding to the captured analyte. High sensitivity is achieved through amplification of the light scattering signal from the AuNP probes by electroless deposition of Au or Ag. Adapted from ref. 49 and 50, and reprinted with permission from The American Chemical Society.
5. Conclusion and outlook
We have discussed a large variety of assays based on LSPR and SERS. Through ingenious use of synthetic chemistry and biochemistry the intrinsic plasmonic properties of noble metal nanoparticles have been exploited to produce assays capable of detecting a diverse range of biomarkers for a diverse set of diseases. By focussing on studies that have explored the efficacy of their systems in physiological conditions, we hope we have demonstrated the potential for clinical transfer of the work. However it is evident that there is still much to be done to obtain the dreams of rapid, highly accurate and cost-effective nano-enabled diagnostics in a clinical setting. A huge amount of fundamental work has been done over the last few decades to develop synthesis routes to a large variety of nanomaterials, and to engineer them in ever more precise ways. Looking to the future of such materials – in relation to clinical diagnostics – there needs to be a concerted effort to focus on the ideal attributes of clinically viable assays, and to engineer these into nano-enabled systems from their inception. The transfer from lab bench to clinic is not a trivial task, but the field of plasmon-enabled biodiagnostics is in a very good position to do just that, and we can expect such systems to play an important role in healthcare in the coming years.
Acknowledgements
We would like to acknowledge EPSRC grant EP/K020641/1 and ERC Starting Grant Naturale for funding. Thanks to Rona Chandrawati, Hainan Xie, Roberto de la Rica and Robert Chapman for help in preparing this manuscript.
References
- 1.Pelaz B, Jaber S, de Aberasturi DJ, Wulf V, Aida T, de la Fuente JM, Feldmann J, Gaub HE, Josephson L, Kagan CR, Kotov NA, et al. ACS Nano. 2012;6:8468–8483. doi: 10.1021/nn303929a. [DOI] [PubMed] [Google Scholar]
- 2.Wang J, Qu X. Nanoscale. 2013;5:3589–3600. doi: 10.1039/c3nr00084b. [DOI] [PubMed] [Google Scholar]
- 3.Kumar PS, Pastoriza-Santos I, Rodriguez-Gonzalez B, Garcia de Abajo FJ, Liz-Marzan LM. Nanotechnology. 2008;19:015606. doi: 10.1088/0957-4484/19/01/015606. [DOI] [PubMed] [Google Scholar]
- 4.Gupta S, Andresen H, Ghadiali JE, Stevens MM. Small. 2010;6:1509–1513. doi: 10.1002/smll.201000099. [DOI] [PubMed] [Google Scholar]
- 5.Aili D, Mager M, Roche D, Stevens MM. Nano Lett. 2011;11:1401–1405. doi: 10.1021/nl1024062. [DOI] [PubMed] [Google Scholar]
- 6.Giljohann DA, Seferos DS, Daniel WL, Massich MD, Patel PC, Mirkin CA. Angew Chem Int Ed. 2010;49:3280–3294. doi: 10.1002/anie.200904359. [DOI] [PMC free article] [PubMed] [Google Scholar]
- 7.Medley C, Smith J, Tang Z, Wu Y, Bamrungsap S, Tan W. Anal Chem. 2008;80:1067–1072. doi: 10.1021/ac702037y. [DOI] [PubMed] [Google Scholar]
- 8.Wang X, Xu Y, Chen Y, Li L, Liu F, Li N. Anal Bioanal Chem. 2011;400:2085–2091. doi: 10.1007/s00216-011-4943-1. [DOI] [PubMed] [Google Scholar]
- 9.Rodríguez-Lorenzo L, de la Rica R, Álvarez-Puebla RA, Liz-Marzán LM, Stevens MM. Nat Mater. 2012;11:604–607. doi: 10.1038/nmat3337. [DOI] [PubMed] [Google Scholar]
- 10.de la Rica R, Stevens MM. Nat Nano. 2012;7:821–824. doi: 10.1038/nnano.2012.186. [DOI] [PubMed] [Google Scholar]
- 11.Wang X, Li Y, Wang H, Fu Q, Peng J, Wang Y, Du J, Zhou Y, Zhan L. Biosens Bioelectron. 2010;26:404–410. doi: 10.1016/j.bios.2010.07.121. [DOI] [PubMed] [Google Scholar]
- 12.Tang L, Casas J, Venkataramasubramani M. Anal Chem. 2012;85:1431–1439. doi: 10.1021/ac302422k. [DOI] [PMC free article] [PubMed] [Google Scholar]
- 13.Huang H, Liu F, Huang S, Yuan S, Liao B, Yi S, Zeng Y, Chu P. Anal Chim Acta. 2012;755:108–114. doi: 10.1016/j.aca.2012.10.020. [DOI] [PubMed] [Google Scholar]
- 14.Duval D, Lechuga LM. IEEE Photonics J. 2013;5:0700906. [Google Scholar]
- 15.Polavarapu L, Liz-Marzan LM. Phys Chem Chem Phys. 2013;15:5288–5300. doi: 10.1039/c2cp43642f. [DOI] [PubMed] [Google Scholar]
- 16.Chen J-Y, Chen Y-C. Anal Bioanal Chem. 2011;399:1173–1180. doi: 10.1007/s00216-010-4397-x. [DOI] [PubMed] [Google Scholar]
- 17.Yamamichi J, Ojima T, Yurugi K, Iida M, Imamura T. Nanomedicine. 2011;7:889–895. doi: 10.1016/j.nano.2011.02.002. [DOI] [PubMed] [Google Scholar]
- 18.Guo L, Kim D-H. Biosens Bioelectron. 2012;31:567–570 C. doi: 10.1016/j.bios.2011.10.047. [DOI] [PubMed] [Google Scholar]
- 19.Inci F, Tokel O, Wang S, Gurkan UA, Tasoglu S, Kuritzkes DR, Demirci U. ACS Nano. 2013;7:4733–4745. doi: 10.1021/nn3036232. [DOI] [PMC free article] [PubMed] [Google Scholar]
- 20.Otte MA, Estévez MC, Carrascosa LG, González-Guerrero AB, Lechuga LM, Sepúlveda B. J Phys Chem C. 2011;115:5344–5351. [Google Scholar]
- 21.Long DA. Raman Spectroscopy. McGraw Hill Higher Education; 1977. [Google Scholar]
- 22.Raman KSKCV. Nature. 1928;121:501–502. [Google Scholar]
- 23.Jeanmaire DL, Van Duyne RP. J Electroanal Chem Interfacial Electrochem. 1977;84:1–20. [Google Scholar]
- 24.Rodríguez-Lorenzo L, Álvarez-Puebla RNA, Pastoriza-Santos I, Mazzucco S, Stéphan O, Kociak M, Liz-Marzán LM, García de Abajo FJ. J Am Chem Soc. 2009;131:4616–4618. doi: 10.1021/ja809418t. [DOI] [PubMed] [Google Scholar]
- 25.Shafer-Peltier KE, Haynes CL, Glucksberg MR, Van Duyne RP. J Am Chem Soc. 2002;125:588–593. doi: 10.1021/ja028255v. [DOI] [PubMed] [Google Scholar]
- 26.Stuart DA, Yuen JM, Shah N, Lyandres O, Yonzon CR, Glucksberg MR, Walsh JT, Van Duyne RP. Anal Chem. 2006;78:7211–7215. doi: 10.1021/ac061238u. [DOI] [PubMed] [Google Scholar]
- 27.Ma K, Yuen JM, Shah NC, Walsh JT, Glucksberg MR, Van Duyne RP. Anal Chem. 2011;83:9146–9152. doi: 10.1021/ac202343e. [DOI] [PMC free article] [PubMed] [Google Scholar]
- 28.Barhoumi A, Zhang D, Tam F, Halas NJ. J Am Chem Soc. 2008;130:5523–5529. doi: 10.1021/ja800023j. [DOI] [PubMed] [Google Scholar]
- 29.Cho H, Lee B, Liu GL, Agarwal A, Lee LP. Lab Chip. 2009;9:3360–3363. doi: 10.1039/b912076a. [DOI] [PubMed] [Google Scholar]
- 30.Papadopoulou E, Bell SEJ. Angew Chem Int Ed. 2011;50:9058–9061. doi: 10.1002/anie.201102776. [DOI] [PMC free article] [PubMed] [Google Scholar]
- 31.Chen Y, Chen G, Feng S, Pan J, Zheng X, Su Y, Chen Y, Huang Z, Lin X, Lan F, Chen R, et al. J Biomed Opt. 2012;17:0670031–0670037. doi: 10.1117/1.JBO.17.6.067003. [DOI] [PubMed] [Google Scholar]
- 32.Ock K, Jeon WI, Ganbold EO, Kim M, Park J, Seo JH, Cho K, Joo S-W, Lee SY. Anal Chem. 2012;84:2172–2178. doi: 10.1021/ac2024188. [DOI] [PubMed] [Google Scholar]
- 33.Kang B, Afifi MM, Austin LA, El-Sayed MA. ACS Nano. 2013;7:7420–7427. doi: 10.1021/nn403351z. [DOI] [PubMed] [Google Scholar]
- 34.Jin R, Cao YC, Thaxton CS, Mirkin CA. Small. 2006;2:375–380. doi: 10.1002/smll.200500322. [DOI] [PubMed] [Google Scholar]
- 35.Faulds K, McKenzie F, Smith WE, Graham D. Angew Chem Int Ed. 2007;46:1829–1831. doi: 10.1002/anie.200604265. [DOI] [PubMed] [Google Scholar]
- 36.Kang T, Yoo SM, Yoon I, Lee SY, Kim B. Nano Lett. 2010;10:1189–1193. doi: 10.1021/nl1000086. [DOI] [PubMed] [Google Scholar]
- 37.Xu S, Ji X, Xu W, Li X, Wang L, Bai Y, Zhao B, Ozaki Y. Analyst. 2004;129:63–68. doi: 10.1039/b313094k. [DOI] [PubMed] [Google Scholar]
- 38.Wang G, Lipert RJ, Jain M, Kaur S, Chakraboty S, Torres MP, Batra SK, Brand RE, Porter MD. Anal Chem. 2011;83:2554–2561. doi: 10.1021/ac102829b. [DOI] [PMC free article] [PubMed] [Google Scholar]
- 39.Chen Z, Tabakman SM, Goodwin AP, Kattah MG, Daranciang D, Wang X, Zhang G, Li X, Liu Z, Utz PJ, Jiang K, et al. Nat Biotechnol. 2008;26:1285–1292. doi: 10.1038/nbt.1501. [DOI] [PubMed] [Google Scholar]
- 40.Hwang H, Chon H, Choo J, Park J-K. Anal Chem. 2010;82:7603–7610. doi: 10.1021/ac101325t. [DOI] [PubMed] [Google Scholar]
- 41.Sha MY, Xu H, Natan MJ, Cromer R. J Am Chem Soc. 2008;130:17214–17215. doi: 10.1021/ja804494m. [DOI] [PMC free article] [PubMed] [Google Scholar]
- 42.Zavaleta CL, Smith BR, Walton I, Doering W, Davis G, Shojaei B, Natan MJ, Gambhir SS. Proc Natl Acad Sci U S A. 2009;106:13511–13516. doi: 10.1073/pnas.0813327106. [DOI] [PMC free article] [PubMed] [Google Scholar]
- 43.Qian X, Peng X-H, Ansari DO, Yin-Goen Q, Chen GZ, Shin DM, Yang L, Young AN, Wang MD, Nie S. Nat Biotechnol. 2008;26:83–90. doi: 10.1038/nbt1377. [DOI] [PubMed] [Google Scholar]
- 44.Stone N, Kerssens M, Lloyd GR, Faulds K, Graham D, Matousek P. Chem Sci. 2011;2:776–780. [Google Scholar]
- 45.Kircher MF, de la Zerda A, Jokerst JV, Zavaleta CL, Kempen PJ, Mittra E, Pitter K, Huang R, Campos C, Habte F, Sinclair R, et al. Nat Med. 2012;18:829–834. doi: 10.1038/nm.2721. [DOI] [PMC free article] [PubMed] [Google Scholar]
- 46.Samanta, Maiti KK, Soh K-S, Liao X, Vendrell M, Dinish US, Yun S-W, Bhuvaneswari R, Kim H, Rautela S, Chung J, et al. Angew Chem Int Ed. 2011;50:6089–6092. doi: 10.1002/anie.201007841. [DOI] [PubMed] [Google Scholar]
- 47.Mirkin A, Letsinger RL, Mucic RC, Storhoff JJ. Nature. 1996;382:607–609. doi: 10.1038/382607a0. [DOI] [PubMed] [Google Scholar]
- 48.Taton TA, Mirkin CA, Letsinger RL. Science. 2000;289:1757–1760. doi: 10.1126/science.289.5485.1757. [DOI] [PubMed] [Google Scholar]
- 49.Kim D, Daniel WL, Mirkin CA. Anal Chem. 2009;81:9183–9187. doi: 10.1021/ac9018389. [DOI] [PMC free article] [PubMed] [Google Scholar]
- 50.Alhasan H, Kim DY, Daniel WL, Watson E, Meeks JJ, Thaxton CS, Mirkin CA. Anal Chem. 2012;84:4153–4160. doi: 10.1021/ac3004055. [DOI] [PMC free article] [PubMed] [Google Scholar]


