

Abstract
The Wnt/β-catenin pathway has been associated with thyroid cell growth and tumorigenesis. However, little is known regarding its involvement in the response to the key regulators of thyroid cell proliferation and differentiation. Here we show that TSH and IGF-1 increase β-catenin nuclear accumulation and its transcriptional activity in differentiated thyroid cells. This effect takes place in a Wnt-independent manner because TSH and IGF-1, through the activation of protein kinase A and protein kinase B/Akt, phosphorylate β-catenin at S552 and S675, which results in β-catenin release from E-cadherin at the adherens junctions. Nuclear β-catenin regulates thyroid cell proliferation, because its silencing or the overexpression of a dominant-negative form of T-cell factor 4 resulted in reduced levels of cyclin D1 and DNA synthesis. Furthermore, the β-catenin silencing markedly reduced the expression of Pax8, the main transcription factor involved in epithelial thyroid cell differentiation. Finally, we observed that β-catenin physically interacts with the transcription factor Pax8, increasing its transcriptional activity on the sodium iodide symporter (NIS) gene, a critical gene required for thyroid cell physiology. Taken together, our findings show that β-catenin plays a not yet described role in thyroid function including a functional interaction with Pax8.
Thyrocytes are low-proliferating cells and TSH and IGF-1 are the major functional and proliferative stimuli for the thyroid at late developmental stages (1–3). Binding of TSH to its G protein–coupled receptor activates different signaling pathways, with the cAMP/protein kinase A (PKA) pathway being the main pathway (1). IGF-1 mediates its action mainly through the phosphatidylinositol 3-kinase (PI3K)/Akt pathway, and although the activation of this pathway by TSH has been reported (4), this is still a matter of controversy. Other pathways such as mammalian target of rapamycin and MAPK contribute, albeit to a lesser extent, to the effect of TSH-mediated proliferation (5).
In addition, both ligands regulate thyroid differentiation as defined by the expression of the transcription factors Nkx2–1, FoxE1, and Pax8 that are responsible for the expression of thyroid-specific genes (6). Among them, the gene encoding the sodium iodide symporter (NIS) plays a critical role, because this protein is responsible for iodide uptake, the first step in the biosynthesis of the iodinated thyroid hormones T3 and T4 (7). Even though there are abundant data about TSH and IGF-1 controlling proliferation and differentiation, the mechanisms by which this control is achieved are far from being fully understood.
Moreover, TSH is not secreted until embryonic day 14.5 in mice and because there are several stages of proliferation of the thyroid precursors before this time (3, 6), other pathways must be involved in these events. One of these may be the Wnt/β-catenin pathway. To date there is no evidence of its involvement in the development of the thyroid gland, but several lines of evidence point to a role of this pathway in the functioning of the adult thyroid gland (8–10).
The Wnt/β-catenin pathway plays a critical role in the development and maintenance of several epithelial tissues. In the absence of Wnt factors, β-catenin is located in the adherens junctions, bound to E-cadherin. A protein complex called destruction complex targets the free cytoplasmic protein. In this complex, 2 kinases, casein kinase 1 (CK1) and glycogen synthase kinase-3β (GSK3β), consecutively phosphorylate β-catenin at the N-terminal domain at S45 and then at S33/S37/T41, promoting its proteasome-mediated degradation (11). When Wnt binds to one of the Fz receptors and the coreceptor LRP5/6, the degradation complex is inhibited and β-catenin is no longer degraded; instead, it accumulates in the cytoplasm and nuclei. In the nucleus, β-catenin binds the transcription factors T-cell factor (TCF) and lymphoid enhancer factor (LEF) and activates transcription of their target genes, among which are growth- and differentiation-related genes.
Normal human thyroid cells express several Fzd, Dvl, and Wnt proteins (8) and have a functional destruction complex. Activation of the Wnt/β-catenin pathway by lithium or by silencing the negative regulator of β-catenin GSK3β promotes an increase in thyroid cell proliferation (9, 10). In rat FRTL5 thyroid cells, TSH induces Wnt1 expression and secretion and promotes cell proliferation (12). These data suggest the existence of a functional Wnt pathway in thyroid cells relevant for their proliferation.
Increasing evidence has shown that Wnt-independent inhibition of GSK3β and stabilization of β-catenin, the key effector of the Wnt/β-catenin pathway, is an alternative way of activation of β-catenin/TCF target genes. Phosphorylation of GSK3β and β-catenin is facilitated by kinases such as PKA and Akt (13), which inhibit GSK3β activity and increase β-catenin stability and transcriptional activity. In fact, direct phosphorylation of β-catenin by several kinases has emerged as a new level in the regulation of β-catenin function (reviewed in Ref. 14). Thus, phosphorylation of β-catenin at S552, conducted by Akt and PKA, leads to nuclear translocation of β-catenin (15, 16), whereas PKA-mediated phosphorylation at S675 promotes transcriptional activity of β-catenin by facilitating its interaction with the transcriptional coactivator cAMP response element–binding protein (CREB)–binding protein (CBP) (14, 17).
Because TSH- and IGF-1-activated pathways are involved in these phosphorylation events, we decided to analyze their cross talk with the β-catenin pathway and the role of the latter pathway in thyroid proliferation and differentiation. Here we show that TSH and IGF-1, through PKA and PI3K/AKT, induce nuclear localization of β-catenin in a Wnt-independent manner and that β-catenin is involved in TSH- and IGF-1–mediated proliferation. We also show that β-catenin induces Pax8 expression by acting as a transcriptional coactivator of NIS transcription, which finally results in increased NIS function. In summary, we report here that TSH and IGF-1 affect β-catenin levels in different ways and that thyroid proliferation and differentiation are mediated by a functional interaction between β-catenin and Pax8.
Materials and Methods
Cell culture
PCCl3 cells (18) and FRTL5 cells (19) are continuous lines of thyroid follicular cells derived from Fischer rats. Both cell lines constitute a model system for studying differentiation and growth regulation in a thyroid epithelial cell setting. These cells express thyroid-specific genes, including NIS and the thyroid-specific transcription factors Nkx2–1, FoxE1, and Pax8. They were grown in Coon's modified Ham's F-12 medium supplemented with a 6-hormone mixture (1 nM TSH, 10 μg/mL insulin, 10 ng/mL somatostatin, 5 μg/mL transferrin, 10 nM hydrocortisone, and 10 ng/mL glycyl-l-histidyl-l-lysine acetate) (complete medium) and 5% donor calf serum. The effects of hormones and growth factors were studied by starving near confluent cells for TSH and insulin in the presence of 0.2% BSA (starvation medium, indicated as [−] in the figures). Ligands were added to the culture medium at the following final concentrations: 1 nM TSH, 10 μM forskolin, and 100 ng/mL IGF-1 (unless otherwise indicated). The kinase inhibitors were added to the cells 1 hour before hormone addition at the following concentrations: 10 μΜ H89, 10 μM LY294002, 250 nM wortmannin, 10 μM UO126, 10 μM Akt inhibitor (Akti) VIII, and 100 nM rapamycin. These concentrations were shown previously to specifically inhibit the kinases studied (20). LiCl was used at 20 mM and cycloheximide at 10 μg/mL final concentrations.
Reporter genes and transfections
pRL-CMV, which contains a cDNA coding for Renilla, was used to monitor transfection efficiency. The reporter constructs used were pNIS-2.8-luciferase (Luc), which contains a 2854-bp DNA fragment of the rat NIS promoter (21); pTg-Luc, which contains a 2000-bp DNA fragment of the human (h) Tg promoter (22); Cp5-Luc, which contains an artificial promoter containing 5 Pax8 binding sites (23); and Super8x TopFlash-Luc (Top) and Super8x FopFlash-Luc (Fop), which contain 8 optimized and 8 mutated TCF-binding sites, respectively (24). cDNAs encoding hPax8 (25), rNkx2–1 (26), hCREB (27) and wild-type hβ-catenin or mutated hβ-catenin (S33Y) (28) were subcloned, respectively, in pcDNA3.1, pBlueScript II (KS−), pGal4, and pCl-neo. To obtain the pPax8–1, -3, and -5 constructs, DNA fragments from the rat Pax8 promoter corresponding to the regions −2700/+4, −1686/+4, and −698/+4 were amplified from rat genomic DNA by PCR, using forward primers containing a MluI site (5′-CGACGCGTCGGCTAGATGCATAGGACTGTCACGTTTA-3′, 5′-CGACGCGTCGGCTAGAGCACATCACGCTCGCCCACTA-3′, and 5′-CGACGCGTCGGCTAGAGGCATAGGATGAGGTGAACGCTA-3′, respectively) and a common reverse primer containing a BglII site (5′-GGAAGATCTCCCTCGAGGAAGTTTGCTCCCATCCACCTG-3′). The fragments were digested with MluI and BglII and subcloned into pGL3basic-Luc (Promega). The pPax-2, -4, and -6 constructs containing the first intronic region of the Pax8 gene (+147) were obtained using a similar strategy. DNA fragments were amplified using the same forward primers as mentioned above and the reverse primer (5′-GGAAGATCTCCCTCGAGGACCATCTCCTTTCTCACAG-3′).
PCCl3 cells were grown in complete medium and transfected with jetPEI transfection reagent (Polyplus) according to the manufacturer's protocol. Twenty-four hours after transfection, culture medium was changed to starvation medium, and cells were maintained in this medium for 48 hours. Cells were then treated with the indicated compounds for 24 hours and harvested for luciferase assays (Dual-Luciferase Kit; Promega). HeLa cells were grown in complete DMEM, transfected by calcium phosphate coprecipitation as described (29), and harvested 48 hours later for the measurement of luciferase activity. Of each promoter construct, 0.320 to 1 μg was cotransfected with 0.1 to 1 μg of the indicated expression vector. The amount of DNA in each transfection was kept constant by the addition of an appropriate amount of empty expression vector, pcDNA3.1. To correct for transfection efficiency, 25 to 50 ng of the Renilla-encoding pRL-CMV vector was added in all cases. In addition, in the Top/Fop assays, Top activity was normalized with Fop activity to ensure that the TopFlash values were dependent on the Lef1/Tcf-binding sites in the promoter. All transfection experiments were performed in triplicate at least 3 times.
Protein extraction and Western blotting
Total proteins were extracted in lysis buffer (1× PBS; 1% NP-40, 0.1% SDS, and 0.5% deoxycholic acid) supplemented with a protease inhibitor cocktail. Nuclear and cytoplasmic proteins were extracted as described previously (30). Plasma membrane proteins were isolated after surface biotinylation with the membrane-impermeable reagent Sulfo-NHS-SS Biotin (Pierce Biotechnology). The entire biotinylated fraction was isolated with streptavidin-coated beads as described previously (31) and immunoblotted. The protein concentration was measured according to Bradford (32), using a protein assay kit (Bio-Rad Laboratories). Thirty-microgram quantities of all samples were diluted in loading buffer and heated at 95°C for 5 minutes. Samples were then separated by SDS-PAGE and transferred to nitrocellulose membranes. Membranes were blocked in PBS-T buffer (PBS plus 0.1% Tween 20, pH 7.5) containing 5% nonfat dry milk. After incubation with antibodies in PBS-T containing 5% nonfat dry milk, membranes were washed 3 times with PBS-T buffer and incubated with streptavidin–horseradish peroxidase conjugate, followed by 3 washes of 10 minutes each with PBS-T buffer. Immunoreactive bands were visualized by enhanced chemiluminescence (Thermo Scientific). Protein expression levels were quantified using ImageJ software (National Institutes of Health). The proteins were quantified and normalized to their loading controls.
Anti-Flag antibody was purchased from Sigma-Aldrich. Anti-pCREB was purchased from Calbiochem. Streptavidin–horseradish peroxidase conjugate, anti-Akt1/2, anti-pAkt (S473), anti-β-actin, anti-β-catenin, anti-cyclin D1, anti-pERK (Y204), anti-ERK1/2, anti-TBP, and anti-tubulin antibodies were obtained from Santa Cruz Biotechnology. Anti-Pax8 antibody was from BioPat. Anti-pβ-catenin (S33/37/T41, S45, S552, and S675), anti-CTCF, anti-pGSK3β (S9), and anti-p-p70S6K (T389) antibodies were from Cell Signaling Technology. Anti-E-cadherin and anti-GSK3β were from BD Biosciences. Anti-Na/K-ATPase-α was from Affinity BioReagents, and anti-rat NIS was described elsewhere (33).
Coimmunoprecipitation (Co-IP) and chromatin immunoprecipitation (ChIP) assays
Pax8 or E-cadherin antibody (1 μg) was bound to Dynabeads (Invitrogen) and incubated with 200 μg of nuclear proteins or 1 mg of total protein extracts from PCCl3 cells, respectively. Incubation was performed overnight at 4°C in 300 μl of immunoprecipitation buffer (20 mM HEPES [pH 8], 10 mM KCl, 0.15 mM EGTA, 0.15 mM EDTA, 150 mM NaCl, and 0.1% NP-40) containing a cocktail of protease inhibitors. After washing with immunoprecipitation buffer, proteins were eluted in 20 μl of Laemmli sample buffer and boiled for 10 minutes. The immunocomplexes were separated by SDS-PAGE and then immunoblotted using anti-Pax8, anti-E-cadherin, and anti-β-catenin antibodies.
ChIP was performed as described previously (34). In brief, PCCl3 cells grown in complete medium were assessed by a ChIP assay using 10 μg of polyclonal anti-rabbit β-catenin antibody. Procedure controls included an input condition, obtained before DNA-protein complex sonication and further used during ChIP assays as a normalization sample, and nonimmunoprecipitated DNA, which was obtained just before β-catenin immunoprecipitation. The promoter Afm (afamin or α-albumin) was used as a negative control of a non–β-catenin responsive gene. The binding of β-catenin to Pax8 promoter was analyzed by quantitative RT-PCR (described below) using the primers marked as ChIP in Supplemental Table 1. The enrichment of β-catenin target sequences in ChIP material was calculated relative to the Afm negative control and normalized to their relative amplification in the input sample.
Quantitative RT-PCR
TRIzol (Sigma-Aldrich) was used to extract RNA, and equal amounts of RNA were added to a reverse-transcriptase reaction mix (M-MLV; Promega); quantitative PCR was conducted with the Mx3000P QPCR system (Agilent Technologies). Reactions were performed with the indicated primers and templates, using a FastStart Universal Probe Master Kit and run for 40 cycles. The specificity of the reactions was determined by subsequent melting curve analysis. Stratagene analysis software was used to remove background fluorescence. The number of cycles needed to reach the crossing point for each sample was used to calculate the amount of each product using the 2-ΔΔCt method. Levels of the PCR product were expressed as a function of actin. Sequences of primers are listed in Supplemental Table 1.
Immunocytochemistry and immunofluorescence
Cells were seeded on coverslips and after the indicated treatment were fixed with 4% paraformaldehyde in PBS (pH 7.4). Cells were then permeabilized with 0.5% Triton X-100, blocked with 1% BSA, incubated with primary anti-β-catenin (C-18) antibody, washed, and incubated with biotinylated secondary antibody before processing according to the immunoperoxidase procedure (ABC Kit; Vector Laboratories). For immunofluorescence, after primary antibody incubation, cells were incubated with Alexa Fluor 488 or Texas Red 546 secondary antibodies, mounted with ProLong Gold antifade reagent with 4′,6′-diamino-2-phenylindole (DAPI) (Invitrogen) and observed under a confocal microscope with a ×63 magnification objective.
Lentivirus production and cell infection
Stable PCCl3 cell lines were generated using lentiviral expression vectors. For the generation of β-catenin–null cells (shβ-cat) the vector encoded a short hairpin (sh) RNA against rat β-catenin (pLKO.1-shbcat, clone TRCN0000003845; Open Biosystems); control cells (shscramble) were infected with virus containing a noncoding control DNA (pGIPZ-shscramble, Open Biosystems). Cells expressing a constitutively active form of mouse β-catenin (4A) and the fluorescent protein mCherry (Cherry+) and cells expressing a dominant-negative form of TCF were generated using the vectors EβC and EdTP, respectively (both vectors were from Addgene and are described in Ref. 35).
VSV-G pseudotyped lentivirus was produced by calcium phosphate transfection of HEK293T cells with the corresponding lentiviral vector and helper plasmids pMD2-VSVg (36) and pCD/NL-BH (37). Viral supernatant was collected 48 hours after transfection and filtered through 0.45-μm polyvinylidene difluoride filters. After 2 × 10⁵ PCCl3 cells were plated in a single well of a 6-well plate, cells were infected with a 1:2 dilution of lentivirus supernatant containing 8 μg/mL Polybrene. Forty-eight hours after infection, puromycin-resistant cells were selected with 1 μg/mL puromycin (Sigma-Aldrich), and mCherry-positive cells were selected by fluorescence-activated cell sorting.
5-Bromo-2′-deoxyuridine (BrdU) incorporation assay
To determine DNA synthesis, we used the Cell Proliferation ELISA BrdU Assay (Roche Molecular Biochemicals) according to the manufacturer's protocol. The indicated PCCl3 cells were seeded in 96-well plates (5 × 10³ cells/well) and cultured in starvation medium for 48 hours to synchronize the cells. Cells were then treated with TSH, IGF-1, or both at the concentrations indicated in the experiments. Twenty-four hours later, cells were pulse-labeled for 2 hours with 10 μM BrdU, and measurements were performed on an ELISA reader at 450 nm. Experiments were done 3 times in triplicate.
Iodide uptake
Cells were assayed for iodide uptake as described previously (33). In brief, control and I−-treated cells were incubated for 1 hour at 37°C in PBS solution containing 20 μM KI and carrier-free Na125I (specific activity, 100 μCi/mmol I−). Radioactivity was quantified in a γ-counter. Uptake is expressed as picomoles of I− and normalized for the amount of DNA in each well.
Statistical analysis
Results are presented as mean fold induction ± SEM from at least 3 independent experiments. The Student two-tailed t test was used to assess differences between measurements. Differences were considered statistically significant at a value of P < .05.
Results
Identification of the Wnt/β-catenin pathway in PCCl3 rat thyroid cells
The involvement of the Wnt/β-catenin pathway in the homeostasis of epithelial cells is becoming clearer every day, but still little is known about its role in thyroid function. To further address this issue, we determined first of all whether the components of the Wnt/β-catenin pathway are expressed in PCCl3 rat epithelial thyroid cells. By quantitative RT-PCR, we established that most of the members of both the canonical and noncanonical pathways are expressed at different levels (Supplemental Figure 1, A and B). This observation suggests that these cells can respond to treatment with any Wnt ligand despite the fact that the expression of canonical Wnt members (Wnt 1, 2, 3, 3A, 7A, and 10B) was not detected in PCCl3 cells. As a positive control, RNA from total mouse embryos was used. In addition, RNA from FRTL5 cells and from mouse and rat thyroids was assayed, showing that the canonical member Wnt7A is expressed in FRTL5 cells and in rat thyroid, but the other canonical Wnt members mentioned above are not (Supplemental Figure 1C).
TSH and IGF-1 increase nuclear accumulation of β-catenin and its transcriptional activation
In this study we focused our attention on β-catenin because it has been noted to play an important role in thyroid carcinogenesis (38) and to be involved in the proliferation of thyroid cells (9, 10, 12). Because the main regulators of this proliferation are TSH and IGF-1, we studied their control of β-catenin. In quiescent PCCl3 cells, β-catenin is located in the adherens junctions of the membrane (Figure 1A). Treatment for 16 hours with TSH, IGF-1, or both resulted in the accumulation of β-catenin in the cytoplasm and even more so in the nucleus. As a positive control, LiCl, a well-known Wnt activator (39), was used. β-Catenin nuclear accumulation was already evident after 0.5 hour of treatment, as demonstrated by confocal microscopy (Figure 1B). These observations were confirmed by Western blot analysis of cytoplasmic and nuclear extracts (Figure 1C). The kinetics of nuclear accumulation of β-catenin was slow, as has already been described (40), but interestingly reached higher levels after 16 hours of TSH and IGF-1 treatment than those observed after LiCl treatment (see quantification of the Western blot of Figure 1C). Furthermore, it is important to note that treatment with each of the 3 ligands is associated with a shift from cytoplasmic to nuclear β-catenin.
Figure 1.
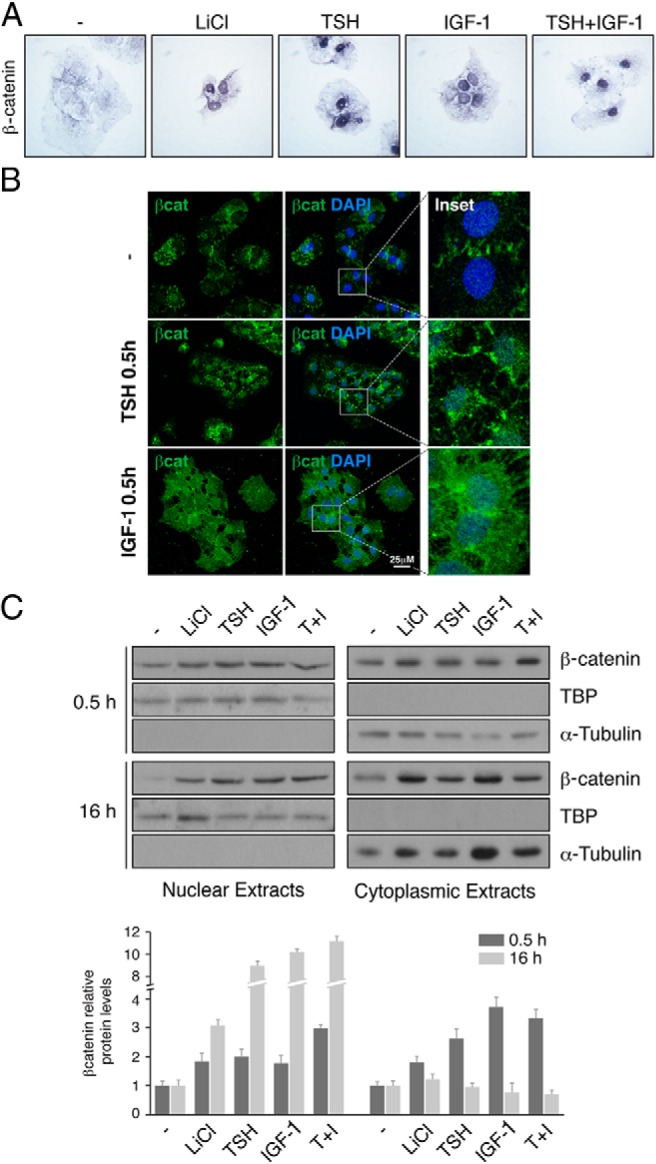
TSH and IGF-1 induce nuclear localization of β-catenin. PCCl3 cells were cultured for 2 days in starvation media. A, Cells grown on coverslips were treated for 16 hours with LiCl, TSH, IGF-1, or TSH+IGF-1 and then were fixed and stained with anti-β-catenin antibody. B, Cells were treated for 0.5 hour with TSH or IGF-1 as indicated, fixed, and stained with anti-β-catenin antibody (green). Nuclei were stained with DAPI (blue). The insets show higher magnifications of the regions marked by a square. C, Top panel: cells treated 0.5 hour or 16 hours with LiCl, TSH, IGF-1, or TSH+IGF-1 (T+I) were collected, and nuclear and cytoplasmic protein extracts were analyzed by Western blot to detect β-catenin. TBP and α-tubulin were used as nuclear and cytoplasmic loading controls, respectively. Bottom panel: quantification of β-catenin protein levels normalized with TBP or α-tubulin in nuclear or cytoplasmic fractions, respectively. Values represent means ± SEM (n = 3).
The fact that we observed a rapid effect already at 0.5 hour suggests that TSH and IGF-1 regulate nuclear accumulation of β-catenin by a posttranslational rather than a transcriptional mechanism, possibly involving different signaling pathways such as cAMP/PKA and PI3K/Akt.
To understand β-catenin regulation, we first analyzed GSK3β phosphorylation, because it has been noted that PKA and Akt can phosphorylate this kinase, leading to inhibition of its activity (13). We observed that treatment of PCCl3 cells with TSH, IGF-1, or both for 30 minutes increases the phosphorylation of GSK3β at S9 (Figure 2A). Nevertheless, GSK3β-S9 phosphorylation and, consequently, its inhibition did not correlate with a significant decrease in the phosphorylation of β-catenin at S33/S37/T41 (Figure 2B). Furthermore, TSH and forskolin, but not IGF-1, increased the phosphorylation of β-catenin at S45 (Figure 2B), a residue phosphorylated by CK1 in a PKA-dependent manner. Finally, the levels of total β-catenin did not show any variation. These data suggest that the β-catenin accumulated in the nucleus in response to TSH and IGF-1 does not derive from inhibition of the cytoplasmic destruction complex. Interestingly, TSH and IGF-1 increased phosphorylation of β-catenin at S552 (Figure 2, C and D); phosphorylation induced by TSH was 4 to 5 times higher than that obtained with IGF-1. This may be an indication of the fact that TSH plays a more critical role in thyroid cell proliferation than that elicited by IGF-1 (1). Phosphorylation of the S552 residue has been determined to be mediated by PKA and Akt (15, 17). Because TSH and IGF-1 activate different signaling pathways (1, 5, 41), we tried to identify the signals mediating β-catenin phosphorylation at S552. The TSH effect is caused at least in part by cAMP/PKA, because forskolin mimicked it and H89 decreased it. In contrast, specific inhibitors of PI3K, MAPK kinase, or TORC1 did not have any effect (Figure 2C). Akt is involved in the effect of IGF-1 because only treatment with its specific inhibitor Akti1/2 and not with MAPK kinase or TORC1 inhibitors, elicited an effect (Figure 2D).
Figure 2.

TSH and IGF-1 stabilize β-catenin in cytoplasm and nucleus through PKA/Akt-mediated phosphorylation at S552, increasing its transcriptional activity. PCCl3 cells were cultured for 2 days in starvation medium. A, Cells were treated with TSH, IGF-1, or TSH+IGF-1 (T+I) for 30 minutes. Total protein extracts were analyzed by Western blot using pGSK3β (S9) and GSK3β antibodies. B, Cells were treated with LiCl, IGF-1, TSH, or forskolin (Forsk) for the indicated times. Total protein extracts were analyzed by Western blot using specific β-catenin (β-cat) antibodies [pS33/37/T41-β-catenin, pS45-β-catenin, total β-catenin, and pGSKβ (S9)]. β-Actin was used as a loading control. C and D, Cells were pretreated with one of the indicated inhibitors (H89, LY290042 [LY], wortmannin [Wort], UO126, Akti1/2, or rapamycin [Rapa]) for 1 hour and then were treated for 30 minutes with TSH (C) or IGF-1 (D). Top panel: total protein extracts were analyzed by Western blot using pS552-β-catenin antibody. Anti-pAKT (S473), pERK (Y204), and pp70S6K (T389) were used to assess the efficiency of the inhibitors; β-catenin, AKT1/2, and ERK2 were used as loading controls. Bottom panel: quantification of pS552-β-catenin protein levels normalized with total β-catenin. Relative pS552-β-catenin protein levels are expressed as the variation over the TSH (C) or IGF-1 (D) stimulation (equal to 1). Values represent means ± SEM (n = 3). *, P < .05; **, P < .01; and ***, P < .001 by Student t test. E, Cells were pretreated with 10 μg/mL cycloheximide (CHX) for 30 minutes and then stimulated with TSH or IGF-1 for the indicated times. Top panel: total protein was analyzed by Western blotting for the detection of β-catenin. β-Actin was used as a loading control. Bottom panel: quantification of the relative levels of β-catenin. Values represent means ± SEM (n = 3). F and G, Cells were pretreated with the indicated inhibitors (H89, Akti1/2, or H89+Akti1/2 [H+A]) for 1 hour and then were stimulated for 2 hours with TSH, forskolin, or IGF-1. Nuclear and cytoplasmic (Cyt) protein extracts were analyzed by Western blotting to detect β-catenin. α-Tubulin and CTCF were used as cytoplasmic and nuclear loading controls. Anti-pATF1 (S63) and pAKT (S473) were used to assess the efficiency of the inhibitors.
Phosphorylation of β-catenin at S552 increases its cytoplasmic stability and its import into the nucleus (15, 16). Thus, we measured the half-life of β-catenin protein after incubation of thyroid cells with cycloheximide to inhibit de novo protein synthesis and quantified the β-catenin levels over time. The results show that both TSH and IGF-1 (Figure 2E) increase the half-life of β-catenin; the IGF-1 effect was greater than that of TSH. In addition, we observed that inhibition of PKA and Akt blocked nuclear accumulation of β-catenin in response to TSH and IGF-1 (Figure 2, F and G).
Taken together, these data suggest that β-catenin accumulated in the nucleus in response to TSH and IGF-1 derived from the cell membrane after phosphorylation by PKA/Akt and its consequent release from E-cadherin at the adherens junctions. When we analyzed the pool of β-catenin bound to E-cadherin by Co-IP, we found that TSH, but not IGF-1 reduced the amount of β-catenin interacting with E-cadherin (Figure 3A). These differences may be due to the fact that TSH induced much higher levels of β-catenin phosphorylation at S552 than IGF-1 (Figure 2D) and may reflect the fact that TSH through PKA plays an important role in thyroid cell biology. Furthermore, we confirmed that the β-catenin accumulated in the nucleus in response to TSH and IGF-1 is functional, because the 2 ligands were able to activate transcription of the artificial β-catenin-responsive TopFlash promoter (24). The small but significant increase in promoter activity was similar to that obtained when the cells were incubated with the specific activator Wnt3a but less than that obtained when the cells were incubated with LiCl. Although the induction of the TopFlash reporter activity was low, the mRNA expression levels of cyclin D1 (42), a β-catenin bona fide transcriptional target, significantly increased in the presence of TSH and IGF-1 (Figure 3C). In all cases, the TSH effect was cAMP dependent, because it was mimicked by forskolin. The functional role of TSH/PKA was also corroborated by the fact that TSH increased β-catenin phosphorylation at S675 (Figure 3D), a residue that when phosphorylated recruits the transcriptional coactivator CBP, increasing β-catenin activity. As expected, phosphorylation of S675 was not elicited by IGF-1, because this serine is only phosphorylated by PKA (17).
Figure 3.

TSH decreases β-catenin binding to E-cadherin and increases β-catenin transcriptional activity. A, Top panel: PCCl3 cells were cultured for 2 days in starvation medium and then were treated for 3 hours with TSH or IGF-1. Cell extracts was immunoprecipitated with anti-E-cadherin (IP Ecad) followed by immunoblotting with antibodies against β-catenin and E-cadherin. Lower panel: ratio between β-catenin and E-cadherin. Values represent means ± SEM (n = 3). B, β-Catenin transcriptional activity was measured in PCCl3 cells after treatment with TSH, forskolin (Forsk), Wnt3A, IGF-1, TSH+IGF-1 (T+I), or LiCl for 24 hours, transfecting the Super8x TopFlash (Top) or Super8x FopFlash (For) vector. The results show fold induction of the Top/Fop ratio with respect to nontreated cells (−). Values represent means ± SEM (n = 3). C, Relative expression of cyclin D1 mRNA after 9 hours of TSH, forskolin, or IGF-1 stimulation by means of quantitative RT-PCR. The results show the fold induction with respect to that of nontreated cells (−). Significance of differences: *, P < .05; **, P < .01; and ***, P < .001 by Student t test. D, Cells were pretreated with H89 for 1 hour and then treated for 30 minutes with TSH and IGF-1. Total protein extracts were analyzed by Western blot using anti-pS675-β-catenin and anti-β-catenin.
The effects of TSH and IGF-1 (increased cytoplasmic and nuclear β-catenin accumulation, phosphorylation of GSK3β-S9 and β-catenin-S552, and increased transcriptional activity) were reproduced in FRTL5 cells (Supplemental Figure 2); these data reinforce the importance of these pathways in thyroid function. Because the results were similar in both cell lines, we focused on PCCl3 cells in the rest of the present study.
β-Catenin mediates TSH- and IGF-1–induced thyroid cell proliferation through cyclin D1 expression
TSH and IGF-1 are the 2 main regulators of thyroid cell proliferation. They induce cells to enter the S phase of the cell cycle and orchestrate coordinately c-myc and cyclin D1 gene expression (1). Because these 2 cell cycle genes are classic targets of β-catenin/TCF (42, 43), we asked whether β-catenin could mediate the effects of TSH and IGF-1 on thyroid cell proliferation. We performed a loss-of-function experiment by stably inhibiting β-catenin expression using a lentivirus expressing an shRNA against β-catenin mRNA. The decrease in β-catenin levels reduced BrdU incorporation significantly in response to TSH, IGF-1, or both, suggesting the involvement of this protein in the induction of DNA synthesis (Figure 4A). Parallel to the decrease in β-catenin, there was a significant reduction in cyclin D1 levels in response to the 2 stimuli (Figure 4, B and G). Cyclin D1 expression is activated by the β-catenin-TCF complex through Wnt-responsive elements (WREs) located in its promoter (42). To know whether β-catenin modulates cyclin D1 transcription by TCF binding, a dominant-negative form of TCF4 that does not bind β-catenin (35), was stably expressed in PCCl3 cells. As shown in Figure 4, C and G, inhibition of the β-catenin-TCF complex decreased cyclin D1 to almost undetectable levels, even after stimulation with TSH and IGF-1. Therefore, the induced DNA synthesis in response to both ligands was significantly reduced (Figure 4A).
Figure 4.

β-Catenin mediates cyclin D1 expression and DNA synthesis induced by TSH and IGF-1. PCCl3 cells infected with the indicated lentiviral particles (shscramble, shβ-catenin [shβ-cat], the dominant negative form of TCF4 [dnTCF4], and β-catA4, respectively) were cultured for 2 days in starvation medium (−). A, Cells were stimulated with TSH, IGF-1, or TSH+IGF-1 (T+I) for 24 hours and treated for the measurement of BrdU incorporation. The results show BrdU incorporation relative to that of the cells infected with the vehicle vector (shscramble) without stimulation. BrdU incorporation induced by TSH, IGF-1, or both in the control cells was compared with the induction in shβ-cat, dnTCF4, and β-catA4 PCCl3 cells. Significance of differences: *, P < .05–.01; **, P < .01; and ***, P < .001 by Student t test. Values represent means ± SEM (n = 3). B and C, Cells were treated with TSH (T), forskolin (F), or IGF-1 (I) for 12 hours; total protein was extracted and analyzed by Western blotting for the detection of cyclin D1. Anti-β-catenin was used to assess the efficiency of the interference and anti-Flag (arrow) was used to assess the expression of the dnTCF4. β-Actin was used as a loading control. D, Protein extracts of PCCl3 β-catenin4A-mCherry (β-catA4) negative (−) and positive (+) cells were analyzed by Western blotting for the detection of β-catenin using AKT1/2 as a loading control. E, PCCl3 β-catA4 (−) and (+) cells were transfected with the Super8x TopFlash (Top) or Super8x FopFlash (Fop) and with Renilla-encoding pRL-CMV vectors; 48 hours later luciferase and Renilla activities were measured. *, P < .05–.01 by Student t test. F, Cells were treated with TSH, forskolin, or IGF-1 for 12 hours, and total protein extracts were analyzed by Western blotting for the detection of cyclin D1. AKT1/2 was used as a loading control. G, Quantification of cyclin D1 protein levels normalized with the loading control. Cyclin D1 protein levels was normalized with the basal levels of the untreated control cells (=1). Significance of differences in TSH, forskolin, and IGF-1 stimulation: *, P < .05–.01; **, P < .01; and ***, P < .001 by Student t test. Values represent means ± SEM (n = 3).
To unequivocally demonstrate that β-catenin directly affects cyclin D1 expression, its levels were analyzed in PCCl3 cells stably expressing a β-catenin mutant resistant to proteasomal degradation; consequently, the mutant protein accumulates in the cytoplasm and nucleus where it activates its target genes (35). Gain of β-catenin function was demonstrated by its overexpression in selected β-catA4 cells (Figure 4D) and by the activation of the Super 8x TopFlash promoter (Figure 4E); these cells showed increased BrdU incorporation (Figure 4A) and cyclin D1 expression (Figure 4, F and G) in response to TSH and IGF-1. Throughout this study, forskolin was used to confirm that the TSH action is cAMP dependent.
We conclude that, despite the modest transcriptional activity of β-catenin after its accumulation in the nucleus in response to TSH/cAMP and IGF-1/PI3K, this protein plays a functional role in regulating thyroid cell proliferation in a TCF-dependent-manner.
β-Catenin regulates expression of the transcription factor Pax8, a marker of the differentiated thyroid
Thyroid follicular cells are a unique system in which proliferation and differentiation are regulated by the same signals (2). We therefore asked whether TSH and IGF-1 regulate thyroid differentiation genes in a β-catenin–dependent manner. We focused our attention on the transcription factor Pax8, because it is the main regulator of thyroid cell differentiation (6) and because it has been described to be regulated by the Wnt/β-catenin pathway in the kidney (44). In addition, several WREs have been described in the Pax8 promoter (Ref. 44 and our in silico studies).
First, Pax8 expression was analyzed in response to TSH, forskolin, and IGF-1 in PCCl3 control or β-catenin–silenced cells. As shown in Figure 5, A and D, in the absence of β-catenin, the expression of Pax8 was undetectable, and no regulation by the ligands studied was observed. To know whether this effect is transcriptionally mediated by the TCF factors, Pax8 expression was analyzed in cells expressing a dominant-negative form of TCF4. We observed decreased levels of Pax8 in response to TSH, forskolin, and IGF-1 (Figure 5, B and D). In line with these results, Pax8 protein levels increased in cells expressing an active β-catenin mutant resistant to degradation, even in the absence of the ligands studied (Figure 5, C and D). This increase in Pax8, quantified in Figure 5D, is paralleled by a rise in the membrane protein levels of the NIS which is a well- known Pax8 target. As expected, the increase in NIS in the plasma membrane (Figure 5C) resulted in an increase in its function as determined by an iodide uptake assay (Figure 5E).
Figure 5.

β-Catenin drives the expression of Pax8 in response to TSH and IGF-1. PCCl3 cells infected with lentiviral particles, as indicated in the legend to Figure 4, were cultured for 2 to 4 days in starvation medium. A, B, and C, Cells were treated with TSH (T), forskolin (F), or IGF-1 (I) for 12 hours. Western blotting was performed for analysis of total protein for detection of Pax8 (A, B, and C) or plasma membrane isolated by biotinylation assay for detection of NIS (C). Anti-β-catenin (β-cat) was used to assess the interference efficiency (A) and anti-Flag (arrow) was used to assess expression of the dominant-negative form of TCF4 (dnTCF4) (B). β-Actin and AKT1/2 were used as loading controls (A, B, and C), and NIS plasma membrane was normalized to Na/K ATPase (C). D, Quantification of Pax8 protein levels normalized with the loading control. Pax8 protein levels was normalized with the basal levels of the untreated control cells (equal to 1). Significance of differences in TSH, forskolin, and IGF-1 stimulation: *, P < .05–.01; **, P < .01; ***, P < .001; and ns, not significant by Student t test. Values represent means ± SEM (n = 3). E, Cells were grown in starvation medium for 4 days. 125I transport assays were done to measure iodide uptake (NIS activity) in PCCl3 β-cat4A cells left untreated (−) or after 24 hours of treatment with TSH, forskolin (Forsk), or IGF-1. Data represent the means ± SEM of 3 independent experiments performed in triplicate. Differences vs control (β-cat4A−; dark gray bars) for each condition are indicated: *, P < .05; **, P < .01; ***, P < .001.
The results obtained suggest that β-catenin, through its interaction with the transcription factors TCF and LEF, regulates Pax8 expression in thyroid cells. Interestingly, because the increase in Pax8 is paralleled by an increase in NIS, a critical gene in thyroid physiopathology (7), we describe here a novel and important role of β-catenin in thyroid differentiation.
β-Catenin regulates Pax8 transcriptional activity
To obtain further insight into the mechanism of Pax8 regulation by β-catenin, we performed an in silico analysis of the rat Pax8 promoter using the TRANSFACT database (45). This analysis revealed the existence of several consensus sequences for the binding of TCF/LEF. Furthermore, we looked for the existence of other transcription factor binding sites that could play a role in Pax8 transcription and noted the CREB and Nkx2–1 binding sites. Because we had observed in an earlier ChIP-sequence analysis that Pax8 binds to its own promoter, we looked specifically for Pax8 binding sites in the rat Pax8 promoter using the degenerate sequence described previously (34). We found one Pax8 binding site in the proximal rat Pax8 promoter (for a more detailed structure of the promoter, see Figure 6A).
Figure 6.

β-Catenin activates the Pax8 promoter. A, Schematic representation of the rat Pax8 promoter. The drawing shows the binding sites of the transcription factors TCF/LEF, Pax8, Nkx2–1, and CREB identified in silico in the promoter region and in the first exon of the Pax8 gene. B, HeLa cells were transfected with pPax8 minimal promoter (p6Pax8, see panel C) and cotransfected the indicated expression vectors (Pax8, Nkx2–1, or CREB). Results show the fold induction of p6Pax8 with respect to the control (−). Values represent means ± SEM (n = 3). **, P < .01; and ***, P < .001 by Student t test. C, Left panel: schematic representation of the rat Pax8 promoter fragments cloned. The circles indicate 5 putative TCF/LEF binding sites identified in silico (a–e). Right panel: HeLa cells were cotransfected with the indicated promoter-luciferase construct and the expression vector β-catenin-S33Y. D, β-Catenin ChIP in PCCl3 cells grown in complete medium. PCR was performed using specific primers for the Wnt responsive element d (panel C) in the Pax8 promoter. The enrichment of target sequences was calculated as the immunoprecipitation (IP) ratio (arbitrary units) relative to the negative control Afm and normalized to their relative amplification in the input sample.
A series of deletions of the Pax8 promoter were cloned in front of the luciferase reporter gene, and their activities were analyzed by transient transfection into thyroid PCCl3 cells or HeLa cells. The Pax8 promoter constructs showed activity in a tissue-specific manner, because luciferase activity was clearly higher in thyroid cells than in HeLa cells (not shown). The constructs containing the first intron showed the most activity. This observation is important for our study, because intron 1 of the Pax8 gene contain a functional TCF-binding site in kidney cells (44). In addition, the proximal Pax8 promoter (Figure 6A), which included the first intron, also contains Nkx2–1, Pax8, and CREB binding sites that were functional, as demonstrated in cotransfection assays (Figure 6B). These data therefore demonstrate an autoregulatory effect of Pax8 on its own promoter besides a cooperative effect of Pax8 with Nkx2–1 or CREB.
To study the relevance of the TCF sites identified in the Pax8 promoter, constructs with or without the intron were transfected into HeLa cells alone or together with a vector expressing a constitutively active form of β-catenin resistant to proteasome degradation (β-cat-S33Y). β-Catenin (S33Y) increased Pax8 promoter activity 1.5- to 6-fold, and this activation was significantly higher in the constructs containing the intron fragment (p4Pax8 and p6Pax8) (Figure 6C). The in vivo action of β-catenin on the Pax8 promoter was demonstrated by ChIP–quantitative PCR assays (Figure 6D), using an anti-β-catenin antibody and specific primers to amplify the most conserved WRE site within the Pax8 promoter (site d in Figure 6C). These data show the existence of functional WREs within the Pax8 promoter and reinforce the idea that β-catenin–TCF complexes increase Pax8 transcription.
β-Catenin cooperates and interacts with Pax8
Taking into consideration the fact that β-catenin regulates Pax8 promoter activity and that TCF, Nkx2–1, and Pax8 binding sites are near each other in this promoter, we asked whether cross talk between these transcription factors could play a role in Pax8 regulation and consequently in thyroid cell differentiation. As shown in Figure 7A, transfection of HeLa cells with vectors expressing Pax8 or Nkx2–1 increased the activity of a transfected Pax8 promoter. Cotransfection of these cells with β-catenin further increased Pax8-induced but not Nkx2–1-induced promoter activity. The fact that the Pax8 promoter construct (p5Pax8) used in this assay does not respond to β-catenin alone (Figure 6C), suggests β-catenin may act as a coactivator of Pax8.
Figure 7.

β-Catenin enhances Pax8 transcriptional activity in response to TSH by a direct interaction. A–C, HeLa cells were cotransfected with the indicated promoter construct and the vector expressing Pax8, Nkx2-1, β-catenin (β-cat), or β-catenin-S33Y (β-cat-S33Y). Results show the fold induction of each promoter with respect to its control (−). D and E, PCCl3 cells were cotransfected with the indicated promoter-luciferase construct and the β-catenin-S33Y expression vector. Twenty-four hours later, medium was replaced by starvation medium for 48 hours, and cells were treated with TSH or forskolin (Forsk) for 24 hours. Results show the fold induction of each promoter with respect to the nontreated cells (−). Values represent means ± SEM (n = 3). *, P < .05; **, P < .01; ***, P < .001; and ns, not significant by Student t test. F, 250 μg of PCCl3 nuclear extracts was immunoprecipitated (IP) with anti-Pax8 and anti-IgG, followed by immunoblotting with antibodies against β-catenin and Pax8.
To examine this hypothesis further, Pax8 transcriptional activity was assayed in the presence or absence of a β-catenin expression vector (β-cat-S33Y) using the artificial reporter gene Cp5-Luc, which contains 5 tandem repeats of Pax8 binding sites (23). As expected, Pax8 alone increased Cp5 promoter activity, but this increase was significantly higher when β-cat-S33Y was cotransfected (Figure 7B). To verify that this cooperation also takes place on a natural promoter, NIS promoter (rNUE2.8-NIS) activity was assayed. Again, Pax8 induction of NIS promoter activity was significantly increased when β-cat-S33Y was cotransfected (Figure 7C); in the absence of Pax8, β-catenin did not increase the activity of either the Cp5 or the rNUE2.8-NIS promoter.
To examine whether β-catenin coactivation is conserved in a thyroid context, the effect of TSH/cAMP on the activities of the Cp5 and the rNUE2.8-NIS promoter constructs transfected into thyroid cells was studied. As shown in Figure 7, D and E, TSH increased the activity of both promoters, and the effect was mimicked by forskolin. Interestingly, β-catenin (β-cat-S33Y) increased the promoter activities in response to TSH and forskolin. These results suggest cooperation between β-catenin and Pax8 in the activation of Pax8 target genes that was confirmed by Co-IP assays (Figure 7F).
In summary, this article provides the first description of an important role of β-catenin in thyroid function, which includes control of proliferation and differentiation.
Discussion
The control of thyroid cell proliferation and differentiation is a major issue in thyroid biology. Although these processes have been studied in detail, they still are not fully understood. The key regulator of both processes is TSH, a hormone that after binding to its G protein–coupled receptor activates the cAMP/PKA pathway (1) and the PI3K/Akt pathway (4). TSH action is enhanced by IGF-1, a growth factor that exerts its action in thyroid cells mainly via PI3K/Akt (21). The molecular mechanisms of TSH and IGF-1 action are also not fully understood. Thus, the search for new molecules that can mediate and integrate both pathways is still a challenge in the thyroid field.
Here, we demonstrate for the first time that both TSH and IGF-1 are able to induce nuclear accumulation of β-catenin and consequently its transcriptional activity, resulting in the control of thyroid proliferation and differentiation. This novel action of β-catenin takes place in a Wnt-independent manner. Although PCCl3 and FRTL5 thyroid cells express various components of the Wnt pathway, we did not detect expression of members of the canonical Wnt pathway in PCCl3cells, whereas only Wnt7A was detected in FRTL5 cells (Supplemental Figure 1). This finding contrasts with observations made by other authors who reported that TSH increased canonical Wnt-1 in FRTL5 cells (12). We believe that the mechanism we describe here is important in thyroid function, because it was observed not only in the 2 main thyroid cell lines used in research but also in primary cultures of mouse thyroid cells (not shown).
The phosphorylation of β-catenin is elicited in vivo by the 2 main regulators of thyroid function through their downstream effectors. Thus, TSH induced β-catenin phosphorylation at S552 and S675 through PKA, whereas IGF-1 induced S552 phosphorylation in an Akt-dependent manner. It is important to note that the TSH effect on S552 is more prominent than the effect elicited by IGF-1. We believe that the differences observed between TSH and IGF-1 action reflect the notion that TSH is the main regulator of thyroid cell proliferation and that IGF-1 plays a cooperative role in this process (1). Phosphorylation of these serines results in rapid increases in cytoplasmic and nuclear β-catenin. Phosphorylation at these sites has been reported in other cells systems (15–17), as well as in pathological situations such as cancer (46, 47).
Phosphorylation of β-catenin at S552 has been associated mainly with the activation of the PI3K/Akt pathway (15, 16) in cancer cells (47, 48), favoring its stabilization in the cytoplasm through interaction with the scaffolding protein 14–3-3ζ. It also has been reported that PKA is able to phosphorylate S552 (17), but the significance of this finding is not well understood. Our data suggest that TSH induces β-catenin phosphorylation at S552 through the cAMP/PKA pathway by regulating its binding to E-cadherin. PKA-mediated phosphorylation of β-catenin at S675 increases its transcriptional activity by facilitating its interaction with CBP and TCF (17, 49).
These data are also in agreement with studies showing that TSH and IGF-1, via PKA and PI3K/Akt, phosphorylate GSK3β at S9, inhibiting its activity and consequently increasing thyroid cell proliferation (9, 10). It is a matter of controversy whether inhibition of GSK3β affects the pool of GSK3β involved in β-catenin degradation (50). In our study, we did not detect any variation in the GSK3β-mediated β-catenin phosphorylation, but we did detect an increase in CK1-mediated phosphorylation in response to TSH/cAMP. This increase did not correlate with a decrease in total β-catenin levels. Several studies have suggested that both PKA and CK1 phosphorylate S45 without affecting β-catenin stability (49, 51), but new studies are necessary to understand the function of this phosphorylation event.
Our data suggest that the β-catenin accumulated in the nucleus, at least in response to TSH, is derived from the cell membrane after phosphorylation by PKA and its consequent release from E-cadherin at the adherens junctions. More studies are required to understand the mechanism by which IGF-1 induces nuclear accumulation of β-catenin. Furthermore, these data do not suggest that this phosphorylation affects the degradation of β-catenin mediated by the destruction complex.
The β-catenin accumulated in the nucleus is transcriptionally active and although the activity was not high, it is significant and comparable to the activation induced by Wnt3A, a classic activator of the pathway. Furthermore, β-catenin activation results in increased expression of one of its target genes, cyclin D1 (42), as demonstrated in loss-of-function and gain-of-function experiments. Accordingly, in β-catenin–silenced thyroid cells, proliferation in response to TSH and IGF-1 is impaired. This effect involves an interaction with TCF transcription factors, because expression of a dominant-negative form of TCF4 also reduces cyclin D1 expression in response to both stimuli. In contrast, expression of a constitutively active β-catenin mutant resistant to proteasomal degradation induces cyclin D1, even in the absence of TSH and IGF-1, confirming that cyclin D1 is a target gene of β-catenin in thyroid cells. These data point to β-catenin as a common effector of PKA and PI3K/Akt, which implies the existence of a novel mechanism of regulation of thyroid cell proliferation. These results, together with the results of our recent study showing that forkhead box O1 (FoxO1) mediates thyroid cell proliferation by inhibiting the tumor suppressor gene p27 (20), underscore the complexity of the mechanisms that regulate thyroid cell proliferation.
Thyroid differentiation is defined by the expression of specific transcription factors and thyroid genes, which ultimately regulate the production of thyroid hormones (6). We focused our attention on the transcription factor Pax8 and its target gene, the sodium iodide symporter (NIS), because this gene plays a relevant role in thyroid physiology as well as in the diagnosis and therapy of thyroid cancer (7). In addition, Pax8 plays a critical role in thyroid development, controlling the proliferation and survival of thyroid progenitor cells and controlling differentiation (52) and proliferation in the adult (53). Interestingly, Pax8 is expressed in the kidney, a tissue in which the Wnt pathway plays an important role (44, 54). By gain-of-function and loss-of-function experiments, we provide clear evidence that in the thyroid β-catenin regulates Pax8 and consequently NIS expression, which results in increased iodide uptake. This observation has important pathophysiological implications. Thus, in differentiated thyroid tumors, in which it has been shown that membrane β-catenin is reduced (55), treatment with lithium is used to increase iodide uptake (56). Our data provide an explanation of the molecular mechanism of lithium action in the treatment of thyroid tumors, demonstrating that increased iodide uptake can take place through a β-catenin–mediated induction of Pax8 and NIS function.
To gain further insight into this mechanism, we cloned the Pax8 promoter and observed several functional TCF/LEF binding sites, as well as binding sites for Pax8 itself and for other transcription factors, such Nkx2–1 and CREB. Using ChIP we demonstrated the in vivo recruitment of β-catenin to the Pax8 promoter in PCCl3 thyroid cells and transfection experiments showed that β-catenin increased Pax8 promoter activity, which was further increased by Pax8, but not by Nkx2–1. These data suggest cooperation between β-catenin and Pax8, and we confirmed this in Co-IP assays. Furthermore, we observed an autoregulatory mechanism of Pax8 expression involving its own promoter, confirming recent data (57). In addition, the observed binding sites for Nkx2–1 and CREB in the Pax8 promoter explain how TSH/cAMP regulates Pax8 expression.
Taken together, our data, as schematized in Figure 8, are consistent with a mechanism in which TSH and IGF-1 phosphorylate β-catenin at S552, which leads to its release from adherens junctions and accumulation in the cytoplasm. Phosphorylation at S675 increases β-catenin transcriptional activity, favoring the expression of target genes involved in both proliferation and differentiation of thyroid cells. The novelty of these data lies in the observation that activation of β-catenin occurs independently of the Wnt pathway. Rather, β-catenin is activated by TSH and IGF-1, the 2 main regulators of thyroid biology. Alterations in signaling downstream of TSH and IGF-1 (PKA and PI3K) are ultimately involved in thyroid cancer, and we believe that our data provide an explanation for the alterations of the Wnt/β-catenin pathway observed in thyroid tumors (38), although the exact mechanism requires further investigation.
Figure 8.

Schematic model summarizing the regulation of β-catenin by TSH and IGF-1 and the processes controlled in thyroid cells. TSH after binding to its receptor (TSHR) activates cAMP/PKA, and IGF-1 after binding to its receptor (IGF-1R) activates PI3K/Akt. Both signals phosphorylate (1) GSK3β-S9, which results in its inactivation, and (2) β-catenin-S552 localized in the adherens junctions, weakening its interaction with E-cadherin and promoting its cytoplasmic localization. In the cytoplasm, TSH/PKA phosphorylates β-catenin-S675, which translocates to the nucleus by a still unknown mechanism. Nuclear p-β-catenin may then interact with coactivators such as CBP and increases the transcriptional activity of TCF transcription factors activating the expression of genes involved in cell proliferation (cyclin D1) or differentiation (Pax8). β-Catenin also increases Pax8 transcriptional activity and consequently the expression of its target gene NIS, contributing to thyroid cell differentiation. The pointed arrows indicate activation and the blunt-ended lines indicate inhibition. The thickness of the lines indicates the intensity of the action of the ligands (TSH or IGF-1) studied.
Acknowledgments
We are grateful to Dr Antonio de la Vieja for his help in setting up the iodide uptake assay and to Dr Ronald Hartong for critical reading of the manuscript and his linguistic assistance. We also owe thanks to the following individuals for kindly providing different reagents: Dr S. Refetoff (University of Chicago, Chicago, Illinois) for human pTGenh/ prom-Luc; Dr M Zannini (Institute of Experimental Endocrinology and Oncology, Consiglio Nazionale delle Ricerche, Naples, Italy) for Cp5-Luc; Dr R. T. Moon (The Howard Hughes Medical Institute, Seattle, Washington) for the Super 8x Top- and Fop-Luc; Dr G. Vassart (Universitè Libre de Bruxelles, Brussels, Belgium) for hPax8; Dr R. Di Lauro (Università degli Studi di Napoli Federico II, Naples, Italy) for rat NKx2.1; Dr B. Vogelstein (Johns Hopkins Kimmel Cancer Center, Baltimore, Maryland) for wild-type or mutated (S33Y) hβ-catenin; Dr R. Perona (Biomedical Research Institute, Madrid, Spain) for lentiviral vector and helper plasmids pMD2-VSVg and pCD/NL-BH; and Dr N. Carrasco (Department of Cellular and Molecular Physiology, Yale School of Medicine, New Haven, Connecticut) for anti-rNIS antibody.
This work was supported by the Dirección General de Proyectos de Investigación (Grant BFU-2010–16025), the Fondo de Investigaciones Sanitarias, Instituto de Salud Carlos III (Grant RD12/0036/0030, and the Comunidad de Madrid (S2011/BMD-2328 TIRONET project) Spain. A.S.-P. holds a predoctoral Formación Profesorado Universitario fellowship from the Spanish Government.
Disclosure Summary: The authors have nothing to disclose.
Funding Statement
This work was supported by the Dirección General de Proyectos de Investigación (Grant BFU-2010–16025), the Fondo de Investigaciones Sanitarias, Instituto de Salud Carlos III (Grant RD12/0036/0030, and the Comunidad de Madrid (S2011/BMD-2328 TIRONET project) Spain. A.S.-P. holds a predoctoral Formación Profesorado Universitario fellowship from the Spanish Government.
Footnotes
- Akti
- Akt inhibitor
- BrdU
- 5-bromo-2′-deoxyuridine
- CBP
- cAMP response element–binding protein–binding protein
- ChIP
- chromatin immunoprecipitation
- CK1
- casein kinase 1
- Co-IP
- coimmunoprecipitation
- CREB
- cAMP response element–binding protein
- DAPI
- 4′,6′-diamino-2-phenylindole
- GSK3β
- glycogen synthase kinase-3β
- h
- human
- LEF
- lymphoid enhancer factor
- NIS
- sodium iodide symporter
- PKA
- protein kinase A
- PI3K
- phosphatidylinositol 3-kinase
- sh
- short hairpin
- TCF
- T-cell factor 4
- WRE
- Wnt responsive element.
References
- 1. Kimura T, Van Keymeulen A, Golstein J, Fusco A, Dumont JE, Roger PP. Regulation of thyroid cell proliferation by TSH and other factors: a critical evaluation of in vitro models. Endocr Rev. 2001;22:631–656. [DOI] [PubMed] [Google Scholar]
- 2. Postiglione MP, Parlato R, Rodriguez-Mallon A, et al. Role of the thyroid-stimulating hormone receptor signaling in development and differentiation of the thyroid gland. Proc Natl Acad Sci USA. 2002;99:15462–15467. [DOI] [PMC free article] [PubMed] [Google Scholar]
- 3. Marians RC, Ng L, Blair HC, Unger P, Graves PN, Davies TF. Defining thyrotropin-dependent and -independent steps of thyroid hormone synthesis by using thyrotropin receptor-null mice. Proc Natl Acad Sci USA. 2002;99:15776–15781. [DOI] [PMC free article] [PubMed] [Google Scholar]
- 4. Zaballos MA, Garcia B, Santisteban P. Gβγ dimers released in response to thyrotropin activate phosphoinositide 3-kinase and regulate gene expression in thyroid cells. Mol Endocrinol. 2008;22:1183–1199. [DOI] [PMC free article] [PubMed] [Google Scholar]
- 5. Blancquaert S, Wang L, Paternot S, et al. cAMP-dependent activation of mammalian target of rapamycin (mTOR) in thyroid cells. Implication in mitogenesis and activation of CDK4. Mol Endocrinol. 2010;24:1453–1468. [DOI] [PMC free article] [PubMed] [Google Scholar]
- 6. De Felice M, Di Lauro R. Minireview: Intrinsic and extrinsic factors in thyroid gland development: an update. Endocrinology. 2011;152:2948–2956. [DOI] [PubMed] [Google Scholar]
- 7. Riesco-Eizaguirre G, Santisteban P. A perspective view of sodium iodide symporter research and its clinical implications. Eur J Endocrinol. 2006;155:495–512. [DOI] [PubMed] [Google Scholar]
- 8. Helmbrecht K, Kispert A, von Wasielewski R, Brabant G. Identification of a Wnt/β-catenin signaling pathway in human thyroid cells. Endocrinology. 2001;142:5261–5266. [DOI] [PubMed] [Google Scholar]
- 9. Tasevski V, Benn D, King M, Luttrell B, Simpson A. Mitogenic effect of lithium in FRTL-5 cells can be reversed by blocking de novo cholesterol synthesis and subsequent signal transduction. Thyroid. 2000;10:305–311. [DOI] [PubMed] [Google Scholar]
- 10. Chen G, Jiang Q, You Z, et al. Regulation of GSK-3β in the proliferation and apoptosis of human thyrocytes investigated using a GSK-3β-targeting RNAi adenovirus expression vector: involvement the Wnt/β-catenin pathway. Mol Biol Rep. 2010;37:2773–2779. [DOI] [PubMed] [Google Scholar]
- 11. Rubinfeld B, Albert I, Porfiri E, Fiol C, Munemitsu S, Polakis P. Binding of GSK3β to the APC-β-catenin complex and regulation of complex assembly. Science. 1996;272:1023–1026. [DOI] [PubMed] [Google Scholar]
- 12. Kim WB, Lewis CJ, McCall KD, et al. Overexpression of Wnt-1 in thyrocytes enhances cellular growth but suppresses transcription of the thyroperoxidase gene via different signaling mechanisms. J Endocrinol. 2007;193:93–106. [DOI] [PubMed] [Google Scholar]
- 13. Fang X, Yu SX, Lu Y, Bast RC Jr, Woodgett JR, Mills GB. Phosphorylation and inactivation of glycogen synthase kinase 3 by protein kinase A. Proc Natl Acad Sci USA. 2000;97:11960–11965. [DOI] [PMC free article] [PubMed] [Google Scholar]
- 14. Valenta T, Hausmann G, Basler K. The many faces and functions of β-catenin. EMBO J. 2012;31:2714–2736. [DOI] [PMC free article] [PubMed] [Google Scholar]
- 15. Fang D, Hawke D, Zheng Y, et al. Phosphorylation of β-catenin by AKT promotes β-catenin transcriptional activity. J Biol Chem. 2007;282:11221–11229. [DOI] [PMC free article] [PubMed] [Google Scholar]
- 16. Tian Q, Feetham MC, Tao WA, et al. Proteomic analysis identifies that 14–3-3ζ interacts with β-catenin and facilitates its activation by Akt. Proc Natl Acad Sci USA. 2004;101:15370–15375. [DOI] [PMC free article] [PubMed] [Google Scholar]
- 17. Taurin S, Sandbo N, Qin Y, Browning D, Dulin NO. Phosphorylation of β-catenin by cyclic AMP-dependent protein kinase. J Biol Chem. 2006;281:9971–9976. [DOI] [PubMed] [Google Scholar]
- 18. Fusco A, Berlingieri MT, Di Fiore PP, Portella G, Grieco M, Vecchio G. One- and two-step transformations of rat thyroid epithelial cells by retroviral oncogenes. Mol Cell Biol. 1987;7:3365–3370. [DOI] [PMC free article] [PubMed] [Google Scholar]
- 19. Ambesi-Impiombato FS, Parks LA, Coon HG. Culture of hormone-dependent functional epithelial cells from rat thyroids. Proc Natl Acad Sci USA. 1980;77:3455–3459. [DOI] [PMC free article] [PubMed] [Google Scholar]
- 20. Zaballos MA, Santisteban P. FOXO1 controls thyroid cell proliferation in response to TSH and IGF-I and is involved in thyroid tumorigenesis. Mol Endocrinol. 2013;27:50–62. [DOI] [PMC free article] [PubMed] [Google Scholar]
- 21. García B, Santisteban P. PI3K is involved in the IGF-I inhibition of TSH-induced sodium/iodide symporter gene expression. Mol Endocrinol. 2002;16:342–352. [DOI] [PubMed] [Google Scholar]
- 22. Pohlenz J, Dumitrescu A, Zundel D, et al. Partial deficiency of thyroid transcription factor 1 produces predominantly neurological defects in humans and mice. J Clin Invest. 2002;109:469–473. [DOI] [PMC free article] [PubMed] [Google Scholar]
- 23. Baratta MG, Porreca I, Di Lauro R. Oncogenic ras blocks the cAMP pathway and dedifferentiates thyroid cells via an impairment of pax8 transcriptional activity. Mol Endocrinol. 2009;23:838–848. [DOI] [PMC free article] [PubMed] [Google Scholar]
- 24. Veeman MT, Axelrod JD, Moon RT. A second canon. Functions and mechanisms of β-catenin-independent Wnt signaling. Dev Cell. 2003;5:367–377. [DOI] [PubMed] [Google Scholar]
- 25. Vilain C, Rydlewski C, Duprez L, et al. Autosomal dominant transmission of congenital thyroid hypoplasia due to loss-of-function mutation of PAX8. J Clin Endocrinol Metab. 2001;86:234–238. [DOI] [PubMed] [Google Scholar]
- 26. Guazzi S, Price M, De Felice M, Damante G, Mattei MG, Di Lauro R. Thyroid nuclear factor 1 (TTF-1) contains a homeodomain and displays a novel DNA binding specificity. EMBO J. 1990;9:3631–3639. [DOI] [PMC free article] [PubMed] [Google Scholar]
- 27. Méndez-Pertuz M, Sánchez-Pacheco A, Aranda A. The thyroid hormone receptor antagonizes CREB-mediated transcription. EMBO J. 2003;22:3102–3112. [DOI] [PMC free article] [PubMed] [Google Scholar]
- 28. Morin PJ, Sparks AB, Korinek V, et al. Activation of β-catenin-Tcf signaling in colon cancer by mutations in β-catenin or APC. Science. 1997;275:1787–1790. [DOI] [PubMed] [Google Scholar]
- 29. Chen CA, Okayama H. Calcium phosphate-mediated gene transfer: a highly efficient transfection system for stably transforming cells with plasmid DNA. Biotechniques. 1988;6:632–638. [PubMed] [Google Scholar]
- 30. Perona R, Montaner S, Saniger L, Sánchez-Pérez I, Bravo R, Lacal JC. Activation of the nuclear factor-kappaB by Rho, CDC42, and Rac-1 proteins. Genes Dev. 1997;11:463–475. [DOI] [PubMed] [Google Scholar]
- 31. De La Vieja A, Ginter CS, Carrasco N. The Q267E mutation in the sodium/iodide symporter (NIS) causes congenital iodide transport defect (ITD) by decreasing the NIS turnover number. J Cell Sci. 2004;117:677–687. [DOI] [PubMed] [Google Scholar]
- 32. Bradford MM. A rapid and sensitive method for the quantitation of microgram quantities of protein utilizing the principle of protein-dye binding. Anal Biochem. 1976;72:248–254. [DOI] [PubMed] [Google Scholar]
- 33. De la Vieja A, Ginter CS, Carrasco N. Molecular analysis of a congenital iodide transport defect: G543E impairs maturation and trafficking of the Na+/I− symporter. Mol Endocrinol. 2005;19:2847–2858. [DOI] [PubMed] [Google Scholar]
- 34. Ruiz-Llorente S, Carrillo Santa de Pau E, Sastre-Perona A, et al. Genome-wide analysis of Pax8 binding provides new insights into thyroid functions. BMC Genomics. 2012;13:147. [DOI] [PMC free article] [PubMed] [Google Scholar]
- 35. Fuerer C, Nusse R. Lentiviral vectors to probe and manipulate the Wnt signaling pathway. PLoS One. 2010;5:e9370. [DOI] [PMC free article] [PubMed] [Google Scholar]
- 36. Dull T, Zufferey R, Kelly M, et al. A third-generation lentivirus vector with a conditional packaging system. J Virol. 1998;72:8463–8471. [DOI] [PMC free article] [PubMed] [Google Scholar]
- 37. Zhang XY, La Russa VF, Reiser J. Transduction of bone-marrow-derived mesenchymal stem cells by using lentivirus vectors pseudotyped with modified RD114 envelope glycoproteins. J Virol. 2004;78:1219–1229. [DOI] [PMC free article] [PubMed] [Google Scholar]
- 38. Sastre-Perona A, Santisteban P. Role of the wnt pathway in thyroid cancer. Front Endocrinol (Lausanne). 2012;3:31. [DOI] [PMC free article] [PubMed] [Google Scholar]
- 39. Stambolic V, Ruel L, Woodgett JR. Lithium inhibits glycogen synthase kinase-3 activity and mimics wingless signalling in intact cells. Curr Biol. 1996;6:1664–1668. [DOI] [PubMed] [Google Scholar]
- 40. Shibamoto S, Higano K, Takada R, Ito F, Takeichi M, Takada S. Cytoskeletal reorganization by soluble Wnt-3a protein signalling. Genes Cells. 1998;3:659–670. [DOI] [PubMed] [Google Scholar]
- 41. Brewer C, Yeager N, Di Cristofano A. Thyroid-stimulating hormone initiated proliferative signals converge in vivo on the mTOR kinase without activating AKT. Cancer Res. 2007;67:8002–8006. [DOI] [PubMed] [Google Scholar]
- 42. Tetsu O, McCormick F. β-Catenin regulates expression of cyclin D1 in colon carcinoma cells. Nature. 1999;398:422–426. [DOI] [PubMed] [Google Scholar]
- 43. He TC, Sparks AB, Rago C, Hermeking H, Zawel L, da Costa LT, Morin PJ, Vogelstein B, Kinzler KW. Identification of c-MYC as a target of the APC pathway. Science. 1998;281:1509–1512. [DOI] [PubMed] [Google Scholar]
- 44. Schmidt-Ott KM, Masckauchan TN, Chen X, et al. β-Catenin/TCF/Lef controls a differentiation-associated transcriptional program in renal epithelial progenitors. Development. 2007;134:3177–3190. [DOI] [PubMed] [Google Scholar]
- 45. Wingender E, Chen X, Hehl R, et al. TRANSFAC: an integrated system for gene expression regulation. Nucleic Acids Res. 2000;28:316–319. [DOI] [PMC free article] [PubMed] [Google Scholar]
- 46. Kobielak K, Stokes N, de la Cruz J, Polak L, Fuchs E. Loss of a quiescent niche but not follicle stem cells in the absence of bone morphogenetic protein signaling. Proc Natl Acad Sci USA. 2007;104:10063–10068. [DOI] [PMC free article] [PubMed] [Google Scholar]
- 47. Guturi KK, Mandal T, Chatterjee A, et al. Mechanism of β-catenin-mediated transcriptional regulation of epidermal growth factor receptor expression in glycogen synthase kinase 3β-inactivated prostate cancer cells. J Biol Chem. 2012;287:18287–18296. [DOI] [PMC free article] [PubMed] [Google Scholar]
- 48. Lee G, Goretsky T, Managlia E, et al. Phosphoinositide 3-kinase signaling mediates β-catenin activation in intestinal epithelial stem and progenitor cells in colitis. Gastroenterology. 2010;139:869–881, 881.e1–9. [DOI] [PMC free article] [PubMed] [Google Scholar]
- 49. Hino S, Tanji C, Nakayama KI, Kikuchi A. Phosphorylation of β-catenin by cyclic AMP-dependent protein kinase stabilizes β-catenin through inhibition of its ubiquitination. Mol Cell Biol. 2005;25:9063–9072. [DOI] [PMC free article] [PubMed] [Google Scholar]
- 50. Ng SS, Mahmoudi T, Danenberg E, Bejaoui I, et al. Phosphatidylinositol 3-kinase signaling does not activate the wnt cascade. J Biol Chem. 2009;284:35308–35313. [DOI] [PMC free article] [PubMed] [Google Scholar]
- 51. Kang DE, Soriano S, Xia X, et al. Presenilin couples the paired phosphorylation of β-catenin independent of axin: implications for β-catenin activation in tumorigenesis. Cell. 2002;110:751–762. [DOI] [PubMed] [Google Scholar]
- 52. Pasca di Magliano M, Di Lauro R, Zannini M. Pax8 has a key role in thyroid cell differentiation. Proc Natl Acad Sci USA. 2000;97:13144–13149. [DOI] [PMC free article] [PubMed] [Google Scholar]
- 53. Rossi DL, Acebrón A, Santisteban P. Function of the homeo and paired domain proteins TTF-1 and Pax-8 in thyroid cell proliferation. J Biol Chem. 1995;270:23139–23142. [DOI] [PubMed] [Google Scholar]
- 54. Park JS, Valerius MT, McMahon AP. Wnt/β-catenin signaling regulates nephron induction during mouse kidney development. Development. 2007;134:2533–2539. [DOI] [PubMed] [Google Scholar]
- 55. Garcia-Rostan G, Camp RL, Herrero A, Carcangiu ML, Rimm DL, Tallini G. β-Catenin dysregulation in thyroid neoplasms: down-regulation, aberrant nuclear expression, and CTNNB1 exon 3 mutations are markers for aggressive tumor phenotypes and poor prognosis. Am J Pathol. 2001;158:987–996. [DOI] [PMC free article] [PubMed] [Google Scholar]
- 56. Pons F, Carrió I, Estorch M, Ginjaume M, Pons J, Milian R. Lithium as an adjuvant of iodine-131 uptake when treating patients with well-differentiated thyroid carcinoma. Clin Nucl Med. 1987;12:644–647. [DOI] [PubMed] [Google Scholar]
- 57. di Gennaro A, Spadaro O, Baratta MG, De Felice M, Di Lauro R. Functional analysis of the Pax8 promoter reveals autoregulation and the presence of a novel thyroid-specific DNA binding activity. Thyroid. 2013;23:488–496. [DOI] [PubMed] [Google Scholar]