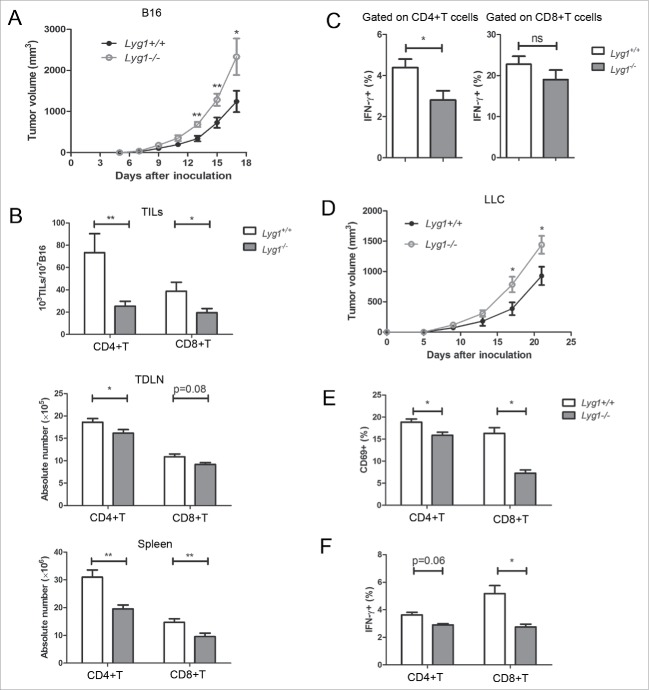
Figure 6.
Lyg1 knockout accelerates in vivo tumor growth and inhibits tumor-specific T cell immune responses. (A) B16 tumor progression in Lyg1−/− and Lyg1+/+ mice. (B) The numbers of CD4+ T and CD8+ T cells in the TILs, TDLNs, and spleens. (C) IFNγ production by T cells in the spleens of tumor-bearing mice. n = 10–12 per group for A–C. (D) LLC-1 tumor progression in Lyg1−/− and Lyg1+/+ mice, n = 4–5 per group. (E) The expression of CD69 and (F) IFNγ on tumor antigen-specific CD4+ T cells in Lyg1−/− mice and Lyg1+/+ mice on day 5 as described methods in Fig. 5, n = 3 per group. Data are expressed as the mean ± SEM, *p < 0.05 and **p < 0.01 compared with Lyg1+/+ mice.

