

ABSTRACT
The immune system plays a pivotal role in the development and progression of colorectal cancer (CRC). Tumor immune rejection has been previously linked to the activation of the interferon-stimulated genes (ISG) STAT1, IRF-5 and IRF-1. Specific immunoregulatory microRNAs (miRNAs) may impact the expression of these ISG in the tumor microenvironment. In this translational study, we develop a digital image analysis protocol to identify the ISG-gene expression signature and investigate miRNA expression in the immediate environment of invading cancer cells. Digital immunophenotyping was performed using next generation tissue microarrays from 241 well-characterized CRC patients and analyzed with clinicopathological and molecular information. Active ISG signaling in the tumor stroma differentiated an immune-activated (n = 178) and a quiescent (n = 43) phenotype. The activated phenotype was associated with high counts of intratumoral CD8+ cytotoxic T-lymphocytes (CTL; p = 0.007) and expression of the immune effector molecules granzyme B (p < 0.001) and perforin (p = 0.020). Immune-activated tumors also showed an elevated expression of the intercellular adhesion molecule-1 (ICAM-1, p = 0.006) which may facilitate CTL infiltration. Patients with immune-activated CRC had a considerably reduced risk of developing distant metastases (p = 0.001, OR = 0.034, 95%CI = 0.006–0.183). High expression of the immunoregulatory miR-34a and miR-93 corresponded to a 2–2.5-fold decrease of STAT1 (p = 0.006) and IRF-1 (p = 0.058), a feature more commonly seen in a quiescent microenvironment. Analysis of a combined ISG marker profile by digital pathology stratifies CRC patients into diametrically opposed immune phenotypes. Targeted inhibition of miRNAs within the tumor microenvironment may form a new strategy to stimulate the anti-tumoral immune response.
KEYWORDS: Colorectal cancer, digital image analysis, digital pathology, immunotherapy, metastasis, microRNA, tumor microenvironment
Introduction
Tumor–host interaction greatly impacts disease progression and clinical outcome in CRC. Recent studies have identified a stage-independent survival advantage of CRC patients with abundant CD8+ cytotoxic T-lymphocytes (CTL) in the tumor microenvironment.1-4 Disinhibition of the anti-tumoral T-cell response by immune checkpoint blockade of the programmed death 1 (PD-1) pathway has shown remarkable therapeutic promise for patients with mismatch repair (MMR) deficient tumors that are characterized by a high frequency of somatic mutations.5 An interdependence of the tumor mutational landscape and the anti-tumoral immune response is also highlighted by recent large scale cancer genomic projects that have identified a correlation between the expression of immunomodulatory molecules, CTL infiltration and increased mutational load.6 While previous studies have focused on somatic tumor mutations and tumor immunogenicity, little is known about the impact of epigenetic gene regulation mechanisms on the expression of pro-inflammatory genes in the microenvironment of CRC.7
Intratumoral T-cell infiltration is driven by an inflamed tumor microenvironment characterized by ISG transcription, expression of immunostimulatory cytokines and T-cell attractants.8 Interferon production by antigen-presenting cells in the tumor stroma is induced by the release of exogenous and endogenous damage signals during malignant transformation.9 Cellular responses to interferon are mediated by activation of the Janus kinase-signal transducer and activator of transcription (JAK-STAT) pathway.10 STAT proteins are the principle signaling proteins for inflammatory cytokines and are of central importance for immune cell differentiation and function.11 In particular, induction of STAT1 gene expression by interferon is required for differentiation of antitumor CTLs in vivo.12 Activated CTLs promote tumor immune rejection through expression of cytolytic molecules such as perforin and granzyme B.8,13 Interferon signaling also stimulates interferon response factors (IRFs). IRFs induce anti-proliferative and pro-apoptotic transcriptional programs in human cancer cells and regulate innate and adaptive anti-tumoral immune effector functions.14,15 Specifically, the interferon-induced upregulation of intercellular adhesion molecule-1 (ICAM-1) may have a critical role in the regulation of CTL infiltration into human tumors.16,17
Activation of the ISGs is therefore considered a central constituent of the immunologic signature of rejection in human cancers.8 Importantly, STAT1, IRF-1 and IRF-5 have been experimentally confirmed as the target of miR-34a-5p, miR-93–5p and miR-146a-5p.18-22 miRNAs are highly conserved short, non-coding RNA oligonucleotides that regulate the expression of over 60% of protein-coding genes.23-25 Due to their high abundance in CRC, miR-34a-5p, miR-93–5p and miR-146a-5p could impact the immune phenotype and prognosis of CRC patients through epigenetic control of interferon signaling.26-28 However, the regulation of ISG transcription in the tumor microenvironment has not been comprehensively studied. This may partially be due to the difficulty of separating tumor and stromal contributions to the CRC transcriptome in high-throughput sequencing analyses.29
The aim of this translational study was therefore (1) to develop a digital pathology image analysis protocol to stratify immunophenotypes of CRC, (2) to analyze miRNA expression in the immediate environment of invading cancer cells and (3) to evaluate the impact of interferon signaling on clinicopathological features and disease progression in a well characterized CRC patient cohort.
Results
Detection of stromal STAT1, IRF-1 and IRF-5 expression patterns in normal colonic tissue and CRC by immunohistochemistry and digital image analysis
Digital image analysis identified a mixed cytoplasmic and nuclear staining of STAT1 and IRF-1 in the tumor stroma. Average IRF-1 and STAT1 expression was increased in tumor-associated stroma compared with normal tissue (p < 0.0001). IRF-5 predominantly showed a mixed nuclear and cytoplasmic staining pattern. In contrast to IRF-1, average IRF-5 expression was decreased in tumor stroma (p < 0.0001). Examples of all IHC detection reactions are shown in (Fig. 1).
Figure 1.
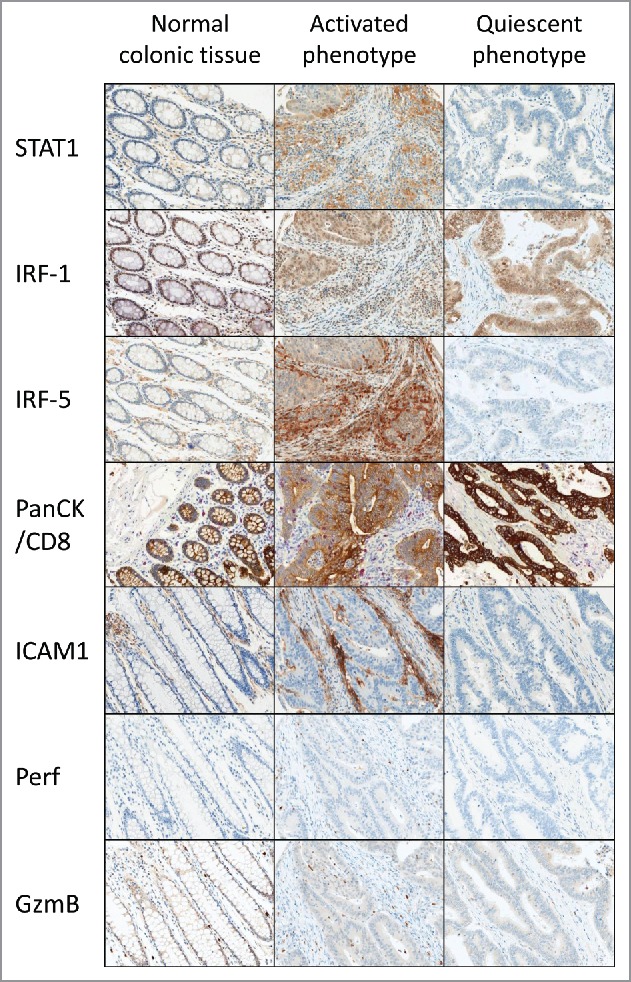
Expression of protein markers in the CRC microenvironment of normal and neoplastic tissue defined as having an activated or a quiescent immune phenotype. The classification is based on a combined expression score of STAT1, IRF-1 and IRF-5 (rows 1–3). Two cases are shown throughout. The normal colonic tissue control of the case with an activated immune phenotype is shown. Immunoactive cases are characterized by a significantly increased infiltration of activated CD8+ CTL (row 4) showing expression of perforin and granzyme B effector molecules (rows 5–6).
Association of stromal STAT1, IRF-1 and IRF-5 expression with clinicopathological features
Increased STAT1, IRF-1 and IRF-5 expression in the tumor stroma of CRC was correlated with a decreased likelihood of distant metastasis (STAT1: p = 0.006, OR: 0.951, 95%CI: 0.918–0.985; IRF-1: p = 0.014, OR: 0.967, 95%CI: 0.942–0.993; IRF-5: p = 0.009, OR: 0.964, 95%CI: 0.937–0.991). STAT1 and IRF-5 expression were negatively less frequent in tumors of the sigmoid colon and rectum. (STAT1: p = 0.013, OR: 0.980, 95%CI: 0.964–0.996; IRF-5: p = 0.027, OR: 0.981, 95%CI: 0.965–0.998). IRF-1 positively correlated with increased patient age (p = 0.013, OR: 1.03, 95%CI: 1.01–1.05). Patients with high STAT1 expression were more likely to have a MSI-H status (p = 0.039, OR: 1.02, 95%CI: 1.001–1.042). The associations of STAT1, IRF-1 and IRF-5 with clinicopathological features and markers of immune activation are shown in (Table 1).
Table 1.
Association of the immune-active phenotype with clinicopathological and molecular features of CRC (n = 241).
| Immune-active phenotype |
STAT1 |
IRF-1 |
IRF-5 |
|||||||||||
|---|---|---|---|---|---|---|---|---|---|---|---|---|---|---|
| Feature | # | p value | OR | 95%CI | p value | OR | 95%CI | p value | OR | 95%CI | p value | OR | 95%CI | |
| Sex | Male | 135 | 1.00 | 1.00 | 1.00 | 1.00 | ||||||||
| Female | 85 | 0.037 | 1.80 | 1.037–3.110 | 0.145 | 1.01 | 0.996–1.025 | 0.990 | 1.00 | 0.981–1.019 | 0.873 | 1.00 | 0.968–1.017 | |
| Patient age | < 69 years | 93 | 1.00 | 1.00 | 1.00 | 1.00 | ||||||||
| > 69 years | 126 | 0.154 | 1.49 | 0.862–2.561 | 0.414 | 1.01 | 0.992–1.020 | 0.013 | 1.03 | 1.005–1.045 | 0.427 | 1.01 | 0.991–1.022 | |
| Tumor size (cm) | < 4.56 cm | 33 | 1.00 | 1.00 | 1.00 | 1.00 | ||||||||
| > 4.56 cm | 19 | 0.122 | 0.38 | 0.111–1.296 | 0.618 | 0.99 | 0.965–1.022 | 0.375 | 0.98 | 0.930–1.028 | 0.264 | 0.98 | 0.945–1.016 | |
| Histological subtype | Non-mucinous | 187 | 1.00 | 1.00 | 1.00 | 1.00 | ||||||||
| Mucinous | 33 | 0.192 | 1.62 | 0.779–3.453 | 0.964 | 1.00 | 0.980–1.019 | 0.233 | 0.99 | 0.961–1.010 | 0.175 | 1.02 | 0.994–1.036 | |
| Tumor grade | G1–2 | 158 | 1.00 | 1.00 | 1.00 | 1.00 | ||||||||
| G3 | 62 | 0.841 | 1.06 | 0.588–1.918 | 0.365 | 1.01 | 0.992–1.022 | 0.478 | 0.99 | 0.973–1.013 | 0.488 | 1.01 | 0.989–1.023 | |
| Tumor location | Right | 85 | 1.00 | 1.00 | 1.00 | 1.00 | ||||||||
| Left | 99 | 0.014 | 0.48 | 0.263–0.859 | 0.013 | 0.98 | 0.964–0.996 | 0.599 | 1.00 | 0.975–1.015 | 0.027 | 0.98 | 0.965–0.998 | |
| pT | pT1–2 | 37 | 1.00 | 1.00 | 1.00 | 1.00 | ||||||||
| pT3–4 | 182 | 0.777 | 0.90 | 0.444–1.835 | 0.511 | 0.99 | 0.976–1.012 | 0.395 | 1.01 | 0.987–1.035 | 0.678 | 1.00 | 0.976–1.016 | |
| pN | pN0 | 90 | 1.00 | 1.00 | 1.00 | 1.00 | ||||||||
| pN1–2 | 130 | 0.716 | 0.90 | 0.527–1.553 | 0.439 | 0.99 | 0.981–1.009 | 0.625 | 1.01 | 0.986–1.024 | 0.327 | 0.99 | 0.977–1.008 | |
| pM | pM0 | 194 | 1.00 | 1.00 | 1.00 | 1.00 | ||||||||
| pM1 | 26 | 0.002 | 0.14 | 0.039–0.471 | 0.006 | 0.95 | 0.918–0.985 | 0.014 | 0.97 | 0.942–0.993 | 0.009 | 0.96 | 0.937–0.991 | |
| Lymphatic invasion | L0 | 47 | 1.00 | 1.00 | 1.00 | 1.00 | ||||||||
| L1–2 | 158 | 0.762 | 0.90 | 0.470–1.737 | 0.271 | 0.99 | 0.974–1.007 | 0.254 | 1.01 | 0.991–1.035 | 0.317 | 0.99 | 0.972–1.009 | |
| Vascular invasion | V0 | 82 | 1.00 | 1.00 | 1.00 | 1.00 | ||||||||
| V1–2 | 125 | 0.235 | 0.71 | 0.407–1.247 | 0.583 | 1.00 | 0.981–1.011 | 0.690 | 1.00 | 0.985–1.023 | 0.229 | 0.99 | 0.974–1.006 | |
| Budding (10-in-10) | Low-grade | 64 | 1.00 | 1.00 | 1.00 | 1.00 | ||||||||
| High-grade | 63 | 0.414 | 0.75 | 0.369–1.508 | 0.843 | 1.00 | 0.980–1.016 | 0.855 | 1.00 | 0.978–1.027 | 0.467 | 0.99 | 0.973–1.012 | |
| Therapy | None | 164 | 1.00 | 1.00 | 1.00 | 1.00 | ||||||||
| Post-surgical | 56 | 0.251 | 0.70 | 0.373–1.294 | 0.886 | 1.00 | 0.983–1.015 | 0.031 | 0.98 | 0.957–0.998 | 0.947 | 1.00 | 0.983–1.018 | |
| MSI status | Low | 165 | 1.00 | 1.00 | 1.00 | 1.00 | ||||||||
| High | 26 | 0.015 | 3.46 | 1.274 | 0.039 | 1.02 | 1.001–1.042 | 0.503 | 0.99 | 0.963–1.019 | 0.742 | 1.00 | 0.972–1.020 | |
miRNA expression in the tumor stroma of CRC and miRNA mediated control of interferon stimulated genes
Using miRTarBase,19 a database of experimentally validated miR-target interactions, we identified three miRNAs that were shown to target STAT1, IRF-1 and IRF-5 (miR-34a and STAT1, miR-93 and IRF-1, miR-146a and IRF-5, miR-146a and STAT1). Two of these miRNAs, miR-34a and miR-93, were detectable by ISH in formalin-fixed paraffin-embedded (FFPE) CRC tissue. As the ISH staining pattern precluded standard tissue classification by available digital analysis algorithms, we constructed a classifier mask on each of the protein slides, and transferred it onto the corresponding sequential miRNA slide. This guaranteed correct identification of the epithelium and stroma on the miRNA slides and ensured that the miRNA signal intensity could be directly compared with its corresponding protein target. Examples of miRNA detection and correlation with protein expression are shown in (Fig. 2).
Figure 2.
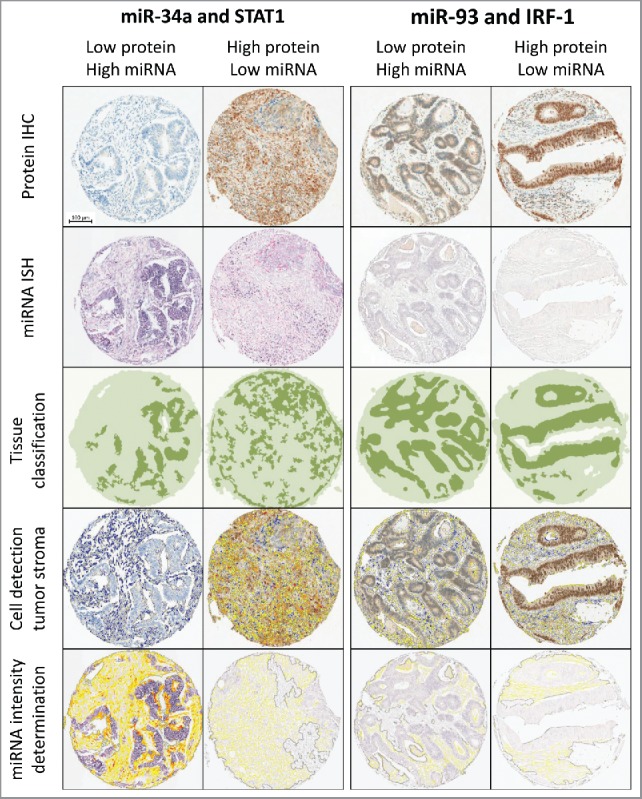
Workflow of sequential digital image analysis of STAT1 and IRF-1 protein immunohistochemistry and miR-34a and miR-93 in situ hybridization. Four example cases with different expression levels are shown (columns). STAT1 and IRF-1 expression was visualized by immunohistochemistry (top row). Cells were quantified and IHC staining intensity was analyzed using HALO™ (Indica Labs) digital image analysis software (second row). Image guided tissue segmentation was performed to specifically analyze protein expression patterns in tumor stroma (third row). Strict serial sections were analyzed for miR-34a and miR-93 expression by miRNA ISH (fourth row). miRNA expression patterns in the tumor stroma were quantified using the protein tissue classification mask (bottom row).
Digital image analysis identified a strong overexpression of miR-34a in the tumor stroma as compared with normal and tumor epithelial cells, as well as lymphocytes (p = 0.002). miR-34a expression in the tumor stroma is negatively correlated with STAT1 expression in (p = 0.006, OR: 0.395, 95%CI: 0.20–0.77). miR-93 is detectable at low levels by ISH and showed a negative correlation with IRF-1 expression in the CRC stroma. These results did not, however, reach statistical significance (p = 0.58, OR: 0.489, 95%CI: 0.23–1.02).
The immune-activated versus the quiescent phenotype: molecular and clinicopathological characteristics
STAT1, IRF-1 and IRF-5 were combined into a single score to classify the immune phenotype of CRC patients. The score was based on dichotomized values of all three protein signals as detected by digital image analysis and stratified the patients into two categories. An immune-activated phenotype was identified in 178 patients who expressed at least one of the three proteins. Forty-three patients did not express any of the markers and were assigned to the immune-quiescent phenotype.
Patients with an immune-activated phenotype were more likely to be female (p = 0.037, OR: 1.80, 95%CI: 1.04–3.11) and have right-sided tumors (p = 0.014, OR: 2.10, 95%CI: 1.16–3.80) with microsatellite instability (p = 0.015, OR: 3.46, 95%CI: 1.274–9.375). An immune-activated stroma was associated with elevated peri- and intra-tumoral CD8+ T-cell counts (p < 0.001, OR: 3.42, 95%CI: 1.83–6.39; p = 0.039, OR: 2.554, 95%CI: 1.18–5.54, respectively), intratumoral CD3+ T-cell counts (p = 0.002, OR: 3.43, 95%CI: 1.58–7.5), but not CD4+ or CD45RO memory T-lymphocyte infiltration (Table 2).
Table 2.
Association of the immune active phenotype with immune cell infiltrates and effector molecule expression.
| Immune-active phenotype |
|||||
|---|---|---|---|---|---|
| Feature | # | p value | OR | 95%CI | |
| Granzyme B | 0 | 67 | 1.00 | ||
| 1 | 153 | <0.0001 | 3.22 | 1.708–6.083 | |
| Perforin | 0 | 108 | 1.00 | ||
| 1 | 112 | 0.020 | 1.90 | 1.107–3.261 | |
| ICAM-1 | 0 | 98 | 1.00 | ||
| 1 | 132 | 0.006 | 2.17 | 1.255–3.765 | |
| Intratumoral CD8+ | 0 | 74 | 1.00 | ||
| 1 | 76 | 0.039 | 2.19 | 1.039–4.599 | |
| Peritumoral CD8+ | 0 | 65 | 1.00 | ||
| 1 | 65 | 0.018 | 2.55 | 1.178–5.538 | |
| Intratumoral CD3 | 0 | 75 | 1.00 | ||
| 1 | 75 | 0.002 | 3.43 | 1.575–7.462 | |
| Peritumoral CD3 | 0 | 64 | 1.00 | ||
| 1 | 67 | 0.013 | 2.68 | 1.234–5.813 | |
| Intratumoral CD4+ | 0 | 79 | 1.00 | ||
| 1 | 45 | 0.803 | 1.00 | 0.994–1.008 | |
| Peritumoral CD4+ | 0 | 70 | 1.00 | ||
| 1 | 37 | 0.687 | 1.00 | 0.993–1.011 | |
| Intratumoral CD45RO | 0 | 78 | 1.00 | ||
| 1 | 59 | 0.087 | 1.01 | 1.00–1.01 | |
| Peritumoral CD45RO | 0 | 73 | 1.00 | ||
| 1 | 54 | 0.223 | 1.00 | 1.00–1.01 | |
To confirm CTL activation, we measured the level of the cytolytic effector molecules perforin and granzyme B in T-cells by digital image analysis. In patients with the immune-activated phenotype, there was a marked increase in granzyme B (p < 0.0001, OR: 3.22, 95%CI: 1.71–6.08) and perforin (p = 0.020, OR: 1.90, 95%CI: 1.11–3.26). Further, primary CRC with an immune-activated phenotype showed markedly increased ICAM-1 expression (p = 0.006, OR: 2.17, 95%CI: 1.26–3.77), rendering these tumors more permissible for T-cell infiltration. Remarkably, patients with an immune-activated phenotype had a considerably decreased risk of developing distant metastases (p = 0.002, OR: 0.135, 95%CI: 0.039–0.471).
Discussion
Two distinct immune phenotypes of human cancer have been recently proposed.30 The first group is characterized by a T-cell inflamed tumor microenvironment, type I interferon production and innate immune activation. In CRC, this subgroup encompasses hypermutated and MMR-deficient tumors that may counter immune attack through an upregulation of immunoinhibitory molecules.6 The second group is characterized by a quiescent immune phenotype with lack of T-cell activation and interferon-signaling. This group includes non-hypermutated CRC which may evade the host immunosurveillance through enrichment of immunosuppressive cells and downregulation of antigen-presentation pathways.6 The development of an immune-activated or quiescent phenotype may be significantly affected by epigenetic mechanisms which regulate the gene expression of pro-inflammatory factors.7 Here we propose an ISG expression signature to define immune activation in CRC and investigate the correlation of ISG expression with miR-34a-5p and miR-93–5p using digital pathology in a well-characterized patient cohort.
First, we specifically analyze the expression of the STAT1, IRF-5 and IRF-1 transcription factors in normal and neoplastic colon tissue. Previous studies have addressed STAT1 expression in CRC cells only.13 Importantly, non-neoplastic cell populations such as activated T-cells, antigen-presenting cells and stromal fibroblasts represent a major source of inflammatory cytokines in the tumor microenvironment.30 The present study provides translational evidence of a stromal contribution to the type I interferon signature in immune-activated CRC.
Second, we identify a strong association of STAT1, IRF-1 and IRF-5 expression in the tumor stroma with a decreased likelihood of distant metastatic spread of CRC. This data confirms and extends previous analyses of STAT1 expression as a favorable prognostic biomarker for CRC patients.13,31 In particular, STAT1 was frequently overexpressed in the microenvironment of tumors with microsatellite instability and a right-sided tumor location. While IRF-1 has been identified as a marker of immune-mediated tumor destruction in malignant melanoma 32 and breast cancer,33 little is known on the prognostic impact of IRF-1 and IRF-5 expression in the microenvironment of CRC. Here we show a strong correlation of the stromal IRF-1 and IRF-5 biomarker profile with a lack of distant metastatic disease. This finding has potential clinical importance as metastatic relapse is the major cause of death for CRC patients and critically limits therapeutic options. The development of predictive biomarkers for metastatic disease is therefore of utmost importance for risk-adapted treatment and follow-up of CRC patients in clinical practice.34
Third, we test the combined expression of the ISGs STAT1, IRF-1 and IRF-5 in the tumor stroma as a signature of immune activation in CRC. Using digital image analysis, we identify strong positive correlations between this signature and abundant intra- and peri-tumoral infiltration by CD3− and CD8+ T-lymphocytes, previously identified as a significant and independent predictor of CRC patient survival.1-4 Whether the assessment of the ISG-score may further improve patient stratification would be an interesting point for further study. In the microenvironment, a strong upregulation of perforin and granzyme B likewise correlated with the joint upregulation of ISG protein factors. These cytolytic effector molecules are important mediators of both CTL-mediated and natural-killer cell mediated lysis of neoplastic cells.35-37 On the tumor level, ICAM-1 expression was positively correlated with an immune-activated stromal signature. Upregulation of ICAM-1 increases the susceptibility of tumor cells to antigen-specific lysis by CTLs.16,38 Taken together, we provide comprehensive evidence that the stromal ISG signature identifies immune-activated CRC with high fidelity. Of note, we observed a similar, albeit weaker pattern of ISG expression in the tumor epithelium (data not shown), suggesting reciprocal tumor-stromal interactions in the activation of immune-related genes. Further studies are necessary to decode this functional interference.
Last, we address the possibility to detect and directly correlate the contribution of miRNA expression to the type I interferon gene expression signature in the tumor microenvironment using digital image analysis algorithms. As miRNAs are not significantly degraded in FFPE tissue, they can be visualized by in situ hybridization and represent an ideal molecule for high throughput arrays.39 In previous studies, miRNAs have been largely detected by qPCR and sequencing approaches of total RNA from tumor material, ignoring the inherent heterogeneity of these samples. As the same miRNA and mRNA molecules can be present in multiple cell types in the tumor microenvironment, inaccurate conclusions were drawn from these studies as to the change of miRNAs in tumorigenesis, and the cell-type specific expression of these miRNAs.40
In the present study, we specifically focus on miR-34a, miR-93 and miR-146a expression in the tumor stroma. These miRNAs have previously been shown to regulate the expression of STAT1, IRF-1 and IRF-5.18-22 We use a thorough approach, combining sequential detection of miRNAs and their target proteins with digital image analysis for comprehensive biomarker profiling. Even though expression of miR-146a has been described previously in CRC cells ,41 this miRNA was not detectable by ISH in the present cohort. This discrepancy may be due to suboptimal binding of the available ISH probe or a low abundance of miR-146a in the cohort under study. Interestingly, miR-34a expression strongly correlated with the downregulation of STAT1 in the tumor microenvironment. A similar pattern was identified for miR-93 and IRF-1 although correlations did not reach statistical significance. These results will allow us to proceed with functional and mechanistic assays in the future, focusing on the possible dysregulation of miRNAs in the tumor microenvironment of CRC.
This investigation has several strengths: Analyses are based on a very well characterized cohort of 241 CRC patients with full clinicopathological data and therapy information. This study is designed in a hypothesis driven approach and utilizes state-of-the art digital image processing techniques for objective examination of protein and miRNA expression. Multi-punch ngTMAs are used to control for heterogeneity of marker expression. Weaknesses include a relatively small number of patients included in the analysis of the immune-active phenotype with clinicopathological features. As a multi-marker phenotype was used for stratification of prognostic groups, this introduced a multiple-testing problem precluding statistically powerful survival analyses. We therefore recommend further investigation of the prognostic impact of the immune phenotypes as defined by miRNA and ISG protein expression in independent patient cohorts.
Taken together, we provide comprehensive translational evidence for the use of an ISG biomarker signature to identify immune-activated CRC. In our working model (Fig. 3), the ISG signature strongly associates with markers of immune activation including abundant T-cell infiltrates, expression of cytolytic molecules and tumor expression of ICAM-1. Further, we provide initial evidence of miRNA-mediated immunosuppression through the inhibition of STAT1 and IRF-1 expression in the tumor microenvironment of CRC. Eventually, chemically modified anti-miR oligonucleotides termed antagomirs may allow highly specific targeting of miRNA transcripts in cancer patients.42 The reversal of immunosuppression by epigenetic modulation before or in conjunction with immune-checkpoint inhibition may therefore be a promising future therapeutic strategy.
Figure 3.
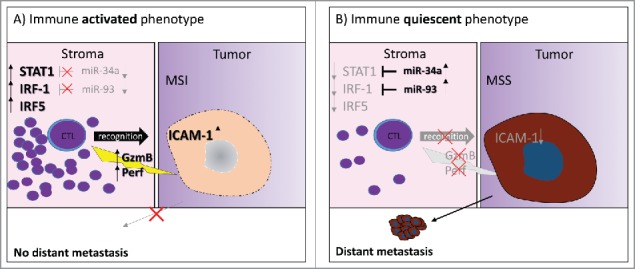
Working model. (A) The immune-activated phenotype of CRC is characterized by low expression of miR-34a and miR-93, activation of interferon signaling and expression of STAT1, IRF-1 and IRF-5 in the tumor microenvironment. Tumors of this phenotype are strongly infiltrated by CTLs releasing cytotoxic effector molecules, frequently have a microsatellite instable genotype and show upregulation of ICAM-1 on tumor cells. Patients with a high ISG-score have a significantly reduced risk of presenting with a distant metastasis. (B) The immune-quiescent phenotype of CRC is characterized by silencing of ISG through miR-34a and miR-93 in the tumor microenvironment and reduced of T-cell activation. Expression of cytotoxic effector molecules in CTL is infrequent. Lack of ICAM-1 may make tumors of this phenotype less amenable to CTL-infiltration and resistant to immune-mediated tumor destruction. Tumors of this phenotype frequently have a microsatellite stable genotype. Patients with a low ISG-score have a significantly increased risk of presenting with distant metastasis.
Conclusions
Our results confirm an important role of stromal interferon-signaling in driving the anti-tumoral immune response in CRC. A combined score of STAT1, IRF-1 and IRF-5 expression by digital image analysis identified patients with an immune-activated phenotype characterized by tumor expression of ICAM-1, increased CTL infiltration, expression of cytolytic immune effector molecules and a 10-fold lower frequency of distant metastasis. Expression of miR-34a and miR-93 inversely correlated with expression of interferon-signaling genes in the tumor microenvironment. Targeting miRNAs in the regulatory network of interferon-responsive genes may therefore represent a novel strategy to activate the anti-tumoral immune response.
Materials and methods
Patient cohort and study design
Three hundred and 35 unselected, non-consecutive CRC patients treated by surgery between 2002 and 2011 at the University Clinic for Visceral Surgery and Medicine at the Inselspital, Bern were included in this study. Tumor resection specimens were grossed according to the guidelines of the guidelines of the Quality guidelines of the Swiss Society of Pathology, fixed in 4% formalin and paraffin embedded. Full histopathological information of primary tumor (pT), regional lymph node metastasis (pN), distant metastasis (pM), lymphatic (L), venous (V) and perineural (Pn) invasion, R, tumor grade (G), histological subtype, tumor budding and tumor border configuration was obtained from patient records. Molecular data includes MSS/MSI status based on the analysis of three microsatellite loci (Bat25, Bat26, D2S123).43 All cases and slides were re-reviewed by AL, VK and HD according to the seventh edition of the tumor node metastasis (TNM) classification of malignant tumors.44 Other data collected included patient age at diagnosis, gender, tumor size, tumor location and information on pre- and post-surgical therapy. Ninety-four patients were excluded based on pre-surgical treatment (n = 51) or insufficient material (n = 43) remaining on the tissue block. Clinicopathological features of the final cohort (n = 241) are provided in (Table S1). The study design is shown in (Fig. S1). The use of patient data was approved by the local ethics committee (Kantonale Ethikkommission Bern; application number KEK-200/14). This study was designed to comply with the REMARK guidelines for tumor marker prognostic studies.45
Next-generation tissue microarray (ngTMA)
ngTMAs were specifically designed to address marker expression in the tumor microenvironment using a digital pathology approach.46 To this end, two 0.6 mm tissue cores each from the tumor center, tumor front, peritumoral stroma and normal colorectal mucosa were selected on high resolution digital scans of hematoxylin and eosin stained slides. Standardized staining controls were included in each block.
Immunohistochemistry (IHC)
The ngTMA blocks were sectioned at 4 µm and stained with antibodies on an automated immunohistochemistry platform (Leica Bond-III, Leica Biosystems, Muttenz, Switzerland) according to standard protocols. The antibodies and protocol modifications used were: STAT1 (Abcam, #ab2415, 1:75, pre-treatment citrate 30′, 100°C), IRF-1 (Abcam, #ab191032, 1:800, pre-treatment citrate 30′, 100°C), IRF-5 (Abcam, #ab33478, 1:400, pre-treatment tris-EDTA 30′, 95°C), perforin (Abcam, #ab75573, undiluted, pre-treatment tris-EDTA 30′, 95°C), granzyme B (Abcam, #ab4059, 1:75, pre-treatment citrate 30′, 100°C), ICAM-1 (Abcam, #ab53013, 1:100, pre-treatment citrate 30′, 100°C) and double stained for pan-cytokeratin and CD8+ (sequential pan-cytokeratin, Dako M351501–2; 1:200, pre-treatment citrate 20′, 100°C, CD8+, Dako, M7103, 1:100, pre-treatment tris-EDTA 20′ 95°C).
In situ hybridization (ISH)
The ISH assay and miRNA ISH detection probes for miR-34a, miR-93 and miR-146a were purchased from Exiqon (Exiqon, Vedbaek, Denmark). miRNA detection was performed manually on ngTMA sections sequential to their target protein (miR-34a and STAT1, miR-93 and IRF-1, miR-146a and IRF-5, miR-146a and STAT1). U6 and scrambled probes were used as positive and negative controls, respectively. Detection was performed according to the manufacturer's recommendations, with the following optimizations: tissue digestion was performed with 5 µM Proteinase K for 10′. miR-34a was optimally detected using a probe concentration of 30 nM, miR-93 by using 80 nM. miR-146a was not detectable by this method and a probe concentration of up to 240 nM despite its concentration being reported at levels higher than the levels of miR-34a.41
Digital evaluation of immunohistochemistry and in situ hybridization
IHC and ISH slides were scanned using the Aperio CS ScanScope (Leica Biosystems, Muttenz, Switzerland) at high resolution and 400x magnification. Image analysis was performed by using the HALO™ image analysis software (Indica Labs, Corrales, NM 87048, USA). Briefly, each TMA spot was first segmented according to tissue type into epithelial and stromal compartments. Visual control of tissue segmentation was performed. Following segmentation, staining intensity for each marker and percentage of positively stained cells was recorded by using a Cytonuclear v1.4 algorithm. For ICAM-1 detection, the Membrane v1.1 algorithm was used. The percentage of positive cells in the stroma was used for further statistical analysis. Algorithm adjustment parameters for each protein and RNA marker are listed in (Table S2). For miRNA level determination, the tissue class definition from each punch of the sequential protein slide was applied onto the corresponding ISH punch. miRNA expression was calculated as the average signal intensity in the observed region using the area quantification module.
Statistical analysis
Since each patient had multiple tumor punches taken from different regions within the tumor, the percentage of positive cells was averaged across all cases that contained at least four punches with at least 20 cells of the desired tissue class (tumor, stroma). Stroma within the normal tissue served as an internal control, and its score was calculated as the average percentage of positive cells in two replicate punches. Protein/protein and protein/miRNA marker associations as well as correlations with clinicopathological features were analyzed by logistic regression. The p values, odds ratios (OR) and 95% confidence intervals (CI) were obtained for each analysis. Binary logistic regression was used for correlation assessment of continuous scores. The selection of clinically important cut-off scores for dichotomization of the data was based on receiver operating curve (ROC) analysis. For each percentage/intensity score, the sensitivity and specificity for each outcome was plotted to generate a ROC curve. The score closest to the point of maximum specificity and sensitivity was selected as the cut-off. Analyses were performed using IBM SPSS Version 23 (IBM Schweiz AG, Zürich, Switzerland).
Ethics committee approval
The use of patient material was approved by the Ethics commission of the canton of Bern (200/14).
Supplementary Material
Disclosure of potential conflicts of interest
LS received an AACR-Pezcoller Foundation Scholar-in-Training award for presentation of this project at the AACR Annual Meeting 2016 in New Orleans, Louisiana, USA. The authors have no relevant affiliations or financial involvement with any organization or entity with a financial interest in or financial conflict with the subject matter or materials discussed in the manuscript.
Acknowledgments
The authors thank Prof. Ian Tomlinson and Dr Enric Domingo, Wellcome Trust Center for Human Genetics, University of Oxford for excellent collaboration and material transfer in analysis of microsatellite instability status. We thank Dr Philippe, Krebs for excellent collaboration and support. Further, we would like to acknowledge Liliane Schöni, Dr José Galván and Caroline Hammer from the Translational Research Unit, Institute of Pathology, University of Bern for their expert technical contributions.
Funding
This project was funded by Oncosuisse (KFS-3294–08–2013 to AL and VHK). TMA-construction was supported by a project grant of the Swiss National Science Foundation to AL (310030_133114).
Author contributions
VHK and LS together with AL conceived the study and study design, conducted the study, performed data interpretation and drafted the manuscript; LS performed IHC, miRNA ISH, digital image analysis of ISH and IHC and performed statistical analysis. IZ contributed to the study design and data interpretation, critically reviewed and approved the final manuscript. AL, VHK, HD reviewed cases obtained and categorized histopathological data. MDB and DI provided patient material and clinical data, reviewed and approved the final manuscript. SZ performed data collection and processing, critically reviewed and approved the final manuscript. LC evaluated CD8+, CD4+, CD3 and CD45RO stains on ngTMA and full-tissue sections, critically reviewed and approved the final manuscript. All authors have reviewed and approved the final version to be published.
References
- 1.Pages F, Berger A, Camus M, Sanchez-Cabo F, Costes A, Molidor R, Mlecnik B, Kirilovsky A, Nilsson M, Damotte D et al.. Effector memory T cells, early metastasis, and survival in colorectal cancer. N Engl J Med 2005; 353:2654-66; PMID:16371631; http://dx.doi.org/ 10.1056/NEJMoa051424 [DOI] [PubMed] [Google Scholar]
- 2.Galon J, Pages F, Marincola FM, Angell HK, Thurin M, Lugli A, Zlobec I, Berger A, Bifulco C, Botti G et al.. Cancer classification using the Immunoscore: a worldwide task force. J Transl Med 2012; 10:205; PMID: 23034130; http://dx.doi.org/ 10.1186/1479-5876-10-205 [DOI] [PMC free article] [PubMed] [Google Scholar]
- 3.Fridman WH, Pages F, Sautes-Fridman C, Galon J. The immune contexture in human tumours: impact on clinical outcome. Nature reviews Cancer 2012; 12:298-306; PMID: 22419253; http://dx.doi.org/ 10.1038/nrc3245 [DOI] [PubMed] [Google Scholar]
- 4.Koelzer V, Zlobec I, Dawson H, Borner M, Inderbitzin D, Lugli A. The CD8/CD45RO immunoscore in biopsy specimens of colorectal cancer predicts histopathologic features of the matched resection specimen and survival outcome. VIRCHOWS ARCHIV: SPRINGER NEW YORK, NY, 2013:139. [Google Scholar]
- 5.Le DT, Uram JN, Wang H, Bartlett BR, Kemberling H, Eyring AD, Skora AD, Luber BS, Azad NS, Laheru D et al.. PD-1 Blockade in Tumors with Mismatch-Repair Deficiency. N Engl J Med 2015; 372:2509-20; PMID: 26028255; http://dx.doi.org/ 10.1056/NEJMoa1500596 [DOI] [PMC free article] [PubMed] [Google Scholar]
- 6.Angelova M, Charoentong P, Hackl H, Fischer ML, Snajder R, Krogsdam AM, Waldner MJ, Bindea G, Mlecnik B, Galon J et al.. Characterization of the immunophenotypes and antigenomes of colorectal cancers reveals distinct tumor escape mechanisms and novel targets for immunotherapy. Genome Biol 2015; 16:64; PMID: 25853550; http://dx.doi.org/ 10.1186/s13059-015-0620-6 [DOI] [PMC free article] [PubMed] [Google Scholar]
- 7.Heninger E, Krueger TE, Lang JM. Augmenting antitumor immune responses with epigenetic modifying agents. Front Immunol 2015; 6:29; PMID: 25699047; http://dx.doi.org/ 10.3389/fimmu.2015.00029 [DOI] [PMC free article] [PubMed] [Google Scholar]
- 8.Wang E, Worschech A, Marincola FM. The immunologic constant of rejection. Trends Immunol 2008; 29:256-62; PMID: 18457994; http://dx.doi.org/ 10.1016/j.it.2008.03.002 [DOI] [PubMed] [Google Scholar]
- 9.Ramana CV, Gil MP, Schreiber RD, Stark GR. Stat1-dependent and -independent pathways in IFN-gamma-dependent signaling. Trends Immunol 2002; 23:96-101; PMID: 11929133; http://dx.doi.org/ 10.1016/S1471-4906(01)02118-4 [DOI] [PubMed] [Google Scholar]
- 10.Aaronson DS, Horvath CM. A road map for those who don't know JAK-STAT. Science 2002; 296:1653-5; PMID: 12040185; http://dx.doi.org/ 10.1126/science.1071545 [DOI] [PubMed] [Google Scholar]
- 11.Levy DE, Darnell JE Jr.. Stats: transcriptional control and biological impact. Nat Rev Mol Cell Biol 2002; 3:651-62; PMID: 12209125; http://dx.doi.org/ 10.1038/nrm909 [DOI] [PubMed] [Google Scholar]
- 12.Fallarino F, Gajewski TF. Cutting edge: differentiation of antitumor CTL in vivo requires host expression of Stat1. J Immunol 1999; 163:4109-13; PMID:1051034520581241 [PubMed] [Google Scholar]
- 13.Simpson JA, Al-Attar A, Watson NF, Scholefield JH, Ilyas M, Durrant LG. Intratumoral T cell infiltration, MHC class I and STAT1 as biomarkers of good prognosis in colorectal cancer. Gut 2010; 59:926-33; PMID: 20581241; http://dx.doi.org/ 10.1136/gut.2009.194472 [DOI] [PubMed] [Google Scholar]
- 14.Kim PK, Armstrong M, Liu Y, Yan P, Bucher B, Zuckerbraun BS, Gambotto A, Billiar TR, Yim JH. IRF-1 expression induces apoptosis and inhibits tumor growth in mouse mammary cancer cells in vitro and in vivo. Oncogene 2004; 23:1125-35; PMID: 14762441; http://dx.doi.org/ 10.1038/sj.onc.1207023 [DOI] [PubMed] [Google Scholar]
- 15.Yanai H, Negishi H, Taniguchi T. The IRF family of transcription factors: Inception, impact and implications in oncogenesis. Oncoimmunology 2012; 1:1376-86; PMID: 23243601; http://dx.doi.org/ 10.4161/onci.22475 [DOI] [PMC free article] [PubMed] [Google Scholar]
- 16.Ueda R, Kohanbash G, Sasaki K, Fujita M, Zhu X, Kastenhuber ER, McDonald HA, Potter DM, Hamilton RL, Lotze MT et al.. Dicer-regulated microRNAs 222 and 339 promote resistance of cancer cells to cytotoxic T-lymphocytes by down-regulation of ICAM-1. Proceedings of the National Academy of Sciences of the United States of America 2009; 106:10746-51; PMID: 19520829; http://dx.doi.org/ 10.1073/pnas.0811817106 [DOI] [PMC free article] [PubMed] [Google Scholar]
- 17.Look DC, Pelletier MR, Holtzman MJ. Selective interaction of a subset of interferon-gamma response element-binding proteins with the intercellular adhesion molecule-1 (ICAM-1) gene promoter controls the pattern of expression on epithelial cells. J Biol Chem 1994; 269:8952-8; PMID: 7907595 [PubMed] [Google Scholar]
- 18.Chou CH, Chang NW, Shrestha S, Hsu SD, Lin YL, Lee WH, Yang CD, Hong HC, Wei TY, Tu SJ et al.. miRTarBase 2016: updates to the experimentally validated miRNA-target interactions database. Nucleic Acids Res 2016; 44:D239-47; PMID:26590260; http://dx.doi.org/21071411 10.1093/nar/gkv1258 [DOI] [PMC free article] [PubMed] [Google Scholar]
- 19.Hsu SD, Lin FM, Wu WY, Liang C, Huang WC, Chan WL, Tsai WT, Chen GZ, Lee CJ, Chiu CM et al.. miRTarBase: a database curates experimentally validated microRNA-target interactions. Nucleic Acids Res 2011; 39:D163-9; PMID: 21071411; http://dx.doi.org/ 10.1093/nar/gkq1107 [DOI] [PMC free article] [PubMed] [Google Scholar]
- 20.Kaller M, Liffers ST, Oeljeklaus S, Kuhlmann K, Roh S, Hoffmann R, Warscheid B, Hermeking H. Genome-wide characterization of miR-34a induced changes in protein and mRNA expression by a combined pulsed SILAC and microarray analysis. Mol Cell Proteomics 2011; 10:M111 010462; PMID: 21566225; http://dx.doi.org/ 10.1074/mcp.M111.010462 [DOI] [PMC free article] [PubMed] [Google Scholar]
- 21.Hafner M, Landthaler M, Burger L, Khorshid M, Hausser J, Berninger P, Rothballer A, Jr Ascano M, Jungkamp AC, Munschauer M et al.. Transcriptome-wide identification of RNA-binding protein and microRNA target sites by PAR-CLIP. Cell 2010; 141:129-41; PMID: 20371350; http://dx.doi.org/ 10.1016/j.cell.2010.03.009 [DOI] [PMC free article] [PubMed] [Google Scholar]
- 22.Tang Y, Luo X, Cui H, Ni X, Yuan M, Guo Y, Huang X, Zhou H, de Vries N, Tak PP et al.. MicroRNA-146A contributes to abnormal activation of the type I interferon pathway in human lupus by targeting the key signaling proteins. Arthritis and rheumatism 2009; 60:1065-75; PMID: 19333922; http://dx.doi.org/ 10.1002/art.24436 [DOI] [PubMed] [Google Scholar]
- 23.He L, Hannon GJ. MicroRNAs: small RNAs with a big role in gene regulation. Nat Rev Genet 2004; 5:522-31; PMID: 15211354; http://dx.doi.org/ 10.1038/nrg1379 [DOI] [PubMed] [Google Scholar]
- 24.Friedman RC, Farh KK, Burge CB, Bartel DP. Most mammalian mRNAs are conserved targets of microRNAs. Genome Res 2009; 19:92-105; PMID: 18955434; http://dx.doi.org/ 10.1101/gr.082701.108 [DOI] [PMC free article] [PubMed] [Google Scholar]
- 25.Lin S, Gregory RI. MicroRNA biogenesis pathways in cancer. Nat Rev Cancer 2015; 15:321-33; PMID: 25998712; http://dx.doi.org/ 10.1038/nrc3932 [DOI] [PMC free article] [PubMed] [Google Scholar]
- 26.Hamfjord J, Stangeland AM, Hughes T, Skrede ML, Tveit KM, Ikdahl T, Kure EH. Differential expression of miRNAs in colorectal cancer: comparison of paired tumor tissue and adjacent normal mucosa using high-throughput sequencing. PLoS One 2012; 7:e34150; PMID: 22529906; http://dx.doi.org/ 10.1371/journal.pone.0034150 [DOI] [PMC free article] [PubMed] [Google Scholar]
- 27.Sun G, Cheng YW, Lai L, Huang TC, Wang J, Wu X, Wang Y, Huang Y, Wang J, Zhang K et al.. Signature miRNAs in colorectal cancers were revealed using a bias reduction small RNA deep sequencing protocol. Oncotarget 2016; 7:3857-72; PMID: 26646696; http://dx.doi.org/ 10.18632/oncotarget.6460 [DOI] [PMC free article] [PubMed] [Google Scholar]
- 28.Liang Y, Ridzon D, Wong L, Chen C. Characterization of microRNA expression profiles in normal human tissues. BMC Genomics 2007; 8:166; PMID: 17565689; http://dx.doi.org/ 10.1186/1471-2164-8-166 [DOI] [PMC free article] [PubMed] [Google Scholar]
- 29.Isella C, Terrasi A, Bellomo SE, Petti C, Galatola G, Muratore A, Mellano A, Senetta R, Cassenti A, Sonetto C et al.. Stromal contribution to the colorectal cancer transcriptome. Nat Genet 2015; 47:312-9; PMID: 25706627; http://dx.doi.org/ 10.1038/ng.3224 [DOI] [PubMed] [Google Scholar]
- 30.Gajewski TF, Schreiber H, Fu YX. Innate and adaptive immune cells in the tumor microenvironment. Nat Immunol 2013; 14:1014-22; PMID: 24048123; http://dx.doi.org/ 10.1038/ni.2703 [DOI] [PMC free article] [PubMed] [Google Scholar]
- 31.Gordziel C, Bratsch J, Moriggl R, Knosel T, Friedrich K. Both STAT1 and STAT3 are favourable prognostic determinants in colorectal carcinoma. Br J Cancer 2013; 109:138-46; PMID: 23756862; http://dx.doi.org/ 10.1038/bjc.2013.274 [DOI] [PMC free article] [PubMed] [Google Scholar]
- 32.Wang E, Miller LD, Ohnmacht GA, Mocellin S, Perez-Diez A, Petersen D, Zhao Y, Simon R, Powell JI, Asaki E et al.. Prospective molecular profiling of melanoma metastases suggests classifiers of immune responsiveness. Cancer research 2002; 62:3581-6; PMID: 12097256 [PMC free article] [PubMed] [Google Scholar]
- 33.Ascierto ML, Kmieciak M, Idowu MO, Manjili R, Zhao Y, Grimes M, Dumur C, Wang E, Ramakrishnan V, Wang XY et al.. A signature of immune function genes associated with recurrence-free survival in breast cancer patients. Breast Cancer Res Treat 2012; 131:871-80; PMID: 21479927; http://dx.doi.org/ 10.1007/s10549-011-1470-x [DOI] [PMC free article] [PubMed] [Google Scholar]
- 34.Stein U, Walther W, Arlt F, Schwabe H, Smith J, Fichtner I, Birchmeier W, Schlag PM. MACC1, a newly identified key regulator of HGF-MET signaling, predicts colon cancer metastasis. Nat Med 2009; 15:59-67; PMID: 19098908; http://dx.doi.org/ 10.1038/nm.1889 [DOI] [PubMed] [Google Scholar]
- 35.Brodbeck T, Nehmann N, Bethge A, Wedemann G, Schumacher U. Perforin-dependent direct cytotoxicity in natural killer cells induces considerable knockdown of spontaneous lung metastases and computer modelling-proven tumor cell dormancy in a HT29 human colon cancer xenograft mouse model. Mol Cancer 2014; 13:244; PMID: 25373310; http://dx.doi.org/ 10.1186/1476-4598-13-244 [DOI] [PMC free article] [PubMed] [Google Scholar]
- 36.Darcy PK, Haynes NM, Snook MB, Trapani JA, Cerruti L, Jane SM, Smyth MJ. Redirected perforin-dependent lysis of colon carcinoma by ex vivo genetically engineered CTL. J Immunol 2000; 164:3705-12; PMID:10725729; http://dx.doi.org/11562487 10.4049/jimmunol.164.7.3705 [DOI] [PubMed] [Google Scholar]
- 37.Medema JP, de Jong J, Peltenburg LT, Verdegaal EM, Gorter A, Bres SA, Franken KL, Hahne M, Albar JP, Melief CJ et al.. Blockade of the granzyme B/perforin pathway through overexpression of the serine protease inhibitor PI-9/SPI-6 constitutes a mechanism for immune escape by tumors. Proceedings of the National Academy of Sciences of the United States of America 2001; 98:11515-20; PMID: 11562487; http://dx.doi.org/ 10.1073/pnas.201398198 [DOI] [PMC free article] [PubMed] [Google Scholar]
- 38.Yang L, Froio RM, Sciuto TE, Dvorak AM, Alon R, Luscinskas FW. ICAM-1 regulates neutrophil adhesion and transcellular migration of TNF-alpha-activated vascular endothelium under flow. Blood 2005; 106:584-92; PMID: 15811956; http://dx.doi.org/ 10.1182/blood-2004-12-4942 [DOI] [PMC free article] [PubMed] [Google Scholar]
- 39.Hall JS, Taylor J, Valentine HR, Irlam JJ, Eustace A, Hoskin PJ, Miller CJ, West CM. Enhanced stability of microRNA expression facilitates classification of FFPE tumour samples exhibiting near total mRNA degradation. Br J Cancer 2012; 107:684-94; PMID: 22805332; http://dx.doi.org/ 10.1038/bjc.2012.294 [DOI] [PMC free article] [PubMed] [Google Scholar]
- 40.Kent OA, McCall MN, Cornish TC, Halushka MK. Lessons from miR-143/145: the importance of cell-type localization of miRNAs. Nucleic Acids Res 2014; 42:7528-38; PMID: 24875473; http://dx.doi.org/ 10.1093/nar/gku461 [DOI] [PMC free article] [PubMed] [Google Scholar]
- 41.Monzo M, Navarro A, Bandres E, Artells R, Moreno I, Gel B, Ibeas R, Moreno J, Martinez F, Diaz T et al.. Overlapping expression of microRNAs in human embryonic colon and colorectal cancer. Cell Res 2008; 18:823-33; PMID:18607389; http://dx.doi.org/22230293 10.1038/cr.2008.81 [DOI] [PubMed] [Google Scholar]
- 42.Stenvang J, Petri A, Lindow M, Obad S, Kauppinen S. Inhibition of microRNA function by antimiR oligonucleotides. Silence 2012; 3:1; PMID: 22230293; http://dx.doi.org/ 10.1186/1758-907X-3-1 [DOI] [PMC free article] [PubMed] [Google Scholar]
- 43.Domingo E, Freeman-Mills L, Rayner E, Glaire M, Briggs S, Vermeulen L, Fessler E, Medema JP, Boot A, Morreau H, van Wezel, T et al. Somatic POLE proofreading domain mutation, immune response, and prognosis in colorectal cancer: a retrospective, pooled biomarker study. The Lancet Gastroenterology & Hepatology, 1:207-16; http://dx.doi.org/ 10.1016/S2468-1253(16)30014-0 [DOI] [PubMed] [Google Scholar]
- 44.Sobin LH, Gospodarowicz MK, Wittekind C. International Union Against Cancer. TNM Classification of Malignant Tumours. Chichester, West Sussex, UK, Hoboken, NJ: Wiley-Blackwell, 2010. [Google Scholar]
- 45.Popat S, Houlston RS. Re: Reporting recommendations for tumor marker prognostic studies (REMARK). J Natl Cancer Inst 2005; 97:1855; author reply -6; PMID: 16368950; http://dx.doi.org/ 10.1093/jnci/dji445 [DOI] [PubMed] [Google Scholar]
- 46.Zlobec I, Koelzer VH, Dawson H, Perren A, Lugli A. Next-generation tissue microarray (ngTMA) increases the quality of biomarker studies: an example using CD3, CD8, and CD45RO in the tumor microenvironment of six different solid tumor types. J Transl Med 2013; 11:104; PMID: 23627766; http://dx.doi.org/ 10.1186/1479-5876-11-104 [DOI] [PMC free article] [PubMed] [Google Scholar]
Associated Data
This section collects any data citations, data availability statements, or supplementary materials included in this article.