

Chemotherapeutic agents that target microtubule dynamics promote a universal phenotype of kinetic stabilization. Integrated computational modeling and fluorescence microscopy identify the fundamental kinetic and thermodynamic mechanisms that result in kinetic stabilization, specifically by the drugs paclitaxel and vinblastine.
Abstract
Microtubule-targeting agents (MTAs), widely used as biological probes and chemotherapeutic drugs, bind directly to tubulin subunits and “kinetically stabilize” microtubules, suppressing the characteristic self-assembly process of dynamic instability. However, the molecular-level mechanisms of kinetic stabilization are unclear, and the fundamental thermodynamic and kinetic requirements for dynamic instability and its elimination by MTAs have yet to be defined. Here we integrate a computational model for microtubule assembly with nanometer-scale fluorescence microscopy measurements to identify the kinetic and thermodynamic basis of kinetic stabilization by the MTAs paclitaxel, an assembly promoter, and vinblastine, a disassembly promoter. We identify two distinct modes of kinetic stabilization in live cells, one that truly suppresses on-off kinetics, characteristic of vinblastine, and the other a “pseudo” kinetic stabilization, characteristic of paclitaxel, that nearly eliminates the energy difference between the GTP- and GDP-tubulin thermodynamic states. By either mechanism, the main effect of both MTAs is to effectively stabilize the microtubule against disassembly in the absence of a robust GTP cap.
INTRODUCTION
Microtubules are dynamic intracellular polymers that self-assemble from individual αβ-tubulin subunits aligned longitudinally to form protofilaments (PFs), which interact laterally with each other to form a hollow cylinder. Microtubules serve crucial roles in various cellular processes, including the segregation of replicated genomes during mitosis, that rely on the characteristic stochastic switching between extended periods of growth and shortening termed dynamic instability (Mitchison and Kirschner, 1984). Growth and shortening states are determined by the presence or absence, respectively, of a stabilizing cap of GTP-bound tubulin dimers. As the GTP cap is lost, through a combination of hydrolysis and stochastic unbinding of GTP-tubulin, unstable GDP-tubulin subunits are exposed, and the microtubule rapidly disassembles (Desai and Mitchison, 1997). The process of switching from net growth to net shortening is termed catastrophe, and the switching from net shortening back to net growth is referred to as rescue. Various microtubule-associated proteins (MAPs) and microtubule-targeting agents (MTAs) bind to the microtubule lattice and alter microtubule dynamic instability (Howard and Hyman, 2007; Dumontet and Jordan, 2010). The dynamics of growth and shortening, as well as those of catastrophe and rescue, are ultimately dictated by the underlying kinetics and thermodynamics of individual tubulin subunits. Therefore, to understand these microscale assembly dynamics and how MAPs and MTAs regulate them, we need to define the nanoscale thermodynamic and kinetic requirements for dynamic instability at the level of individual subunits.
During mitosis, dynamic instability enables rapid and dynamic rearrangements of the microtubule array to find and mechanically couple to kinetochores—the specialized adaptor complexes that mechanically link sister chromatids to dynamic microtubule plus ends. It is widely assumed that their central role in mitosis has made microtubules one of the most common and successful targets for chemotherapeutic agents used to treat a wide variety of cancers, including breast, prostate, and pancreatic cancer (reviewed in Dumontet and Jordan, 2010). Owing to their clinical relevance, there has been significant effort using both structural and in vitro biochemical approaches to understand the interactions of MTAs with tubulin. In general, MTAs have been separated into two categories based on their binding site and effect on net microtubule polymer assembly at high concentrations. Disassembly promoters bind to either the colchicine domain at the intradimer interface between α- and β-tubulin (Dorléans et al., 2009) or the vinca domain near the exchangeable GTP-binding site (E-site) on β-tubulin (Gigant et al., 2005). Assembly promoters bind to the taxane pocket near the M-loop on β-tubulin, which is involved in establishing lateral interdimer contacts (Nogales et al., 1999). Despite having opposite effects on net microtubule assembly at high concentrations, the common in vivo phenotype of the majority of MTAs is the dramatic attenuation of microtubule dynamic instability, often referred to as kinetic stabilization, reducing growth and shortening while increasing the amount of time microtubules spend in a nondynamic or paused state (summarized in Supplemental Table S1; Jordan and Kamath, 2007). A fundamental question that we address here is how MTAs with opposite effects on net microtubule polymer assembly promote the same phenotype of kinetic stabilization.
Despite years of intensive study and millions of patients being treated clinically, the molecular mechanisms of kinetic stabilization used by MTAs remain unclear. Because of the taxane site’s proximity to the M-loop, it has been suggested that paclitaxel could stabilize lateral contacts (Nogales et al., 1999; Li et al., 2002), a hypothesis that is supported by observed structural rearrangements of tubulin upon taxane domain binding by other assembly promoters (Prota et al., 2013). Alternatively, assembly promoters decrease the mechanical rigidity of microtubules (Dye et al., 1993; Venier et al., 1994; Kurachi et al., 1995; Felgner et al., 1996; Kawaguchi et al., 2008; Mitra and Sept, 2008; Sept and MacKintosh, 2010; Yu et al., 2013), which is predicted to stabilize the microtubule against disassembly (VanBuren et al., 2005). Other studies have argued that paclitaxel could stabilize microtubules via the longitudinal bond (Amos and Löwe, 1999; Castle and Odde, 2013; Alushin et al., 2014) or that it promotes a conformation in GDP-tubulin similar to that of GTP-tubulin (Elie-Caille et al., 2007). Perhaps even more confounding results exist with respect to the disassembly promoter vinblastine. Vinblastine disassembles microtubules, and yet, paradoxically, increases tubulin–tubulin dimer affinity in vitro (Na and Timasheff, 1980). Owing to vinblastine’s binding location near the interdimer longitudinal interface, it could promote disassembly through steric hindrance of longitudinal contacts and displacement of lateral contacts by inducing a curled orientation (Gigant et al., 2005). Vinblastine appears to increase dimer–dimer affinity by cross-linking adjacent tubulin dimers at the longitudinal interface (Gigant et al., 2005; Rendine et al., 2010), which could override any potential steric hindrance induced by the presence of bound vinblastine.
Although these proposed MTA mechanisms are not mutually exclusive, much of the focus has been on the promotion of net polymer assembly or disassembly (or, equivalently, microtubule stabilization or destabilization), despite the generalization that MTAs promote kinetic stabilization at concentrations that apparently do not alter the total polymer mass (Jordan and Wilson, 2004; Jordan and Kamath, 2007). It remains to be shown whether the proposed MTA mechanisms in fact lead to the observed universal phenotype of kinetic stabilization. Furthermore, it is difficult to connect the atomistic-level structural effects of MTAs (Gigant et al., 2005; Prota et al., 2013; Alushin et al., 2014) to tubulin subunit addition–loss kinetics and thermodynamics (VanBuren et al., 2002; Schek et al., 2007; Gardner et al., 2011), which ultimately dictate dynamic instability at the micrometer scale. Although previous studies reported on the mechanisms of MTAs both in vivo and in vitro, our picture of microtubule dynamics was recently revised, indicating that nanoscale assembly is not a slow and efficient process but instead a rapid and inefficient one (Gardner et al., 2011; Castle and Odde, 2013). Thus there is a need to revisit these MTAs in the context of this updated understanding of single subunit assembly dynamics. Finally, we ultimately seek to understand the mechanisms of kinetic stabilization in living cells rather than with purified proteins in vitro. To address these issues, we examine the potential mechanisms of microtubule kinetic stabilization at the level of individual tubulin subunits by integrating a computational model for microtubule self-assembly with experimental observations both in vitro and in vivo. In doing so, we identify the fundamental requirements for the existence of dynamic instability and also elucidate how MTAs eliminate it. To our knowledge, the experimental results here represent the highest resolution measurements both in vivo and in vitro of single microtubule dynamics in the largest concentration range of paclitaxel and vinblastine to date. Our theoretical and experimental treatment of kinetic stabilization by MTAs further provides a framework for the design, identification, and classification of new and more efficient microtubule-directed chemotherapeutic drugs.
RESULTS
MTAs suppress microtubule dynamics in vivo while maintaining the near-zero net assembly observed at steady state in untreated cells
The effects of MTAs on the parameters of dynamic instability in live cells have been well documented (Supplemental Table S1). This type of analysis, which assigns growth and shortening states, however, becomes problematic because kinetic stabilization is defined by a loss of dynamic instability by which growth and shortening periods are no longer distinguishable. To address this problem, previous studies defined a so-called paused state, but this further complicates the analysis by introducing additional parameters to formally include the observed transition rates among all three states. To analyze the mechanisms of kinetic stabilization more fundamentally with a molecular-level description, we used a simplified dynamics analysis method in which the tip position of individual microtubules is estimated at each frame of a time-lapse movie for the duration of imaging (Demchouk et al., 2011; Prahl et al., 2014; Figure 1, A and B) and length displacements between individual time points are recorded without assigning a specific state (i.e., growth, shortening, or paused; Figure 1D). For the purpose of comparison, we also analyzed microtubules using traditional parametric methods of assigning dynamic instability parameters (Supplemental Figure S1).
FIGURE 1:

MTAs induce a new steady state with reduced dynamics in LLC-PK1 cells. (A) Example LLC-PK1α cell (top). A representative region near the cell edge (bottom) in which individual microtubules (arrowheads) were analyzed. The white box in the top outlines the region shown below. (B) Semiautomated tracking of the microtubule end position in EGFP-α-tubulin–expressing LLC-PK1α cells treated with paclitaxel or vinblastine are shown in comparison to control cells both live and fixed (see Materials and Methods). (C) Probability densities of microtubule length displacements (ΔLMT) observed in the presence of each MTA are shown. Dotted gray line denotes 0 nm. (D) Estimated mean ΔLMT for microtubules treated with a range of paclitaxel (cyan) and vinblastine (magenta) concentrations. Data points are mean ± SEM. Dotted line indicates the zero point. The solid black and gray lines indicate estimated values for live and fixed control cells, respectively. The mean value is not statistically different from zero in any condition, indicating that microtubules have reached a new steady state after the addition of MTAs. (E) Average MSD of the microtubule plus end under the same conditions in B and C. Plus-end MSD is drastically reduced for microtubules kinetically stabilized by paclitaxel and vinblastine (100 nM) due to the loss of dynamic instability. Data points are mean ±SEM. (F) Effective diffusion coefficient ( ) of the microtubule plus ends, as estimated from the MSD, under a range of paclitaxel and vinblastine conditions. Data points are the median ±SE; cyan and magenta curves are the best-fit Hill function to all individual diffusion coefficients in the presence of paclitaxel and vinblastine, respectively. The solid black and gray lines indicate the estimated values for live and fixed control cells, respectively. For each treatment condition, >25 microtubules were analyzed from ≥10 cells. All error bars were obtained by bootstrapping the sample distribution as described in Materials and Methods.
By our simplified analysis method, rapid disassembly gives rise to large negative displacements, whereas growth results in large positive displacements. Attenuated dynamics (i.e., increased time spent in a paused state) increases the frequency of small displacements at the expense of large ones. Consistent with the expectation of kinetic stabilization, the addition of both paclitaxel and vinblastine significantly reduces the frequency of large displacements, both positive and negative (Figure 1, B and C). At 100 nM paclitaxel, the length displacement distribution is nearly indistinguishable from that of fixed microtubules (Figure 1C), although some dynamics do remain (Figure 1B and Supplemental Figure S1, A and B). Of interest, the mean displacement for each treatment condition was not statistically different from zero (Figure 1D). This means that, on average, dynamics is not biased toward net assembly or disassembly in vivo even after the addition of MTAs. In control cells, this observation is consistent with the original definition of dynamic instability by Mitchison and Kirschner (1984) in which the average length of the microtubule population remains approximately constant while individual microtubules switch between extended periods of growth and rapid shortening. After MTA treatment, the observation of zero mean displacement indicates that microtubules reach a new steady state with attenuated dynamics. This is most likely due to a secondary response of the free tubulin concentration ([Tub]) as a result of simple mass conservation within a system of approximately constant volume and fixed number of tubulin subunits (Mitchison and Kirschner, 1987; Gregoretti et al., 2006), which we will address further.
To quantify the extent of kinetic stabilization across drug concentrations, we used a diffusion-with-drift model of microtubule dynamics (Gardner et al., 2011), without distinguishing between growth and shortening phases. Because we find that microtubules in all conditions are not biased toward net assembly or disassembly (Figure 1D), we can assume that plus-end position is described by a diffusive process and extract an effective diffusion coefficient ( ) from the mean-squared displacement (MSD). Unsurprisingly, control microtubules exhibit a greater MSD in time compared with MTA-treated microtubules, and this difference increases for larger Δt (Figure 1E; see also Supplemental Movie S1). MSD is dramatically reduced in the presence of 100 nM paclitaxel and vinblastine, although dynamics are still detectable above measurement noise estimated from fixed microtubules, indicating that dynamics are not truly paused in the presence of MTAs. As expected for a purely diffusive process, the plus-end MSD increases approximately linearly in time (Figure 1E). Thus we extracted
  from a linear fit to the first 10 s of data for each individual microtubule across a range of MTA concentrations (Figure 1F). We found that
  decreases by >100-fold and exhibits a simple dose–response relation with respect to drug concentration. Microtubule dynamics are most sensitive around 10 nM, and the effect saturates by ∼100 nM for both paclitaxel and vinblastine (Figure 1F). Note that initially 100 nM drug does not appear to be enough to saturate all of the tubulin in live cells (7–10 µM; Seetapun et al., 2012), and thus saturating effects at this concentration were a bit surprising. However, if we account for the fact that the cells occupy a very small fraction of the total volume within the culture dish (∼0.025%), the total tubulin concentration in the dish is closer to 10 nM. Accounting for the cell volume fraction within the dish could also explain why paclitaxel and vinblastine concentrate 100- to 1000-fold within cells (Jordan et al., 1993; Dhamodharan et al., 1995; Yvon et al., 1999), as the drug’s tubulin-binding sites are locally concentrated within the cells at micromolar levels. If we assume that the KD of binding is within the sensitive concentration range observed here, then 100 nM drug is adequate to fully saturate all the tubulin subunits within the cells and, for that matter, within the entire dish. On the basis of this reasoning, we conclude that we are observing saturating drug conditions at concentrations ≥100 nM in vivo.
It is interesting to note that by our simplified analysis, paclitaxel and vinblastine are practically indistinguishable (Figure 1E), suggesting that it is a robust approach to quantifying the universal phenotype of kinetic stabilization. Because we do not define growth and shortening in our analysis, the switching between phases (i.e., dynamic instability) contributes to the MSD such that extracting quantitative estimates of  and
and  is difficult compared with approaches that exclusively analyze growth phases (e.g., Gardner et al., 2011). However, experimental estimates of
  and observed trends in the presence of MTAs can be used to compare to model predictions. Overall our simplified analysis provides a new quantitative baseline from which to rigorously test models for the kinetic and thermodynamic basis of MTA action in live cells.
MTAs moderately influence free tubulin concentration in individual cells in vivo
Because cells attain a new steady state after the addition of MTAs, the free tubulin concentration likely responds to the initial assembly tendency of the MTA through mass conservation of total tubulin within the cell; assembly promoters such as paclitaxel will decrease, whereas disassembly promoters such as vinblastine should increase the amount of free tubulin available. These secondary changes to the free tubulin concentration will, in turn, affect the kinetic rate of tubulin addition to the plus end, as well as provide insight into the resulting thermodynamic state of microtubules after MTA addition. To estimate the extent of tubulin mass conservation after the addition of MTAs in vivo, we photobleached a region containing both microtubule polymer and free tubulin and then measured the fluorescence fraction that recovered within the first several seconds after bleaching (Figure 2, A and B). Because fluorescence signal recovery from microtubule polymer requires turnover of the dynamic plus end (i.e., disassembly of the bleached region and reincorporation of fluorescent subunits), polymer signal recovery is much slower than recovery of the free tubulin signal by diffusion. Therefore, within the analyzed time period, fluorescence signal recovery is almost exclusively due to free tubulin rather than microtubule polymer. We did not observe any evidence of microtubule growth within the bleached regions in control or MTA-treated cells during the first few seconds (Figure 2A). Observed changes in [Tub] are consistent with paclitaxel and vinblastine’s classification as assembly and disassembly promoter, respectively (Figure 2C). Paclitaxel increased the amount of polymer signal at the expense of free tubulin, resulting in a twofold decrease of [Tub] (Figure 2, B and C, cyan, and Supplemental Table S2). Conversely, the addition of vinblastine reduced the amount of microtubule polymer, resulting in an approximately threefold increase of [Tub] (Figure 2, B and C, magenta, and Supplemental Table S2). Note that although we observe a twofold to threefold change in [Tub], changes to the total polymer levels are comparatively small (Supplemental Table S2) because the majority of tubulin is initially in polymer form in control cells. This observation may explain the previous assumption that these drugs exert their effects on microtubule dynamics at concentrations that do not influence the total amount of microtubule polymer (Jordan and Wilson, 2004), although ultimately it is not the amount of polymer but instead the free tubulin concentration that will afffect the on-off kinetics of single subunits, an important point that has been previously overlooked in the context of MTAs. Of interest, the observed change in [Tub] exhibited a dose–response relation similar to that of  , with maximal sensitivity near 10 nM and saturating effects observed by 100 nM (compare Figures 1F and 2C). Using high-sensitivity photobleaching experiments in vivo, we now show that both paclitaxel and vinblastine exert their influence on net microtubule assembly at nanomolar concentrations. We conclude that observed changes in [Tub] as a result of tubulin mass conservation compensate for the primary effect of MTAs and maintain a net assembly state near zero without bias to assemble or disassemble on average. Further, the fold change in [Tub] provides constraints for the potential kinetic and thermodynamic mechanisms of kinetic stabilization (examined more thoroughly later).
FIGURE 2:

Estimation of free tubulin and hydrolysis effects in LLC-PK1 cells treated with paclitaxel and vinblastine. (A) An example control LLC-PK1 cell expressing EGFP–α-tubulin (LLC-PK1α). Regions containing both microtubule polymer and free tubulin (within white box) were bleached and subsequently monitored for fast fluorescence recovery within the first few seconds after bleaching. The region within the white box is shown at multiple time points postbleach on the right. After 3 s, no detectable polymer signal recovers, only that due to diffusion of free tubulin. (B) Average normalized fluorescence recovery curves for control cells (black), as well as cells treated with 100 nM paclitaxel (cyan) and vinblastine (magenta). Error bars are ± SE. (C) Fraction of fluorescence intensity contributed by free tubulin ([Tub]), as estimated by the fluorescence recovery, as shown in A. Solid black line indicates the value estimated for untreated cells. Cyan and magenta curves are the best-fit Hill function for paclitaxel and vinblastine data, respectively. Data points are mean ± SE, obtained by bootstrapping the sample distribution as described in Materials and Methods. (D) Left, example analysis region in a control LLC-PK1 cell stably expressing EB1-EGFP. Individual microtubules are denoted by arrowheads. Middle and right, example kymographs of EB1-EGFP signal collected via 100-ms streaming time-lapse imaging. Local background fluorescence was subtracted (right) before analyzing the temporal EB1-EGFP fluorescence intensity decay along the microtubule lattice. (E) Average EB1-EGFP fluorescence decay on the microtubule lattice; >32 microtubules from >8 cells in each condition. Lighter areas surrounding the curve denote the SEM at each time point. (F) Hydrolysis rate as estimated from the best-fit exponential decay rate. Rates were averaged across each cell for a given condition. ND, an estimate was not determined due to the absence of EB1-EGFP comets. Error bars are mean ± SEM. *p < 0.05 by one-way ANOVA and Kruskal–Wallis, each corrected for multiple comparisons.
Kinetic stabilization by either paclitaxel or vinblastine is not dependent on altering the nucleotide transition rate in vivo
When estimating parameters of dynamic instability (Supplemental Figure S1C), we noted that end-binding protein 1 (EB1) comets tagged with enhanced green fluorescent protein (EGFP) appeared more punctate and were fewer in number after the addition of either paclitaxel or vinblastine, consistent with previous observations (Kapoor and Panda, 2012; Pagano et al., 2012). Because EBs recognize the tubulin nucleotide state (Maurer et al., 2012) and instantaneous stability (Duellberg et al., 2016), this loss of signal could indicate an increased rate of transition between stable and unstable nucleotide states as a direct effect of the MTA, presumably through increased hydrolysis. To determine whether either paclitaxel or vinblastine influences the GTP hydrolysis rate in vivo, we estimated the hydrolysis rate constant ( ) using EB1-EGFP as a reporter for the presence of stable GTP-tubulin in the microtubule lattice, as previously described (Seetapun et al., 2012; Figure 2D). There was little measurable effect of either paclitaxel or vinblastine on the rate of loss of EB1-EGFP signal along the microtubule lattice (Figure 2, E and F) except in cells treated with 100 nM paclitaxel, for which the estimated
  increased from 0.8 to 1.2 s–1 (Figure 2F, dark cyan). Of interest, increased hydrolysis is the opposite effect predicted for an assembly-promoting agent. Increasing
  should promote microtubule polymer disassembly due to difficulty in establishing and maintaining a GTP cap to support growth. Although we could not detect EB1-EGFP comets in the presence of 100 nM vinblastine, this is less likely an effect of hydrolysis than a direct consequence of kinetic stabilization and the lack of distinguishable growth phases (Figures 1B and Supplemental Figure S1). In addition, there was no detectable effect on
  at either 10 nM vinblastine or paclitaxel (Figure 2F), yet effects on dynamics at these concentrations were detectable (Figures 1 and Supplemental Figure S1). Therefore we conclude that any potential hydrolysis effects are not important for kinetic stabilization by paclitaxel and vinblastine. Recent evidence suggests that EB binding to the microtubule is more complicated than we assumed here (Maurer et al., 2012, 2014; Zhang et al., 2015). However, because the amount of EB1 signal at the microtubule plus end is highly correlated with microtubule growth phase and stability (Duellberg et al., 2016), it can be regarded as a direct readout of the presence of more thermodynamically stable (lower
  ) nucleotide state(s) at the plus end. Further, the EB1-EGFP signal decay on the microtubule lattice follows a single exponential, indicative of a first-order process (Figure 2E). The
  value reported here is the first-order transition rate between stable (GTP-tubulin) and unstable (GDP-tubulin) nucleotides, as it has been treated in several models of microtubule dynamics (VanBuren et al., 2002, 2005; Margolin et al., 2012; Padinhateeri et al., 2012; Bowne-Anderson et al., 2013) and in this study (see later discussion). Thus a more complex EB1-binding model does not change our conclusions. Overall we conclude that the primary mechanism(s) of kinetic stabilization by paclitaxel and vinblastine in vivo are not dependent on changes to nucleotide transition rate but instead on the tubulin subunit kinetics and thermodynamics at the microtubule plus end.
Theoretical requirements for the observation of dynamic instability
To understand how MTAs attenuate microtubule dynamics, it is helpful to first define the basic physical requirements underlying the observation of dynamic instability generally. As originally described (Mitchison and Kirschner, 1984), dynamic instability is characterized by the stochastic switching between extended periods of two distinct states, one biased toward net assembly (GTP-tubulin) and the other biased toward net disassembly (GDP-tubulin). To achieve this, the underlying kinetics and thermodynamics of microtubule assembly must establish an energetic difference between states and allow transitions between states. To investigate these physical requirements, we used a computational model of microtubule self-assembly (Figure 3A) that reproduces dynamic instability consistent with a range of experimental observations (VanBuren et al., 2002; Gardner et al., 2011). The model was updated to include our recent estimates of kinetic heterogeneity due to local microtubule end structure (Castle and Odde, 2013), as well as modifications to capture faster growth and shortening rates observed in vivo compared with in vitro while maintaining catastrophe and rescue events (Figure 3A; see also Materials and Methods). Although the parameter values we establish here are specific to tubulin, the physical principles we outline apply generally to any polymer exhibiting dynamic instability.
FIGURE 3:

Expansion of the kinetic and thermodynamic model for microtubule self-assembly to capture more accurately in vivo–like dynamics. (A) Top, base kinetic and thermodynamic model for microtubule assembly as previously described (VanBuren et al., 2002; Gardner et al., 2011). Bottom, minimal additions to the model necessary to capture in vivo–like dynamics (see Materials and Methods). (B) Microtubule net assembly rate for varying lateral (ΔG0lat) and longitudinal (ΔG0long) bond free energy using the in vivo base parameter set,  . The net-rate values shown were obtained from single-state simulations where
  . Supplemental Table S4 gives all other constant parameter values. Contours are the best-fit polynomial to the indicated rate for growth (blue), shortening (red), and zero (black). Blue and red circles denote the reference points for GTP- and GDP-tubulin, respectively. The energy difference between nucleotide states (
 ) is determined by the distance between these reference points and is denoted by the double-headed arrow. (C) Example microtubule life histories simulated using the in vivo parameters in Supplemental Table S4. Dotted line indicates the position of the compliant cell membrane. Outlined regions are magnified in D. (D) Comparison between simulated (solid lines) and experimental (open circles) in vivo microtubule dynamics near the cell membrane. Actual experimental length estimates from the semiautomated tracking routine were offset by 6 μm and 100–140 s for the purpose of comparison and separation.
In a single-state model (i.e., where  and GTP- and GDP-bound subunits are thermodynamically equivalent), the net rate (v) increases with decreasing bond free energy (Figure 3B; see also Figure 1 in VanBuren et al., 2002). This is because net assembly is the small difference between a large number of addition and loss events (Gardner et al., 2011). Lower free energy (i.e., more stable) reduces the rate of subunit loss, thus increasing the disparity between the number of addition and loss events at the end of a growing microtubule: for a shortening microtubule, this decreases the overall shortening rate. In a two-state model, for one state to assemble and the other to disassemble, each energetic (or nucleotide) state must lie on opposite sides of the transition from net disassembly to net assembly (i.e., the contour line where v = 0 nm/s in the single-state model; Figure 3B, black dotted line). By finding those free energy values along the v = 0 nm/s contour we determine the maximum total free energy for net assembly,
  . In our model, this contour is approximately linear with a slope of −1 (Figure 3B), demonstrating an equal trade-off between lateral and longitudinal bond free energy for net assembly. To establish a reference point for the energetic states of GTP- and GDP-tubulin, we identified contours that yield the experimental estimates for the rates of growth and rapid shortening in vivo (Figure 3B). As established previously (VanBuren et al., 2002), the magnitude of the energetic difference between the growth and shortening contours approximates the energy difference between the two nucleotide states (ΔΔG0; Figure 3B). For the in vivo parameter set, we found that ΔΔG0 = + 3.6 kBT (where one kBT unit is proportional to 2.5 kJ/mol = 0.6 kcal/mol) yielded results consistent with experimental observations (Figure 3, C and D) and is consistent with the previously estimated range of +(2.5–4.0) kBT based on in vitro data (VanBuren et al., 2002).
The preferential assembly bias between GTP- and GDP-tubulin states must arise from this inherent energetic difference (ΔΔG0), such that GDP-tubulin is less stable (i.e., more-positive ΔG0tot) compared with GTP-tubulin when binding to an equivalent site. The assembly bias between states cannot simply be a result of differing on-rate constants (i.e., GDP-tubulin is slower or less efficient to incorporate into the lattice) because of the observed delay in rapid disassembly after tubulin dilution (Voter et al., 1991; Walker et al., 1991). It has been proposed that the energy difference is due to lateral bond strain induced by the preferential curled orientation of GDP-tubulin, as evidenced by “ram’s horns” at the tip of shortening microtubules (Mandelkow et al., 1991; Chrétien et al., 1995), compared with the straight orientation of tubulin within the lattice (Desai and Mitchison, 1997; VanBuren et al., 2002, 2005). Recent high-resolution structural data suggest that strain is the result of residue compaction at the longitudinal interface upon GTP hydrolysis (Alushin et al., 2014), which could promote outward curling of GDP-tubulin. Unlike in previous models (VanBuren et al., 2005), we do not make any assumption about what leads to the energetic difference between GTP- and GDP-tubulin but only assume that it exists. We add ΔΔG0 (positive) to GDP-tubulin subunits based on the number of lateral bonds for two reasons: first, it best resembles the unfavorable energy contributions in previous iterations of the model (VanBuren et al., 2002, 2005; Schek et al., 2007; Coombes et al., 2013), and second, regardless of whether the energetic strain of constraining GDP-tubulin in the lattice is specifically localized to lateral (VanBuren et al., 2002, 2005) or longitudinal contacts (Alushin et al., 2014), the existence of the strain requires lateral bonds. For example, a GDP-tubulin subunit without lateral bonds (at the end of a leading PF) is free to relax to its preferred orientation, thus relieving unfavorable energetic strain (ΔΔG0) even if it is localized at the longitudinal bond. Therefore implementing ΔΔG0 in the model based on lateral bonds imposes this requirement for the strain of GDP-tubulin within the lattice. By capturing in vivo–like dynamics, the model serves as a tool to explore the potential mechanisms of kinetic stabilization in vivo, likely by eliminating the energetic difference (ΔΔG0) or the transition between distinct assembly states discussed earlier.
Two distinct theoretical mechanisms for kinetic stabilization consistent with in vivo observations: true kinetic stabilization
Our preceding experimental observations now provide quantitative constraints in defining the theoretical mechanisms of kinetic stabilization using our computational model (Figure 3A). An advantage of this model is that there are only five free parameters,  (Supplemental Tables S3 and S4), each of which can be examined independently for effects on dynamic instability. For simplicity, we did not include MTA on-off kinetics in the model but instead varied individual parameters, which is a reasonable assumption for capturing saturating drug effects of concentrations ≥100 nM (Figures 1E and 2C). Except for
  , the net effect of each free parameter is to influence the rate of association or dissociation of individual tubulin subunits. The number of association events is dictated by the pseudo-first-order on-rate constant,
  , which is the product of the on-rate constant,
  , and the free tubulin concentration, [Tub] (Figure 3A). The first-order dissociation rate,
  , is calculated from the total standard Gibbs free energy,
  , which accounts for the individual bond free energies,
  , as well as the energy difference between nucleotide states,
  (Figure 3A). Although [Tub] is technically a free parameter in the model, we view [Tub] as a reactionary parameter, meaning that its value changes in response to the total amount of polymer through tubulin mass conservation rather than a direct effect of the MTA (Figure 2, B and C). The fact that each parameter can be assigned to these two categories based on their net effect allowed us to initially simplify the parameter pairs when exploring the mechanisms of kinetic stabilization.
When the on- and off-rates  and
and  , respectively, are scaled proportionately, we find that dynamic instability is maintained for up to an ∼10-fold decrease in both parameters (Figure 4, A and B). This suggests that for modest changes in the total bond energy (<2 kBT), dynamic instability can be recovered by mass conservation of [Tub] in vivo, which would decrease or increase
  in response to the initial bond stabilization or destabilization, respectively (diagramed in Figure 4B). Initially, we varied
  by stabilizing the longitudinal bond, although were found similar results when stabilizing the lateral bond (Supplemental Figure S5, A–D). In regions where scaling factors for on- and off-rates are not approximately equal, microtubules either grow continuously out to the cell membrane (blue; positive net rate) or rapidly disassemble and cannot maintain a growth phase (red; negative net rate; Figure 4C). Microtubules in these parameter regions are effectively stabilized, however, if the mechanisms of kinetic stabilization depend on the implemented boundaries (i.e., cell membrane or nucleation point); then we predict that there should either be an accumulation of microtubule ends at the cell edge (net assembly; blue in Figure 4C) or complete disassembly of microtubules back to the centrosome (net disassembly; red in Figure 4C). Experimentally, we observe kinetic stabilization throughout the cytoplasm in both control and MTA-treated cells (Supplemental Figure S1D). Further, microtubules remained visible even at 1 μM vinblastine (Supplemental Figure S1E). Therefore we conclude that singularly stabilizing or destabilizing tubulin subunits through changes in lateral or longitudinal bond free energy alone, as implied by structural data (Nogales et al., 1999; Li et al., 2002; Prota et al., 2013), is insufficient to explain kinetic stabilization by paclitaxel and vinblastine for two reasons. First, modest effects (<2kBT) would be mitigated by tubulin mass conservation comparable to that observed experimentally (Figure 2C). Second, larger effects (where mass conservation could not compensate to recover dynamic instability) would result in a drastic shift in the plus-end distribution, which we did not observe experimentally (Supplemental Figure S1, D and E).
FIGURE 4:
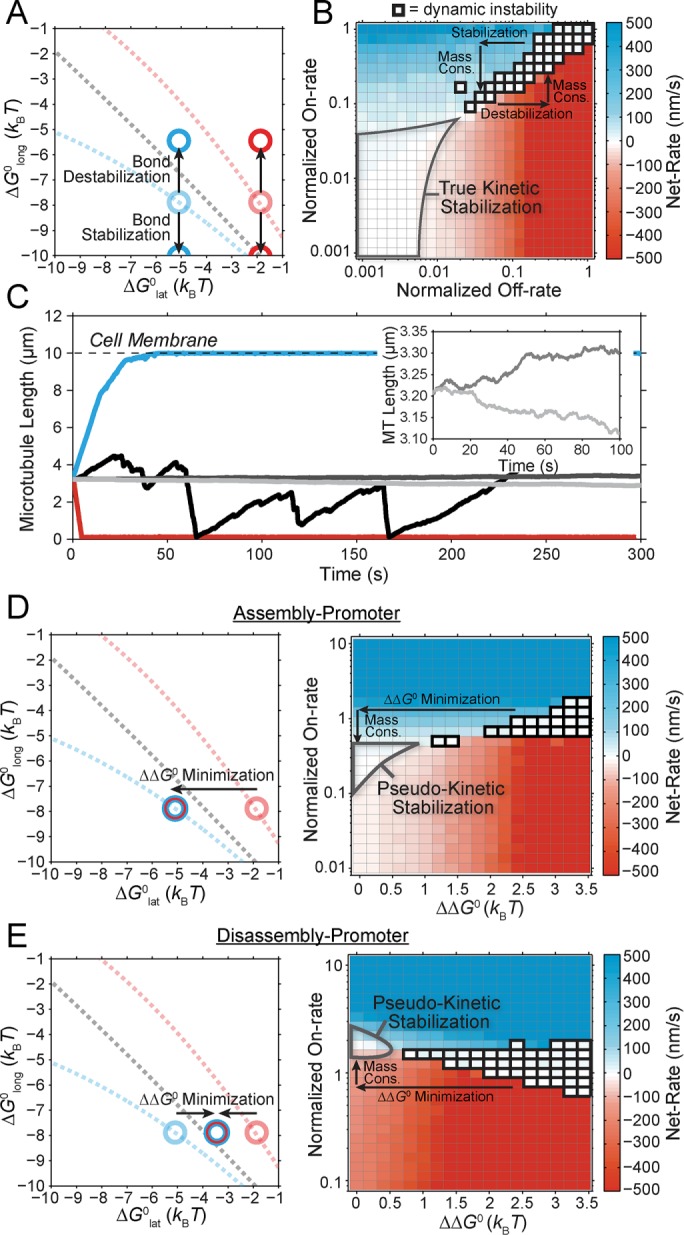
Two distinct mechanisms of kinetic stabilization predicted by the in vivo model. (A) Parameter shifts implemented during uniform bond stabilization and destabilization, where the energy difference between states ( ) is maintained. Dotted lines and lighter circles indicate the reference contours and energetic states, respectively, from Figure 3B. The arrows indicate the manner in which GTP- and GDP-tubulin states shift relative to the reference states (lighter circles) during bond stabilization or destabilization, as in B. (B) Net rate of microtubule assembly as a function of longitudinal bond stabilization (A) and decreasing on-rate,
  . As indicated by the horizontal arrows, bond stabilization or destabilization is a shift to either the left or right, respectively. Because the tubulin concentration factors into the on-rate,
  , mass conservation of tubulin resulting from net polymer assembly or disassembly will lead to a corresponding shift vertically within the parameter space shown here, where polymer disassembly leads to an upward shift (increases [Tub]), and polymer assembly leads to a downward shift (decreases [Tub]). The region outlined in gray indicates where dynamic instability is lost and microtubules have reached a new-steady state (i.e., zero net rate), consistent with kinetic stabilization in vivo. All kinetic rate values were normalized to the base case for in vivo dynamic instability (Supplemental Table S4). (C) Example length vs. time plots for several points in the parameter space in B. Color indicates the resulting microscale dynamics; persistent growth (blue), complete disassembly (red), dynamic instability (black), or kinetic stabilization (gray). Inset, magnified view of the remaining nanoscale dynamics during kinetic stabilization. (D, E) Plots similar to those in A and B for the case of minimizing the energetic difference between GTP- and GDP-tubulin (
 ) by an assembly promoter (D) and disassembly promoter (E). In D, net assembly is promoted by shifting the GDP-tubulin reference point (light red circle) to that of GTP-tubulin. In E, net disassembly is promoted by shifting the GTP-tubulin reference point (light blue circle) toward that of GDP-tubulin. In this case, some stabilization of the GDP-tubulin reference point is necessary so that the convergence point of the energetic states is within ±1 kBT unit of the v = 0 contour (black dotted line). This constraint is based on the observed twofold to threefold shift in the free tubulin concentration after the addition of MTAs (see the text; Figure 2, B and C). On-rate values were normalized to the base case for in vivo dynamic instability (Supplemental Table S4), where
  . The region outlined in gray indicates where dynamic instability is lost and microtubules have reached a new steady state (i.e., zero net rate), consistent with kinetic stabilization in vivo. Bold outlined points in B, D, and E indicate parameter sets where dynamic instability was observed in the length vs. time history according to the criteria described in Materials and Methods.
To reproduce kinetic stabilization that is consistent with in vivo experimental observations (i.e., loss of dynamic instability and near-zero net assembly; Figure 1), more than an order of magnitude effect on both association and dissociation is required (Figure 4B; gray outline). This yields what we refer to as a “true kinetic stabilization” (tKS). As the term kinetic stabilization implies, the underlying kinetic rates of addition and loss are appreciably reduced compared with the control case, although tKS is not a complete pause or loss of dynamics because the nanoscale addition and loss of individual subunits at the microtubule plus end remain, despite near zero net assembly at the microscale (Figure 4C, inset). The fold change in the on-rate required to reach the region of true kinetic stabilization cannot be accounted for by the mass conservation effect on [Tub] observed experimentally in the presence of paclitaxel and vinblastine (Figure 2, B and C, and Supplemental Table S2). Therefore, if either paclitaxel or vinblastine (or any MTA) functions by a true kinetic stabilization mechanism, then it must directly reduce the on-rate constant in addition to stabilizing tubulin–tubulin bonds.
Two distinct theoretical mechanisms for kinetic stabilization consistent with in vivo observations: pseudo-kinetic stabilization
Maintaining dynamic instability (i.e., two-state dynamics) requires a nonzero  , and so minimizing
  could be an alternative MTA mechanism for eliminating dynamic instability. Minimizing
  is equivalent to having the GTP- and GDP-tubulin energetic states converge and will initially promote microtubule assembly or disassembly based on the location of the point of convergence relative to the v = 0 contour (maximum total free energy for net assembly) in the single-state free energy parameter space shown in Figure 3B (black dotted line). Specifically, assembly promoters must converge to the left of this contour (Figure 4D), and disassembly promoters must converge to the right (Figure 4E). We observe a logarithmic relationship between the maximum free energy for net assembly,
  , and [Tub] (unpublished data). Therefore the experimentally estimated shift in [Tub] (Figure 2, A–C) confines the total energy of the resulting single state after
  minimization to within ±ln 3 = ±1 kBT of the original maximum free energy for net assembly (v = 0 contour in Figure 3B) in the control case. Hence even a disassembly promoter that functions by this type of mechanism must stabilize GDP-tubulin to some degree (Figure 4E).
In both cases of  minimization, regions of near-zero net assembly in the absence of dynamic instability appear as
  approaches zero (Figure 4, D and E, right). These regions represent a “pseudo-kinetic stabilization” (pKS) because dynamic instability is lost, yielding an apparent pause-like state, and yet the kinetic rates of addition and loss remain comparable to the control values. This is in contrast to the tKS mechanism described earlier, by which dynamic instability is lost as a result of decreased kinetics. Note that in regions of zero net assembly (gray outline), the average on- and off-rates must balance, and thus the fold change in on-rate along the y-axis in Figure 4, D and E, also reflects the change in the average subunit off-rate from the microtubule plus end. We find that the experimentally observed changes in [Tub] after the addition of MTAs quantitatively agree with those predicted in the case of a MTA that minimizes
  (Figure 5, D and E). Thus pseudo-kinetic stabilization is the result of the thermodynamic convergence to a single-state polymer through the minimization of
  , which in turn pushes the in vivo system toward equilibrium through tubulin mass conservation. Although we do not make an assumption about the basis of
  here, we note that in the context of the three-dimensional mechanochemical assembly model,
  minimization is equivalent to reducing the flexural rigidity (i.e., softening the microtubule) or alleviating the GDP-tubulin preferred angle (VanBuren et al., 2005). Although reducing microtubule flexural rigidity was previously proposed as a potential mechanism for paclitaxel (VanBuren et al., 2005; Mitra and Sept, 2008), we now provide a complete picture of kinetic stabilization in vivo, accounting for tubulin mass conservation in response to the primary effect of the drug.
FIGURE 5:

In vitro model predictions and experimental results identify distinct modes of kinetic stabilization for paclitaxel and vinblastine. (A) Model-predicted trends in microtubule growth rate vs. normalized free tubulin concentration for a true kinetic stabilization mechanism (Figure 4B and Supplemental Figure S2C). The normalized kinetic rates (k/k0), both on- and off-rate, are correspondingly decreased from 1.2 (black) to 0.001 (light gray). (B) Model-predicted trends in microtubule growth rate vs. normalized free tubulin concentration for a pseudo-kinetic stabilization mechanism (Figure 4C and Supplemental Figure S2D), where the energetic difference between nucleotide states ( ) is incrementally decreased from 3.3 (black) to 0.2 kBT (light gray). For each plot in A and B, the tubulin concentration is normalized to the minimum value where growth away from the nucleating seed was detectable (>1 nm/s) for the purpose of comparison. Note that the individual plots in A or B are equivalent to the net-rate values within a single column of the 2D plots shown in Supplemental Figure S2, C or D, respectively (or similarly Figure 4, B or D, for the in vivo parameter set). (C) Summary of the model-predicted reductions in the slope of the growth rate (vg) vs. free tubulin concentration ([Tub]) for in vitro parameters by either true kinetic stabilization (tKS; gray) or pseudo-kinetic stabilization (pKS; black). Lines are either linear or exponential best fit for pseudo-kinetic or true kinetic stabilization, respectively. Reduction of tubulin subunit on-off kinetics by a tKS mechanism results in vg becoming significantly less sensitive to changes in the tubulin concentration (reduced slope) compared with a pKS mechanism, where the on-off kinetics remains high. (D) Example kymographs for microtubules grown under the stated conditions. Black bar indicates the position of the GMPCPP seed. Horizontal and vertical scale bars (white) are 1 µm and 30 s, respectively. (E) In vitro experimental estimates of growth rate across a range of tubulin concentrations in the absence (black) or presence of paclitaxel (cyan) and vinblastine (magenta). Individual points are the average growth rate for individual slide preparations. For each slide, >30 microtubules. All error bars are ± SEM. Indicated slope (m) is linear best fit ± SE. Linear fit to all data across the observed concentration range (solid line) was extrapolated (dashed line) for comparison. Sensitivity of vg with respect to [Tub] is retained in the presence of paclitaxel, consistent with model predictions for pKS, whereas vg becomes less sensitive to changes in [Tub] in the presence of vinblastine, consistent with tKS. *p < 0.05 and **p < 0.01 compared with the control by analysis of covariance (Supplemental Table S5).
Of interest, the model-predicted mechanisms of kinetic stabilization described here are not specific to the chosen in vivo parameter set (Supplemental Table S4). Identical trends are predicted using a previously published parameter set that captures in vitro–like dynamics (Supplemental Table S3 and Supplemental Figure S2). We acknowledge that there could be additional secondary effects of the drug. For example, promoting polymer assembly or disassembly (Figure 2, B and C) will alter the number of potential microtubule-binding sites for MAPs. In addition, EB1 binding to the plus end is reduced in the presence of MTAs due to the loss of dynamics (Supplemental Figure S1). However, because the model can explain all of our experimental observations without invoking MAP effects, it is reasonable to assume that they are inconsequential compared with the primary effects of MTAs on the intrinsic microtubule kinetics and thermodynamics. Further, incorporating drug on-off kinetics into the simulation rather than implementing system-wide parameter changes as in Figure 4 did not change model predictions and observed trends related to the identified mechanisms of kinetic stabilization (Supplemental Figure S3). For simplicity, we assumed a constant binding affinity for all subunits in the microtubule lattice, but experimental evidence suggests that vinblastine binds preferentially to higher-affinity sites at the plus end compared with the microtubule lattice (Wilson et al., 1982; Jordan et al., 1986). Although we do not deny that this may be the case, we note that the unbinding of a tubulin subunit buried in the lattice (i.e., a nonterminal subunit) is extremely rare (VanBuren et al., 2002), such that tubulin on-off dynamics are nearly exclusive to the terminal subunits on each PF. Thus spatially varying MTA affinities will be inconsequential to the overall tubulin addition and loss dynamics, as it is their effect at high-affinity sites at the plus end that will be most pronounced. Owing to the robustness of the model predictions, we conclude that the mechanisms outlined here define the fundamental kinetic and thermodynamic requirements for achieving kinetic stabilization and thus constrain the potential mechanisms of all other MTAs that induce a similar phenotype (Supplemental Table S1).
In vitro observations elucidate the distinct kinetic stabilization mechanisms of paclitaxel and vinblastine
The two model-predicted mechanisms of kinetic stabilization, tKS and pKS, result in a similar microscale assembly phenotype but are inherently different in the underlying nanoscale rates of subunit addition and loss. A classic approach to estimating kinetic rates for linear self-assembly is to construct a plot of growth rate (vg) as a function of free subunit concentration ([Tub]) to obtain the slope and intercept as the estimates of the on- and off-rate constants, respectively (Oosawa and Asakura, 1975; Mitchison and Kirschner, 1984; Walker et al., 1988). It was shown that this approach is fundamentally flawed for analysis of microtubule assembly (Gardner et al., 2011), namely, the slope of this plot is not a direct estimate of the on-rate constant for multi-PF polymers. The slope, however, is still proportional to the sum of the kinetic rate constants. Surprisingly, this type of analysis has not, to our knowledge, been performed with MTAs despite the classification as kinetic stabilizers. We predict that MTAs utilizing a true kinetic stabilization mechanism will reduce the slope of this plot due to a dramatic reduction in the kinetic rates of addition and loss, whereas MTAs that function by a pseudo-kinetic mechanism will have a modest, if any, effect on the slope.
Although we view [Tub] as a reactionary parameter in vivo, it can be independently controlled in purified in vitro assays. Thus we performed analysis using a parameter set that captures in vitro microtubule dynamics (Supplemental Table S3). We found that pKS has a modest effect on the slope (<1.5-fold) as  is minimized, whereas tKS decreases the slope by up to 10- to 30-fold (Figure 5, A–C), depending on whether the stabilization effect is implemented through the lateral or longitudinal bond, respectively. A similar trend is seen in the in vivo parameter set (Figure 4, B, D, and E), with the slope of vg versus [Tub] being equivalent to the gradient of assembly rates (cyan) vertically along the y-axis (see also Supplemental Figure S2). As the on- and off-rates are decreased coordinately in Figure 4B, the assembly rate gradient also decreases, meaning that vg becomes less sensitive to changes in on-rate or, equivalently, [Tub]. By contrast,
  minimization has little effect on the assembly rate gradient (Figure 4, D and E). To examine which mechanism each MTA uses, we estimated microtubule growth rates across a range of free tubulin concentrations in vitro in the presence and absence of paclitaxel or vinblastine (Figure 5D and Supplemental Figure S3). To control for potential secondary changes in [Tub] in the presence of MTAs in vitro, we initiated growth with a small number of GMPCPP seeds and analyzed only tubulin concentrations that did not result in detectable spontaneous nucleation of new microtubules (<12 µM for control; <10 μM for paclitaxel). Although MSD analysis was previously used to estimate kinetic rates in vitro (Gardner et al., 2011), this type of analysis relies on being able to separate growth and shortening events, which, as noted earlier, becomes increasingly difficult as microtubules are kinetically stabilized. Thus our model predicts that the best approach for assessing effects on the kinetic rates in the presence of MTAs is to use the slope of the vg versus [Tub] plot.
We found that both 10 and 100 nM paclitaxel resulted in minimal, if any, reduction in the growth rate at a given [Tub] (Figure 5E), consistent with previous estimates in the absence of secondary changes of [Tub] in vitro (Mohan et al., 2013). Because of these modest effects on growth, any effects of paclitaxel on the slope of vg versus [Tub] are minimal (<2-fold), thus eliminating the possibility of a true kinetic stabilization mechanism for paclitaxel and leaving only the pseudo-kinetic mechanism as a possible explanation (Figure 5, A and C). By contrast, 500 nM vinblastine strongly reduced the estimated vg at all tubulin concentrations and reduced the slope of vg versus [Tub] by ∼3-fold (Figure 5E and Supplemental Table S5). The magnitude of this reduction is consistent with ∼20-fold reduction in the off-rate by tKS but is too large to be consistent with the pseudo-kinetic mechanism ( minimization; Figure 5, A–C). Note that although we observed saturating effects on dynamics at 100 nM vinblastine in vivo, 500 nM did not completely kinetically stabilize microtubules in vitro (Figure 5D and Supplemental Figure S3). This is most likely a result of the stoichiometric differences between the two experimental assays; specifically, free tubulin is confined to a fraction of the total volume of drug containing media in vivo, whereas it permeates throughout the drug-containing solution in vitro. Thus, for drugs that bind readily to free tubulin such as vinblastine, a much higher concentration is necessary in vitro to get comparable stoichiometry to that in vivo. Despite apparently being below saturation in vitro, the slope change in the presence of vinblastine is still too great to be consistent with a pKS mechanism, and higher concentrations would presumably decrease this slope even further. Therefore we conclude that vinblastine uses a tKS mechanism, reducing the kinetic rates of both association and dissociation, whereas paclitaxel induces a thermodynamic convergence of GTP- and GDP-tubulin energetic states to kinetically stabilize microtubules by a pKS mechanism.
Assembly variance constrains the magnitude of in vivo MTA effects
In addition to the slope of the vg versus [Tub] plot, the addition and loss rates are also predicted to influence the observed assembly variability (Gardner et al., 2011), providing a potential method to constrain the magnitude of MTA effects by each mechanism in vivo, where [Tub] cannot easily be controlled independently. As microtubules are kinetically stabilized, the MSD (and similarly  ) of the microtubule plus end is dramatically reduced (Figure 1, E and F). This observed decrease in
  can now be used to quantitatively constrain the kinetic stabilization mechanisms of paclitaxel and vinblastine in vivo. On the basis of our conclusions from in vitro experiments, we considered paclitaxel and vinblastine only in the context of pKS and tKS mechanisms, respectively. For both mechanisms, points where dynamic instability was observed in the model exhibited higher assembly variance, consistent with the control case (Figure 6). Fitting a diffusion coefficient to assembly traces from the model (identical to that performed for experimental data) and constraining to regions of near-zero net assembly, we find that only a relatively small region of parameter space is consistent with experimental estimates in the presence of either MTA (Figure 6). By a tKS mechanism, 100 nM vinblastine is predicted to reduce the off-rate by ∼150-fold and on-rate by ∼30-fold in vivo (Figure 6C and Supplemental Movie S2), independent of whether stabilization is via the longitudinal or lateral bond (Supplemental Figure S5, A–D). For an assembly promoter using a pKS mechanism, the model predicts that ∼0.6 kBT remaining energy difference between GTP- and GDP-tubulin (
 ) is necessary to reproduce the observed assembly variance in the presence of 100 nM paclitaxel (Figure 6D and Supplemental Movie S3). This remaining energy difference between nucleotide states is consistent with the fact that some instances of switching between growth and shortening phases remain in the presence of paclitaxel, unlike vinblastine (Figure 1B and Supplemental Figure S1). Using these estimates for the effect of each MTA, we simulated microtubule dynamics across a range of drug concentrations and measured the resulting
  (Figure 6C). Similar to what we observed experimentally, microtubule assembly variability was initially high at low drug concentrations and decreased as a simple dose–response relation to significantly lower levels of variability at high drug concentrations (compare Figures 1F and 6C).
FIGURE 6:

Microtubule assembly variance in the presence of paclitaxel and vinblastine. (A) Model-predicted net rate (top) of assembly and plus end  (bottom) as a function of longitudinal bond stabilization with concurrent reduction in the on-rate, similar to that shown in Figure 4B. (B) Model-predicted net rate (top) of assembly and plus end
  (bottom) as a function of the energy difference between nucleotide states (
 ) with concurrent reduction in the on-rate, similar to that shown in Figure 4D. All kinetic rate values were normalized to the base case for in vivo dynamic instability (Supplemental Table S4), where
 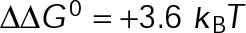 . In A and B, the region defined by dotted black lines indicates where the net rate is approximately zero, including points where dynamic instability was observed (bold outline). Cyan and magenta ellipses indicate the parameter space that is approximately consistent with experimental estimates of net rate and
  in the presence of 100 nM paclitaxel and 100 nM vinblastine, respectively. Asterisks denote the parameter values simulated in C and Supplemental Movies S2 and S3. (C) Model-predicted microtubule assembly variability (
 ) as a function of the simulated drug concentration. Here drug addition-loss kinetics was added to the in vivo simulation (Materials and Methods). Where the drug was bound, tubulin kinetics and thermodynamics were adjusted according to the estimated fits indicated by the asterisks in A and B (bottom) for vinblastine and paclitaxel, respectively. Drug concentrations on the x-axis are normalized to the simulated drug binding affinity (KD), assumed to be 10 nM for each drug, based on experimental observations (Figure 1F).
Vinblastine stabilizes tubulin–tubulin interdimer longitudinal contacts to promote oligomerization in vivo
True kinetic stabilization by vinblastine is predicted to promote stable oligomerization of short filaments in solution due to its stabilizing effect on the longitudinal bond. Conversely, paclitaxel, as a pseudo-kinetic stabilizer, is not predicted to promote oligomerization. In vitro, high concentrations of vinblastine promote the formation of filaments and tubulin spirals (Haskins et al., 1981; Prota et al., 2014). To examine whether this occurs in vivo, we photobleached EGFP–α-tubulin in a region of cytoplasm in LLC-PK1α cells treated with either 100 nM paclitaxel or vinblastine and observed the rate of fluorescence recovery (Figure 7, A and B). As an initial test of the experimental procedure, we bleached regions in cells expressing EGFP, 2xEGFP, and EGFP–α-tubulin in the absence of paclitaxel and vinblastine. We found that diffusion coefficients followed the theoretical trend with respect to molecular weight (Figure 7C), consistent with our previous findings using an orthogonal approach (Seetapun et al., 2012). As a control, 100 nM paclitaxel or vinblastine did not influence the average diffusion coefficient of either EGFP or 2xEGFP (Supplemental Figure S6, A and B). The addition of 100 nM vinblastine did, however, reduce estimated diffusion coefficients of EGFP–α-tubulin, with a measured approximately twofold reduction compared with control (Figure 7, D and E). We conclude that vinblastine promotes tubulin subunit oligomerization in vivo, whereas paclitaxel does not. These results provide additional evidence that vinblastine functions by a true kinetic stabilization mechanism, as the pseudo-kinetic mechanism identified for paclitaxel is not expected to stabilize tubulin–tubulin interactions in solution.
FIGURE 7:

Vinblastine promotes tubulin oligomerization in the cytoplasm. (A) Left, periphery of an LLC-PK1α cell expressing EGFP–α-tubulin. Cross-hairs indicate the position where the laser was centered for photobleaching. Box with dotted line is the region used to create the montage shown on the right. Right, time series of the boxed region showing fluorescence intensity levels during prebleach, postbleach, and recovery. (B) Normalized EGFP–α-tubulin fluorescence in time from the cell shown in A. Red line is the best-fit recovery curve to the data postbleach. (C) Experimental relationship of the average diffusion coefficient with respect to molecular weight using EGFP (dark gray), 2xEGFP (light gray), and EGFP–α-tubulin (black). Dotted line shows the theoretical expectation for the scaling of the diffusion coefficient with respect to molecular weight. (D) Histogram of individual diffusion coefficient estimates for each treatment condition. (E) Average diffusion coefficient for each treatment condition. Error bars are ± SEM. The p values were obtained by one-way ANOVA. Similar values were obtained from a Kruskal–Wallis test comparing the distributions of D for each condition. In each case, the p values were corrected for multiple comparisons.
To test whether oligomerization could explain the reduction of both the on- and off-rate predicted for vinblastine (Figure 6C), we independently tested the effect of higher-order oligomers on the on-rate constant ( ). To do so, we simulated the binding of tubulin subunits to the end of the microtubule by Brownian dynamics, as previously described (Castle and Odde, 2013), while incrementally increasing the number of subunits diffusing together as a single oligomer. As shown in Figure 8A, we found that the estimated on-rate constant scaled approximately as
  , similar to the relationship assumed for actin filament annealing (Sept et al., 1999). According to the diffusion coefficient equations applied in our Brownian dynamics simulations here (Tirado and de la Torre, 1979, 1980), the average oligomer size would have to increase by 2.5–2.9-fold (comparing the median and mean of the diffusion coefficient distributions, respectively) in order to result in the observed decrease of tubulin diffusion in the presence of 100 nM vinblastine (Figure 8B). Assuming an isodesmic model for association in the presence of vinblastine (Na and Timasheff, 1980), tubulin oligomer lengths will be geometrically distributed with an average length (in number of subunits, including single subunits) that is proportional to the free concentration and the interdimer bond free energy (Howard, 2001):
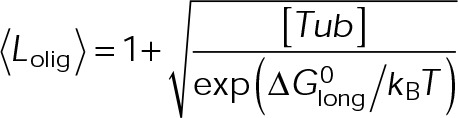 (1) (1)
|
FIGURE 8:
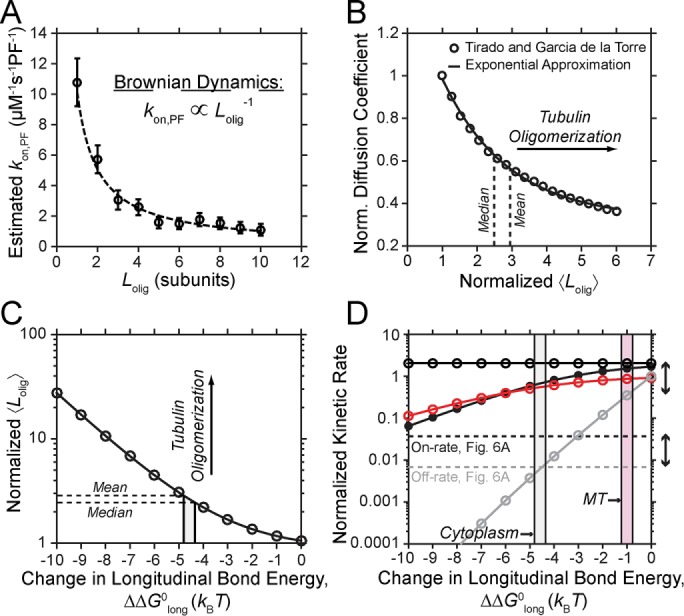
Tubulin oligomerization by vinblastine is consistent with the predicted off-rate reduction but does not influence the subunit on-rate. (A) On-rate constant ( ) vs. oligomer length estimated from Brownian dynamics simulations of tubulin association to the microtubule plus end. Dashed line is best-fit trend line where
  . (B) Diffusion coefficient scaling with respect to oligomerization. Circles are the average diffusion coefficient estimated from the equations for a cylinder (Tirado and de la Torre, 1979, 1980), normalized to that estimated for a single tubulin subunit. Solid line is the best-fit exponential decay to the calculated diffusion coefficients and was used to estimate the change in average oligomer length. Exponential approximation was used to calculate the fold change in average oligomer length necessary to result in the observed reduction of the tubulin diffusion coefficient in the presence of 100 nM vinblastine (dashed lines) using either the median (left) or mean (right) of each distribution. (C) Expected trend from Eq 1 in the average oligomer length as a function of the change in the longitudinal bond free energy (
 ). Dashed lines are the same dashed lines from B. Light gray region is the range of
  values that will result in observed tubulin diffusion decrease in the presence of 100 nM vinblastine. (D) Expected trends in
  (black, open),
  (red), and
  (gray) with respect to strengthening the longitudinal bond free energy (
 ). Dashed lines are the model-predicted effects from Figure 6C for 100 nM vinblastine. Closed black circles show the expected trend in
  when setting an addition cutoff of two subunits, meaning only single subunits are allowed to add to the end of the microtubule. Light gray region is the same shown in C. Whereas the subunit off-rate (
 ) is strongly influenced by stabilization of the longitudinal bond and is consistent with the vinblastine-induced tubulin–tubulin association in the cytoplasm, the resulting oligomerization does not significantly influence the subunit on-rate (
 ). Magenta region is that predicted based on the disparity between
  and
and  (double-headed arrows) from Figure 6C. This
  stabilization plus the induction of an activation barrier by vinblastine could completely account for the effects on
  and
and  in a true kinetic stabilization mechanism (see Discussion).
Accounting for the twofold increase of [Tub] observed in the presence of 100 nM vinblastine (Figure 2C), we estimated the change in the longitudinal bond free energy,  , necessary to reproduce the increase in the average oligomer length. Assuming a base value of
 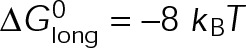 (Supplemental Table S4), to increase the average length by 2.5–2.9 fold, the longitudinal bond must be strengthened by −4.3 kBT to −4.8 kBT (Figure 8C), respectively. We then used Eq 1, the observed trend in
  with respect to oligomer length (Figure 8A), and the equilibrium relationship
 (2) (2)
|
where Klong is the equilibrium constant for the longitudinal interdimer interaction, to examine how the on- and off-rates are expected to vary with the longitudinal bond free energy. As seen in Figure 8D, strengthening the longitudinal bond strongly influences  . Of interest, the stabilization factor predicted using our assembly variance analysis (Figure 6C) crosses the expected trend in
  within the range of values for
  estimated from fluorescence recovery after photobleaching (FRAP) experiments (Figure 8D). Comparatively,
  is less sensitive to bond strengthening, although it is slightly reduced due to the increase in <Lolig>. When we account for the number of subunits added per oligomer, however, any on-rate effects of oligomerization are canceled out because
  scales as
  (Figure 8A). This means that the pseudo first-order on-rate in subunits per second (
 ) is independent of
  (Figure 8D), and therefore oligomerization in the cytoplasm does not affect the rate of subunit addition to the microtubule end. It is possible that oligomers of a certain length are unable to bind to the end of the microtubule due to vinblastine-induced curling of tubulin oligomers (Gigant et al., 2005), such that vinblastine functionally sequesters free tubulin subunits. To see whether this could account for the apparent discrepancy in
  , we set a binding cutoff of two subunits, meaning only single subunits were allowed to bind. However, this was still not sufficient to explain the predicted decrease in the on-rate (Figure 8D). This is because single subunits dominate the oligomer distribution, despite the average length increasing by nearly threefold. Therefore we conclude that the resulting oligomerization in the cytoplasm cannot explain the predicted decrease in the on-rate by vinblastine in a true kinetic stabilization mechanism (Figure 6C). Similarly, sequestering tubulin subunits by promoting tubulin–tubulin interactions in the cytoplasm is not a viable mechanism for inhibiting the rate of subunit binding to the end of the microtubule.
DISCUSSION
In this study, we integrate theoretical and experimental approaches in a systems-level analysis, accounting for both single-tubulin-subunit dynamics and cellular-level tubulin mass conservation, to reveal the molecular mechanisms of kinetic stabilization by paclitaxel and vinblastine. Results from our computational model for microtubule assembly used in this study indicate that there are multiple, distinct pathways that can theoretically lead to the loss of dynamic instability or so-called kinetic stabilization. Of these, only two proposed mechanisms are consistent with both in vivo and in vitro experimental observations. First, equal stabilization of both GTP- and GDP-tubulin via tubulin–tubulin bonds within the microtubule lattice combined with a reduction in the on-rate constant leads to a true kinetic stabilization, in which kinetic rate constants are reduced by orders of magnitude (Figure 4, A and B). Stabilization or destabilization of tubulin–tubulin bonds alone is insufficient to reproduce experimentally observed kinetic stabilization, and thus true kinetic stabilization relies on dual effects: one that effectively destabilizes (reduction in the on-rate constant) and one that stabilizes (more negative  ) the microtubule. In light of this, it is misleading to categorize MTAs simply as stabilizers and destabilizers. Despite its classification as a microtubule destabilizer, we conclude that the main effect of vinblastine is to stabilize tubulin–tubulin interactions. Second, through an alternative mechanism we call pseudo-kinetic stabilization, reducing the energetic difference between GTP- and GDP-tubulin in combination with mass conservation of free tubulin in response to net polymer assembly or disassembly results in a single-state, equilibrium polymer (Figure 4, D and E). Thus we arrive at two distinct mechanisms for the actions of MTAs that both remove the inherent distinction between GTP and GDP-tubulin states: whereas pseudo-kinetic stabilization results from thermodynamic convergence between the two nucleotide states, true kinetic stabilization is a convergence toward low kinetic rates of individual tubulin subunit addition and loss for both states. This provides a theoretical explanation for how MTAs with opposite effects on net polymer assembly ultimately lead to the same observed experimental phenotype; they eliminate experimentally detectable assembly differences between GTP- and GDP-tubulin, thereby violating one of the defining characteristics of dynamic instability.
Kinetic stabilization mechanisms are independent of the initial assembly tendency
We find that neither model-predicted mechanism of kinetic stabilization is fundamentally specific to the initial assembly tendency of the MTA, toward either assembly or disassembly. The initial assembly tendency of an MTA functioning by a true kinetic mechanism will depend on the relative ratio of the drug’s effects on the on- and off-rates; generally an MTA that preferentially inhibits the off-rate will promote polymer assembly, whereas an MTA that preferentially inhibits the on-rate will promote disassembly. Note, however, that it is likely that any MTA functioning as a true kinetic stabilizer will lead to polymer disassembly because as the kinetic on- and off-rates are reduced, GTP hydrolysis within the microtubule lattice eventually overtakes the rate of dimer addition, resulting in loss of the stabilizing GTP cap. In such cases, the less stable GDP-tubulin subunits will be exposed at the plus end and thus will dominate assembly behavior. This is the basis for the observed imbalanced trade-off between kinetic rates when maintaining a near-zero net rate in the model (Figure 4B and Supplemental Figure S2C). Thus even a true kinetic stabilizer that reduces the off-rate more than it reduces the on-rate, which by itself leads to a net thermodynamic stabilization of the microtubule, will result in net depolymerization overall.
As noted, the initial assembly behavior via a pseudo-kinetic stabilization mechanism depends on the thermodynamic convergence point of GTP- and GDP-tubulin relative to the maximum total free energy necessary for microtubule growth,  (Figure 4, D and E). The distance from the convergence point to the
  contour determines the fold change in [Tub] necessary to drive the system to equilibrium through mass conservation. In the limit of assembly, it is possible for all tubulin to assemble into polymer form such that [Tub] goes to zero. In contrast, the extent of increase in [Tub] will be limited by the initial amount of polymer before the addition of an MTA. Our estimates indicate that soluble tubulin is ∼20% of the total tubulin (Figure 2, B and C), such that, at most, [Tub] could increase by fivefold on complete disassembly of microtubules. Thus, whereas in theory, an MTA could make GTP-tubulin energetically comparable to GDP-tubulin (i.e., a convergence point located at the GDP reference point), the increase in [Tub] necessary to reach equilibrium is not possible in these cells, and thus MTA treatment would result in complete disassembly of microtubule polymer.
On the mechanism of kinetic stabilization by paclitaxel
The effects of MTAs on microtubule assembly dynamics have been characterized in terms of the dynamic instability parameters (growth and shortening rates, catastrophe and rescue frequencies; Jordan et al., 1993; Toso et al., 1993; Derry et al., 1995; Dhamodharan et al., 1995; Panda et al., 1996; Yvon et al., 1999; Mohan et al., 2013). Because true kinetic stabilization reduces the on- and off-rates for both nucleotide states, the growth and shortening rates are both expected to be reduced. Indeed, this is what we observed experimentally after addition of vinblastine (Supplemental Figure S1C), consistent with prior published results (Supplemental Table S1). Interpreting growth and shortening is more complicated for a pseudo-kinetic stabilizer, as the decrease in [Tub] due to mass conservation in vivo is expected to reduce the growth rate (Supplemental Figure S1C), as previously observed in the presence of paclitaxel (Jordan et al., 1993; Yvon et al., 1999). In the absence of secondary [Tub] changes, as captured in our in vitro system, the resulting growth and shortening rates depend on the point of GTP- and GDP-tubulin convergence on  minimization. If we assume that the GTP-bound dimers are present at the microtubule end during growth and, conversely, GDP-bound during shortening, then the rate of each will depend upon the relative energetic shift in two-dimensional (2D) parameter space; shifting toward more-negative values (stabilization) will result in a more positive rate (i.e., increase growth and reduce shortening), whereas shifting toward more-positive values (destabilization) will result in a more negative rate (i.e., decrease growth and increase shortening). In the case in which GDP-tubulin converges to the GTP-tubulin energetic state, as we assumed in the model for an assembly promoter, the in vitro growth rate is predicted to be unaffected by the minimization of
  . This is in contrast to the increased growth rate expected for uniform stabilization of both GTP- and GDP-tubulin, as previously noted (Brouhard, 2015). Experimental observations of paclitaxel in vitro indicate that growth rate decreases slightly (Figure 5E; Derry et al., 1995; Mohan et al., 2013; Zanic et al., 2013), which could be explained by a slight destabilization of GTP-tubulin (<0.5 kBT) in the presence of paclitaxel relative to the initial reference point. Because nucleotide states are energetically similar after
  minimization, the model predicts that the resulting equilibrium polymer in a pseudo-kinetic mechanism should no longer exhibit catastrophe, which was the case experimentally in the presence of 100 nM paclitaxel (Figures 5D and Supplemental Figure S3). Thus all of our experimental observations support paclitaxel functioning through a pseudo-kinetic stabilization mechanism.
Further evidence from prior studies supports our conclusion that paclitaxel functions via a pseudo-kinetic stabilization mechanism. First, paclitaxel induces the de novo formation of microtubules from GDP-tubulin at a similar rate as the addition of GTP, suggesting that it induces an assembly-competent thermodynamic state of GDP-tubulin that is similar to GTP-tubulin (Diaz and Andreu, 1993). In addition, recent high-resolution structural evidence shows that paclitaxel induces a GTP-like structure in GDP-tubulin (Alushin et al., 2014). It is still possible that paclitaxel or other assembly-promoting MTAs binding to the taxane site stabilize the lateral contacts between PFs (Nogales et al., 1999; Li et al., 2002; Prota et al., 2013). However, this stabilizing effect would have to be specific to GDP- rather than GTP-tubulin because stabilizing GTP-tubulin lateral contacts would increase the growth rate (Figure 3B) and lead to persistent growth (Figure 4, B and C), which is not observed experimentally. One specific way to stabilize GDP- over GTP-tubulin is to relieve the mechanical strain within the lattice that arises due to the preference for a curved orientation of GDP-tubulin, by either reducing microtubule rigidity (VanBuren et al., 2005) or altering the preferred orientation of GDP-tubulin (Elie-Caille et al., 2007). Within the context of our present model and in previous iterations, the conversion between flexural rigidity and  is linear (VanBuren et al., 2005; Coombes et al., 2013). Thus the model-predicted approximately threefold to fourfold decrease in
  (Figure 6B) is equivalent to an equal decrease in microtubule flexural rigidity and is quantitatively within the range of estimates of microtubule rigidity in the presence of paclitaxel (Dye et al., 1993; Venier et al., 1994; Kurachi et al., 1995; Felgner et al., 1996; Mitra and Sept, 2008; Kawaguchi and Yamaguchi, 2010). Overall the thermodynamic convergence of nucleotide states, as predicted here for paclitaxel, can be explained completely by microtubule softening and is consistent with previous experimental observations.
On the mechanism of kinetic stabilization by vinblastine
We find that vinblastine promotes tubulin self-association in the cytoplasm in vivo, in agreement with previous in vitro results (Na and Timasheff, 1980). This is accomplished by a strengthening of the longitudinal bond at the interdimer interface (Figures 6 and 8), possibly a result of the cross-linking of adjacent contacts (Gigant et al., 2005; Rendine et al., 2010). Our estimated −4.3 to −4.8 kBT bond stabilization is consistent with that predicted in a true kinetic stabilization mechanism; however, as noted, the resulting oligomerization cannot explain the corresponding decrease in the subunit on-rate at the plus end (Figure 8D). How might vinblastine inhibit the binding of tubulin subunits to the end of the microtubule, yet promote oligomerization in the cytoplasm? Despite a strong stabilizing effect of vinblastine, the single longitudinal unbinding rate remains faster than the rate of hydrolysis. Therefore vinblastine-induced oligomers in the cytoplasm will be predominately composed of GTP-tubulin. Conversely, the formation of lateral bonds in the microtubule would allow sufficient time for hydrolysis such that the effects of vinblastine at the microtubule plus end are mostly on GDP-tubulin, which is consistent with the lack of EB1-EGFP comets in the presence of 100 nM vinblastine (Figures 2F and Supplemental Figure S2). Because of its proximity to the E-site on β-tubulin (Gigant et al., 2005), it is plausible that vinblastine would have a stronger stabilization effect on GTP-tubulin (in cytoplasm) versus GDP-tubulin (in the microtubule). As seen in Figure 8D, strengthening of the longitudinal bond establishes the disparity between the on-rate ( ) and the off-rate (
 ). As ΔG0long becomes more negative,
  is reduced relative to
  . On the basis of the disparity between the values from Figure 6C, we estimate that vinblastine stabilizes the longitudinal bond by approximately
  in the microtubule (double-headed arrows Figure 8D), compared with the −4.3 to −4.8 kBT stabilization in the cytoplasm (gray region in Figure 8, C and D). Note that the discrepancy between these two values is approximately equal to the value of
  assumed in the model (Supplemental Tables S3 and S4). The additional reduction necessary in both the on- and off-rate at the microtubule plus end can be explained by the induction of an energetic barrier at the longitudinal interface. Such an energetic barrier would not influence oligomerization in the cytoplasm because it reduces on- and off-rate constants equally, maintaining constant bond free energy. To produce the predicted reduction in the kinetic rates from Figure 6C (plus the
  stabilization noted earlier), this energetic barrier would have to be ∼
 . Based on its binding location at the interdimer longitudinal interface (Gigant et al., 2005), it seems that vinblastine binds in prime location to inhibit association yet stabilize contacts once associated.
Structural evidence suggests that vinblastine bound between adjacent subunits would promote outward curling while stabilizing longitudinal bonds (Gigant et al., 2005). In the context of the model here, this is equivalent to weakening the lateral bond and strengthening the longitudinal bond, which we find conserves dynamic instability rather than results in kinetic stabilization when the effects on each bond are approximately equal (Supplemental Figure S5, E and F). Because vinblastine does not influence the rate of transition between nucleotide states (Figure 2F), the plus end will be dominated by less stable GDP-tubulin subunits after kinetic stabilization. It is difficult to surmise that the vinblastine-induced curling will further destabilize subunits that already have a preference to curl. Note that strengthening the longitudinal bond relative to the lateral is predicted to result in increased microtubule tip taper due to the increased independence of individual PFs (Gardner et al., 2011). Although we observe very long tapers in the presence of vinblastine experimentally, it is unclear whether these structures are a direct result of MTA binding or a secondary effect of other microtubule-binding proteins in vivo that stabilize a subset of PFs against disassembly (Supplemental Figure S6, C–E). Overall we conclude that vinblastine strengthens the longitudinal bond while simultaneously decreasing the rate constants, possibly by creating an activation barrier. Thus, whereas vinblastine is a net microtubule disassembly promoter, it actually acts as a net stabilizer of tubulin–tubulin bonds at the molecular level.
Implications for regulation of dynamic instability by microtubule-associated proteins
The majority of MTAs effectively attenuate microtubule dynamics (Supplemental Table S1). MAPs, by comparison, often enhance microtubule dynamics, such that a combination of MAPs is able to reproduce in vivo–like dynamics in vitro (Kinoshita et al., 2001; Zanic et al., 2013). We find that when  is nonzero, dynamic instability is maintained by the trade-off between lateral and longitudinal bond free energies (Supplemental Figure S5, E and F). Where dynamic instability is observed, microtubules with stronger longitudinal bonds relative to lateral bonds grow faster due to the fact that microtubules with weaker longitudinal bonds must rely on cooperative assembly between PFs. Further, stronger longitudinal bonds will lead to larger tapers at microtubule ends, potentially expediting the aging process that leads to catastrophe (Coombes et al., 2013). Therefore, by influencing the relative ratio of the lateral and longitudinal bond free energies, MAPs could enhance net assembly rates, as well as the transition frequencies between states. Such a trade-off mechanism was suggested as an explanation for the effects of XMAP215 on growth and shortening, where strengthening of the longitudinal bond by −3.6 kBT and modest weakening of the lateral bond by +0.85 kBT explained the increased growth and shortening rates observed in vitro in the presence of XMAP215 (VanBuren et al., 2002, 2005). In addition, microtubule dynamics in vivo is predicted to be robust to relatively small perturbations (±2 kBT) in the individual bond free energies due to mass conservation of tubulin between polymer and the cytoplasm (Figure 4B and Supplemental Figure S2C). Figure 4C shows that whereas dynamic instability is maintained, the resulting steady-state dynamics after mass conservation differs compared with the original state. Thus it is possible in the context of the model to alter overall dynamics of assembly while maintaining dynamic instability as classically defined. In contrast to the mechanisms of kinetic stabilization exhibited by MTAs, these potential MAP effects maintain the inherent difference between GTP- and GDP-tubulin and are relatively modest effects. Because of the rapid nature of addition and loss events at the microtubule end (Gardner et al., 2011), even a modest effect, particularly on the off-rate, can dramatically influence microtubule assembly dynamics.
Implications for cell function and MTA development
If the cumulative consequence of kinetic stabilization by MTAs is the inhibition of cell proliferation, then a drug that uses a true kinetic stabilization mechanism would be a more potent mitotic inhibitor than a pseudo-kinetic stabilizer. Because the kinetic rate constants are significantly reduced in the true kinetic stabilization case, rearrangement of the microtubule array to form a mitotic spindle would be both slower and more difficult, therefore impairing cells’ ability to progress through mitosis. Comparatively, spindle assembly should be retained in the pseudo-kinetic stabilization case, as net disassembly of microtubules at the onset of mitosis would increase the free tubulin concentration (Gliksman et al., 1993). Despite retaining the ability to form a spindle, the loss of dynamic instability would perturb spindle reorganization and correction of kinetochore attachment errors. Thus a pseudo-kinetic mechanism could potentially explain the observation that paclitaxel treatment at low concentrations results in multipolar spindles and chromosome missegregation rather than complete mitotic arrest (Zasadil et al., 2014).
Note that there are, in principle, alternative mechanisms that are predicted to eliminate microtubule dynamic instability (Figure 4 and Supplemental Figure S2). For example, a large (>10-fold) stabilization or destabilization effect would result in persistent growth against the cell membrane or complete disassembly of microtubules, respectively (Figure 4, B and C). As noted, these scenarios would lead to a drastic shift in microtubule plus-end distribution. Therefore it is reasonable to hypothesize that this type of mechanism would result in greater toxicity to healthy cells than with the mechanisms described here, in which the microtubule array is maintained. Attenuation of dynamics without perturbing the plus-end distribution may result in specific targeting of mitotic cells, which exhibit increased dynamics compared with interphase cells (Rusan et al., 2001). Alternatively, persistent microtubule growth may be desirable in other MTA applications, such as axon regeneration after injury (Hellal et al., 2011; Sengottuvel et al., 2011). The observations and model predictions described in this study can be used as a guide to develop drug-screening assays for the detection and design of MTAs that function through a specific mechanism that is most appropriate for a given therapeutic application.
MATERIALS AND METHODS
Model description for in vitro and in vivo microtubule assembly dynamics
All simulations were run in MATLAB R2012b or R2013a (MathWorks) using the pseudomechanical model for microtubule assembly as previously described (VanBuren et al., 2002), with added on-rate penalties of σ1 = 2 and σ2 = 10 to PFs where one or two neighboring PFs were longer by at least one dimer length, respectively (Castle and Odde, 2013). This scaled on-rate constant was also used to calculate the off-rate (see later discussion of Eq 4), based on the type of site created by unbinding or equivalently the number of lateral bonds, such that the equilibrium constant remained fixed. Microtubules were initialized with a length of 400 tubulin dimers and a GTP cap size of four dimer layers. After each event step, if a microtubule shortened to <100 nm in length, it was reinitialized as 13 dimer layers of GTP-tubulin, thus serving as a seed to potentially initiate new microtubule growth. Base in vitro parameters for examining the effects of MTAs are listed in Supplemental Table S3.
Modifications were made to the model for in vivo microtubule assembly (Figure 3A), based on the following arguments, to account for the cellular environment and increased growth rate in vivo compared with in vitro and to promote catastrophe.
A fivefold increase in the on-rate constant was included to account for the estimated effects of macromolecular crowding in a cellular environment (Wieczorek et al., 2013). Alternatively, the increased on-rate constant could be the result of a tethered deliver mechanism as proposed for XMAP215 (Brouhard et al., 2008; Ayaz et al., 2014) or some combination of the two effects.
Within the region where dynamic instability is observed, microtubules with stronger longitudinal bonds relative to lateral bonds grow faster (bottom right, Figure 3B, and Supplemental Figure S4F). Thus a stronger longitudinal (−0.8 kBT) and weaker lateral (+0.7 kBT) bond was used to achieve a growth rate closer to that estimated in vivo. This is similar to an effect previously predicted for XMAP215 (VanBuren et al., 2005).
Because of the increased growth rate in vivo, microtubules have larger caps than in vitro (Seetapun et al., 2012). The experimentally estimated value of
 reproduced this large cap, but catastrophe was no longer observed in the model. Increasing
  could reproduce catastrophe; however, caps were significantly reduced in size, closer to those observed with in vitro parameters. It was suggested that cells might use catastrophe factors to promote catastrophe at high growth rates (Walker et al., 1991). In addition, adding both a growth promoter and a catastrophe promoter to in vitro assays reproduces in vivo–like dynamics (Kinoshita et al., 2001; Zanic et al., 2013). Having already accounted for a growth promoter (points 1 and 2; i.e., XMAP215/ch-TOG), we added the effects of kinesin motors to reproduce catastrophe at the experimentally estimated value of
  . Supplemental Table S4 gives parameters for the kinesin motors. Individual motors were modeled similarly to that for a kinking motor (Coombes et al., 2013). Briefly, motors diffuse along the microtubule lattice bound between the microtubule ends such that only motors determined to have detached can leave the lattice. GTP-tubulin subunits associated with a motor were treated as GDP-tubulin. If a motor was attached to a dissociating subunit, then the motor was moved to the adjacent, more proximal subunit (toward the minus end). Motor attachment, detachment, or step size of bound motors was calculated based on the event time after each tubulin event step (addition, loss, or hydrolysis). Only one motor was allowed to attach per time step.
-
A compliant barrier was added to capture the effects of the cell edge on resulting microtubule dynamics. Assembly against the cell membrane was implemented similarly to assembly under load described in Schek et al. (2007). As the microtubule approaches the membrane, the probability pi that a dimer can add to the end of the ith PF depends on the distance from the membrane and its compliance, such that
where LPF,i is the length of the ith PF, Ld is the length of a single tubulin dimer (8 nm), and f(x) is the probability density function for the position of the cell membrane. We assumed that the membrane has a Gaussian probability density function with mean μ = xcell and variance σ2 = kBT/κcell. The probability of addition is used to scale the pseudo-first-order on-rate constant, (3)
(3)
 , such that
 (4)
From this, the association event time for the ith PF, ti, is calculated as
(4)
From this, the association event time for the ith PF, ti, is calculated as
where rand is a uniformly distributed random number between 0 and 1, and then handled as described in VanBuren et al. (2002). (5)
(5)
To simulate drug kinetics, the potential drug binding and unbinding events were added to the list of total possible events at each time step, and then the event with the minimum time was executed as previously described (VanBuren et al., 2002). We find that the unbinding of tubulin subunits buried within the microtubule lattice is extremely rare in the simulation, such that tubulin kinetics is nearly exclusive to the ends of PFs (VanBuren et al., 2002). Therefore, to minimize total simulation time, especially when the microtubule becomes very long, possible drug events were limited to the terminal three subunits of each PF. For all other subunits in the microtubule lattice, the probability of drug binding or unbinding was calculated as  , where kd is the drug on-rate (
 or off-rate (
 , with KD the drug binding affinity), and tmin is the current time step from the minimum event time. Performing the drug kinetics in this manner served to minimize the total possible events while maintaining the drug binding equilibrium along the length of the microtubule. For all data shown, we assumed the drug on-rate constant was 10 times that of tubulin (
 ); however, similar observations were made in simulations in which the on-rate constants were equal (unpublished data).
Computational code is available upon request.
Analysis of simulation output
Single-state microtubule simulations were run for 10,000 events (addition and loss). Net rate was estimated by linear best fit to the mean PF length versus time, averaged across 10 microtubules. For all dual-state simulations, the mean PF length was recorded every 10 ms of simulation time for a total of either 6 or 4 min for in vitro and in vivo parameter sets, respectively. Ten individual microtubule trajectories were simulated for each point in parameter space. The resulting length-versus-time model output was run through an automated analysis to determine whether the microtubule exhibited dynamic instability, as well as to calculate the growth and shortening rates. Length and time were sampled at fine and coarse intervals of 0.01 and 1 s, respectively. Directional changes were initially determined from the coarse samples as points where the length displacement between sample intervals switched from positive to negative or vice versa. The resulting direction change instances were then further refined via fitting a line to 5 s of fine sampled data before and after the instance in question. If the sign of the slope of each line (positive or negative) was equal, the instance was eliminated as a true direction change. If the signs were opposite, then the instance was retained as a directional change. Growth (positive) or shortening (negative) excursions were calculated as the microtubule length displacement between points of directional change. Dynamic instability was defined by the observation of at least one positive excursion >500 nm and one negative excursion <−500 nm (Rusan et al., 2001). Growth rates were calculated by fitting a line to the coarse sampled data within an individual excursion. Unless a microtubule exhibited dynamic instability, periods where the microtubule was within 500 nm of the boundaries (either cell membrane or nucleating seed) were eliminated from analysis for both in vitro and in vivo parameter sets.
PF length SD (σPF) was calculated from the fine-sampled model output. For each simulated microtubule, the PF length SD was weighted by the duration of the time step according to
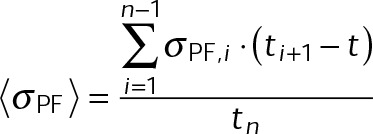 (6) (6)
|
where n is the total number of sampled time points. The result was then averaged across 10 separate simulation trajectories. No weighting was performed in calculating the cumulative density of PF length SDs.
Cell culture and MTA stock solutions
LLC-PK1 porcine epithelial cells stably expressing EGFP–α-tubulin (LLC-PK1α; Rusan et al., 2001) or EB1-EGFP (EB1/GFP-3; Piehl and Cassimeris, 2003) were cultured in Life Technologies Opti-MEM (Invitrogen, Carlsbad, CA) containing 10% fetal bovine serum (Invitrogen) and frozen in medium containing 10% dimethyl sulfoxide (DMSO) and stored in cryovials in liquid nitrogen before plating. Cells were plated at 50,000 cells/dish in MatTek 35-mm No. 1.5 dishes (MatTek, Ashland, MA), and incubated at 37°C in 5% CO2 overnight before imaging. LLC-PK1α cells were fixed in PHEM buffer (60 mM 1,4-piperazinediethanesulfonic acid [PIPES], 25 mM 4-(2-hydroxyethyl)-1-piperazineethanesulfonic acid, 5 mM ethylene glycol tetraacetic acid [EGTA], and 1 mM MgCl) containing 0.25% glutaraldehyde, 3.7% paraformaldehyde, 3.7% sucrose, and 0.1% Triton X-100, as previously described (Seetapun and Odde, 2010; Demchouk et al., 2011).
For in vivo experiments, paclitaxel (Sigma-Aldrich, St. Louis, MO) was stored as a 500 μM stock solution in DMSO at −20°C. Vinblastine sulfate (Sigma-Aldrich) was stored as a 0.1–1 mM stock solution in DMSO at −20°C. Drug stocks were thawed and diluted to 2× working concentration in cell culture medium and then heated to 37°C before medium exchange. For exchange, half of the cell culture medium in dishes was replaced with drug-containing medium 30 min before the onset of imaging. In control experiments, an equivalent volume of DMSO was added to cell culture dishes. Final amount of DMSO did not exceed 1% (vol/vol) in any of the conditions.
For in vitro experiments, paclitaxel was stored as 100 μM and 1 mM stock solutions in DMSO at −20°C and diluted 1000x in ultrapure water before use in experimental assays. The final amount of DMSO did not exceed 0.1% (vol/vol) for any condition. Vinblastine was stored as 100 µM stock in water at −20°C.
In vivo microtubule dynamics measurements
Time-lapse image sequences were acquired using either a Nikon TE200 or TiE epifluorescence inverted microscope (Nikon Instruments, Melville, NY). The Nikon TE200 was equipped with a Ludl BioPrecision stage (Ludl Electronic Products, Hawthorne, NY) under control of MetaMorph, version 7.4, imaging software (Molecular Devices, Sunnyvale, CA). Images were acquired through a 60×/1.49 numerical aperture (NA) Plan Apo TIRF objective with a 2.5x intermediate projection lens (150x total magnification) using a Photometrics CoolSnap HQ2 charge-coupled device (CCD) camera (Photometrics, Tucson, AZ), giving a final image pixel size of 42 nm. A PhotoFluor II metal halide light source (89 North, Burlington, VT) and an ET-EGFP filter set (49002; Chroma, Bellows Falls, VT) were used for single-channel GFP imaging. Images for microtubule dynamics measurements were acquired at 1-s intervals for 1 min with 100% illuminator power and 200- to 300-ms exposure time. Images for estimating hydrolysis rate were acquired by streaming at 100-ms intervals for 20 s. The Nikon TiE was equipped with a Perfect Focus, Prior Scientific motorized stage (Prior Scientific, Rockland, MA) and Andor Zyla5.5 scientific complementary metal-oxide-semiconductor camera (Andor Technology, Belfast, United Kingdom). A 100×/1.49 NA Apo total internal reflection fluorescence (TIRF) objective (Nikon Instruments) resulted in a final pixel sampling size of 65 nm. Images were collected at 500-ms intervals for a total of 1 min using 200-ms exposure under illumination from a SpectraX Light Engine (Lumencor, Beaverton, OR) at 50% power. On both stands, the stage and objective were heated to 37°C for the duration of imaging, with environmental control provided by a BoldLine stage-top incubation system (OkoLab, Pozzuoli, Italy).
Microtubule growth rates and catastrophe frequencies were obtained from time-lapse images of EB1/GFP-3 cells, using the MetaMorph kymograph tool to generate maximum intensity plots along a user-specified line of interest. Growth lengths, times, and velocities for individual microtubules were extracted by clicking on the pixel immediately in front of the brightest part of an EB1 comet in the first and last frames of each observable growth phase. Instances where the net growth length was <500 nm were not counted, and instances where the EB1 comet disappeared and reappeared in subsequent frames without an apparent shortening event were counted as multiple growth events. Catastrophe frequency was calculated by dividing the total number of EB1 comets analyzed by the summed growth time.
Microtubule shortening rates and rescue frequencies were obtained from time-lapse images of LLC-PK1α cells using the MetaMorph kymograph tool as described. Shortening event lengths, times, and velocities for individual microtubules were extracted by clicking on the pixel immediately in front of the brightest pixel at the microtubule tip in the frame immediately preceding a shortening event and at the last frame of an event. Instances where the net shortening length was <500 nm were not counted. Rescue frequency was calculated by dividing the total number of microtubules analyzed by the sum of the shortening time. For the state-independent analysis, microtubule length displacements and PF length SDs were estimated from EGFP–α-tubulin movies by error function fitting of the fluorescence intensity along the microtubule axis using TipTracker software (Demchouk et al., 2011; Prahl et al., 2014) without modification. Occasionally, transport (i.e., microtubule buckling or other net motion of the polymer lattice) was observed by motion of the fluorescent speckle pattern along the microtubule lattice distal to the tip, as previously reported in these cells (Bicek et al., 2009). Events in which tip motion occurred concurrently with a transport event were excluded from the analysis.
GTP hydrolysis rate was estimated as described previously (Seetapun et al., 2012) by fitting an exponential decay to function to the EB1-EGFP fluorescence intensity decay in time along the microtubule lattice. Fluorescence intensity values for fitting were selected from columns (along the time axis) of background-subtracted EB1-EGFP kymographs and normalized to the maximum value. Points for fitting were initiated at the first pixel after the maximum and terminated at the time point of catastrophe or the end of acquisition. A minimum of 20 points (2 s of data) was required for fitting.
In vitro microtubule dynamics measurements
Microtubules were grown from biotinylated, GMPCPP-stabilized seeds using 20% labeled HiLyte488 tubulin in BRB80 buffer (80 mM PIPES, 1 mM EGTA, and 2 mM MgCl2) and imaged by TIRF microscopy. The flow cells were constructed from treated coverslips (Gell et al., 2010) and glass slides separated by double-stick tape and sealed with vacuum grease and VALAP. TIRF data were collected using a customized Zeiss (Carl Zeiss Microscopy, Jena, Germany) Axiovert 200M microscope. Briefly, a 491-nm excitation beam from a Cobalt Calypso laser was expanded, and the collimated beam was ported into the epifluorescence path of the microscope using three mirrors for alignment. The beam was then focused on the back focal plane of a 100×/1.46NA Zeiss objective and steered beyond the critical angle to produce shallow evanescent wave excitation of the samples. The microscope was equipped with a Semrock Di02-R488 dichroic beamsplitter and Chroma ET535/70m emission filter, enclosed in a custom chamber, and heated to 37°C using an AirTherm ATX (World Precision Instruments, Sarasota, FL). Experimental samples were allowed to thermally equilibrate before data collection. Images were collected on a Hamamatsu (Hamamatsu Photonics, Japan) C9100-13 electron-multiplying CCD camera after additional 1.6× Optovar magnification (final 160× magnification). Streaming images were captured with HCImage software using 240-ms exposures and then temporally averaged to a final interval of 2 s for analysis.
Microtubule end position and backbone coordinates were estimated using TipTracker software as previously described (Demchouk et al., 2011; Prahl et al., 2014) using Matlab (R2012b). Microtubule length-versus-time data for each treatment condition were processed using Matlab (R2012b or R2014a) as follows. First, all microtubule length data were filtered using a running SD window of 10 data points (20 s). SDs > 200 nm, corresponding to inaccurate tracking of the microtubule end, were eliminated from analysis. Then periods of microtubule growth were manually selected, and linear regression was performed on each to estimate the growth rate. Growth rates were then averaged across all microtubules for each separate preparation. At least two preparations were performed for each condition. Linear regression of growth rates as a function of tubulin concentration was performed using the aoctool in Matlab.
FRAP experiments and estimating free tubulin fractions
FRAP experiments were performed in the LLC-PK1α cell line using the Nikon TiE stand described earlier. To bleach the region of interest, a 488-nm, 100-mW argon-ion laser (Spectra-Physics, Santa Clara, CA) was focused on the cells to a spot ∼1 μm in diameter using the TI-PAU attachment to direct the laser beam into the rear port of the microscope simultaneously with epi-illumination from a SpectraX Light Engine (Lumencor) with a 50/50 beam splitter. The timing of laser illumination was controlled using a Uniblitz VS35 shutter and VMM-TI shutter driver/timer (Vincent Associates, Rochester, NY) set for 2-s delay and 300-ms exposure. Images were collected at 50-ms intervals under 100% power for a total of 10 s (200 frames) under control of NIS-Elements software (version 4.40; Nikon Instruments). The stage and objective were heated to 37°C for the duration of imaging.
Analysis of fluorescence recovery curves for estimating diffusion coefficients in the cytoplasm was performed in MATLAB R2013a (MathWorks) as described previously (Seetapun et al., 2012). In estimating the free tubulin fraction, the fluorescence decay outside of the bleached region due to epi-illumination was used to obtain a bleach correction factor for each cell. New fluorescence intensities were determined for all frames from
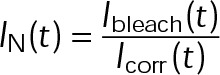 (7) (7)
|
where Ibleach (t) is the average fluorescence intensity within the bleached region at time t, Icorr(t) is the average bleach correction factor intensity at time t, and IN(t) is the new, corrected fluorescence intensity at time t. Values of IN were then normalized as
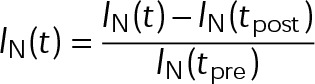 (8) (8)
|
where tpost is the first time point postbleach and tpre is the last frame prebleach. Monomer and polymer fractions (Fmonomer and Fpolymer, respectively) were then estimated by fitting an exponential recovery curve to IN according to
|
|
|
|
where k is the fluorescence recovery rate postbeach due to the diffusion of free tubulin. For each cell, two or three regions were bleached and averaged to estimate the cell-average value of Fmonomer. Bleached regions always contained microtubules and were located adjacent to the cell nucleus for consistency across conditions.
Statistical analysis
Unless otherwise stated, comparisons between experimental conditions were performed by one-way analysis of variance (ANOVA) and with multiple comparisons correction using the anova1 and multcompare functions in MATLAB R2013a. Standard error of the microtubule length displacement statistics and tubulin recovery fractions after photobleaching were estimated using a bootstrapping method. Briefly, a new distribution of equal size was sampled with replacement from the original for 1000 separate instances. Each statistic was calculated from the resulting resamples in order to construct a 95% confidence interval, from which the standard error was calculated.
Supplementary Material
Acknowledgments
We thank Pat Wadsworth (University of Massachusetts Amherst) and Lynne Cassimeris (Lehigh University) for the LLC-PK1 cell lines. Simulations were carried out in part through the use of computing resources at the University of Minnesota Supercomputing Institute. B.T.C. was supported by National Institutes of Health Fellowship T32 EB008389. S.M. was supported by National Institutes of Health Fellowship T32 GM008270. L.S.P. was supported by a 3M Science & Technology Doctoral Fellowship through the University of Minnesota and National Science Foundation Graduate Research Fellowship 00039202. The research was supported by National Institutes of Health grants R01 GM071522 to D.J.O. and R01 GM076177 to D.S. and D.J.O.
Abbreviations used:
- MSD
mean-squared displacement
- MTA
microtubule-targeting agent
- PF
protofilament.
Footnotes
This article was published online ahead of print in MBoC in Press (http://www.molbiolcell.org/cgi/doi/10.1091/mbc.E16-08-0567) on March 15, 2017.
REFERENCES
- Alushin GM, Lander GC, Kellogg EH, Zhang R, Baker D, Nogales E. High-resolution microtubule structures reveal the structural transitions in αβ-tubulin upon GTP hydrolysis. Cell. 2014;157:1117–1129. doi: 10.1016/j.cell.2014.03.053. [DOI] [PMC free article] [PubMed] [Google Scholar]
- Amos LA, Löwe J. How Taxol stabilises microtubule structure. Chem Biol. 1999;6:R65–R69. doi: 10.1016/s1074-5521(99)89002-4. [DOI] [PubMed] [Google Scholar]
- Ayaz P, Munyoki S, Geyer EA, Piedra F-A, Vu ES, Bromberg R, Otwinowski Z, Grishin NV, Brautigam CA, Rice LM. A tethered delivery mechanism explains the catalytic action of a microtubule polymerase. Elife. 2014;3:e03069. doi: 10.7554/eLife.03069. [DOI] [PMC free article] [PubMed] [Google Scholar]
- Bicek AD, Tüzel E, Demtchouk A, Uppalapati M, Hancock WO, Kroll DM, Odde DJ. Anterograde microtubule transport drives microtubule bending in LLC-PK1 epithelial cells. Mol Biol Cell. 2009;20:2943–2953. doi: 10.1091/mbc.E08-09-0909. [DOI] [PMC free article] [PubMed] [Google Scholar]
- Bowne-Anderson H, Zanic M, Kauer M, Howard J. Microtubule dynamic instability: a new model with coupled GTP hydrolysis and multistep catastrophe. Bioessays. 2013;35:452–461. doi: 10.1002/bies.201200131. [DOI] [PMC free article] [PubMed] [Google Scholar]
- Brouhard GJ. Dynamic instability 30 years later: complexities in microtubule growth and catastrophe. Mol Biol Cell. 2015;26:1207–1210. doi: 10.1091/mbc.E13-10-0594. [DOI] [PMC free article] [PubMed] [Google Scholar]
- Brouhard GJ, Stear JH, Noetzel TL, Al-Bassam J, Kinoshita K, Harrison SC, Howard J, Hyman AA. XMAP215 is a processive microtubule polymerase. Cell. 2008;132:79–88. doi: 10.1016/j.cell.2007.11.043. [DOI] [PMC free article] [PubMed] [Google Scholar]
- Castle BT, Odde DJ. Brownian dynamics of subunit addition-loss kinetics and thermodynamics in linear polymer self-assembly. Biophys J. 2013;105:2528–2540. doi: 10.1016/j.bpj.2013.10.009. [DOI] [PMC free article] [PubMed] [Google Scholar]
- Chrétien D, Fuller SD, Karsenti E. Structure of growing microtubule ends: two-dimensional sheets close into tubes at variable rates. J Cell Biol. 1995;129:1311–1328. doi: 10.1083/jcb.129.5.1311. [DOI] [PMC free article] [PubMed] [Google Scholar]
- Coombes CE, Yamamoto A, Kenzie MR, Odde DJ, Gardner MK. Evolving tip structures can explain age-dependent microtubule catastrophe. Curr Biol. 2013;23:1342–1348. doi: 10.1016/j.cub.2013.05.059. [DOI] [PMC free article] [PubMed] [Google Scholar]
- Demchouk AO, Gardner MK, Odde DJ. Microtubule tip tracking and tip structures at the nanometer scale using digital fluorescence microscopy. Cell Mol Bioeng. 2011;4:192–204. doi: 10.1007/s12195-010-0155-6. [DOI] [PMC free article] [PubMed] [Google Scholar]
- Derry WB, Wilson L, Jordan MA. Substoichiometric binding of taxol suppresses microtubule dynamics. Biochemistry. 1995;34:2203–2211. doi: 10.1021/bi00007a014. [DOI] [PubMed] [Google Scholar]
- Desai A, Mitchison TJ. Microtubule polymerization dynamics. Annu Rev Cell Dev Biol. 1997;13:83–117. doi: 10.1146/annurev.cellbio.13.1.83. [DOI] [PubMed] [Google Scholar]
- Dhamodharan R, Jordan MA, Thrower D, Wilson L, Wadsworth P. Vinblastine suppresses dynamics of individual microtubules in living interphase cells. Mol Biol Cell. 1995;6:1215–1229. doi: 10.1091/mbc.6.9.1215. [DOI] [PMC free article] [PubMed] [Google Scholar]
- Diaz JF, Andreu JM. Assembly of purified GDP-tubulin into microtubules induced by taxol and taxotere: reversibility, ligand stoichiometry, and competition. Biochemistry. 1993;32:2747–2755. doi: 10.1021/bi00062a003. [DOI] [PubMed] [Google Scholar]
- Dorléans A, Gigant B, Ravelli RBG, Mailliet P, Mikol V, Knossow M. Variations in the colchicine-binding domain provide insight into the structural switch of tubulin. Proc Natl Acad Sci USA. 2009;106:13775–13779. doi: 10.1073/pnas.0904223106. [DOI] [PMC free article] [PubMed] [Google Scholar]
- Duellberg C, Cade NI, Holmes D, Surrey T. The size of the EB cap determines instantaneous microtubule stability. Elife. 2016;5:e13470. doi: 10.7554/eLife.13470. [DOI] [PMC free article] [PubMed] [Google Scholar]
- Dumontet C, Jordan MA. Microtubule-binding agents: a dynamic field of cancer therapeutics. Nat Rev Drug Discov. 2010;9:790–803. doi: 10.1038/nrd3253. [DOI] [PMC free article] [PubMed] [Google Scholar]
- Dye RB, Fink SP, Williams RC. Taxol-induced flexibility of microtubules and its reversal by MAP-2 and Tau. J Biol Chem. 1993;268:6847–6850. [PubMed] [Google Scholar]
- Elie-Caille C, Severin F, Helenius J, Howard J, Muller DJ, Hyman AA. Straight GDP-tubulin protofilaments form in the presence of Taxol. Curr Biol. 2007;17:1765–1770. doi: 10.1016/j.cub.2007.08.063. [DOI] [PubMed] [Google Scholar]
- Felgner H, Frank R, Schliwa M. Flexural rigidity of microtubules measured with the use of optical tweezers. J Cell Sci. 1996;109:509–516. doi: 10.1242/jcs.109.2.509. [DOI] [PubMed] [Google Scholar]
- Gardner MK, Charlebois BD, Jánosi IM, Howard J, Hunt AJ, Odde DJ. Rapid microtubule self-assembly kinetics. Cell. 2011;146:582–592. doi: 10.1016/j.cell.2011.06.053. [DOI] [PMC free article] [PubMed] [Google Scholar]
- Gell C, Bormuth V, Brouhard GJ, Cohen DN, Diez S, Friel CT, Helenius J, Nitzsche B, Petzold H, Ribbe J, et al. Microtubule dynamics reconstituted in vitro and imaged by single-molecule fluorescence microscopy. Methods Cell Biol. 2010;95:221–245. doi: 10.1016/S0091-679X(10)95013-9. [DOI] [PubMed] [Google Scholar]
- Gigant B, Wang C, Ravelli RBG, Roussi F, Steinmetz MO, Curmi PA, Sobel A, Knossow M. Structural basis for the regulation of tubulin by vinblastine. Nature. 2005;435:519–522. doi: 10.1038/nature03566. [DOI] [PubMed] [Google Scholar]
- Gliksman NR, Skibbens RV, Salmon ED. How the transition frequencies of microtubule dynamic instability (nucleation, catastrophe, and rescue) regulate microtubule dynamics in interphase and mitosis: analysis using a Monte Carlo computer simulation. Mol Biol Cell. 1993;4:1035–1050. doi: 10.1091/mbc.4.10.1035. [DOI] [PMC free article] [PubMed] [Google Scholar]
- Gregoretti IV, Margolin G, Alber MS, Goodson HV. Insights into cytoskeletal behavior from computational modeling of dynamic microtubules in a cell-like environment. J Cell Sci. 2006;119:4781–4788. doi: 10.1242/jcs.03240. [DOI] [PubMed] [Google Scholar]
- Haskins KM, Donoso JA, Himes RH. Spirals and paracrystals induced by Vinca alkaloids: evidence that microtubule-associated proteins act as polycations. J Cell Sci. 1981;47:237–247. doi: 10.1242/jcs.47.1.237. [DOI] [PubMed] [Google Scholar]
- Hellal F, Hurtado A, Ruschel J, Laskowski CJ, Umlauf M, Kapitein LC, Strikis D, Lemmon V, Bixby J, et al. Microtubule stabilization reduces scarring and causes axon regeneration after spinal cord injury. Science. 2011;331:928–931. doi: 10.1126/science.1201148. [DOI] [PMC free article] [PubMed] [Google Scholar]
- Howard J. Mechanics of Motor Proteins and the Cytoskeleton. Sunderland, MA: Sinauer Associates; 2001. [Google Scholar]
- Howard J, Hyman AA. Microtubule polymerases and depolymerases. Curr Opin Cell Biol. 2007;19:31–35. doi: 10.1016/j.ceb.2006.12.009. [DOI] [PubMed] [Google Scholar]
- Jordan MA, Kamath K. How do microtubule-targeted drugs work. An overview. Curr Cancer Drug Targets. 2007;7:730–742. doi: 10.2174/156800907783220417. [DOI] [PubMed] [Google Scholar]
- Jordan MA, Margolis RL, Himes RH, Wilson L. Identification of a distinct class of vinblastine binding sites on microtubules. J Mol Biol. 1986;187:61–73. doi: 10.1016/0022-2836(86)90406-7. [DOI] [PubMed] [Google Scholar]
- Jordan MA, Toso RJ, Thrower D, Wilson L. Mechanism of mitotic block and inhibition of cell proliferation by taxol at low concentrations. Proc Natl Acad Sci USA. 1993;90:9552–9556. doi: 10.1073/pnas.90.20.9552. [DOI] [PMC free article] [PubMed] [Google Scholar]
- Jordan MA, Wilson L. Microtubules as a target for anticancer drugs. Nat Rev Cancer. 2004;4:253–265. doi: 10.1038/nrc1317. [DOI] [PubMed] [Google Scholar]
- Kapoor S, Panda D. Kinetic stabilization of microtubule dynamics by indanocine perturbs EB1 localization, induces defects in cell polarity and inhibits migration of MDA-MB-231 cells. Biochem Pharmacol. 2012;83:1495–1506. doi: 10.1016/j.bcp.2012.02.012. [DOI] [PubMed] [Google Scholar]
- Kawaguchi K, Ishiwata S, Yamashita T. Temperature dependence of the flexural rigidity of single microtubules. Biochem Biophys Res Commun. 2008;366:637–642. doi: 10.1016/j.bbrc.2007.11.162. [DOI] [PubMed] [Google Scholar]
- Kawaguchi K, Yamaguchi A. Temperature dependence rigidity of non-taxol stabilized single microtubules. Biochem Biophys Res Commun. 2010;402:66–69. doi: 10.1016/j.bbrc.2010.09.112. [DOI] [PubMed] [Google Scholar]
- Kinoshita K, Arnal I, Desai A, Drechsel DN, Hyman AA. Reconstitution of physiological microtubule dynamics using purified components. Science. 2001;294:1340–1343. doi: 10.1126/science.1064629. [DOI] [PubMed] [Google Scholar]
- Kurachi M, Hoshi M, Tashiro H. Buckling of a single microtubule by optical trapping forces: direct measurement of microtubule rigidity. Cell Motil Cytoskeleton. 1995;30:221–228. doi: 10.1002/cm.970300306. [DOI] [PubMed] [Google Scholar]
- Li H, DeRosier DJ, Nicholson WV, Nogales E, Downing KH. Microtubule structure at 8 Å resolution. Structure. 2002;10:1317–1328. doi: 10.1016/s0969-2126(02)00827-4. [DOI] [PubMed] [Google Scholar]
- Mandelkow EM, Mandelkow E, Milligan RA. Microtubule dynamics and microtubule caps: a time-resolved cryo-electron microscopy study. J. Cell Biol. 1991;114:977–991. doi: 10.1083/jcb.114.5.977. [DOI] [PMC free article] [PubMed] [Google Scholar]
- Margolin G, Gregoretti IV, Cickovski TM, Li C, Shi W, Alber MS, Goodson HV. The mechanisms of microtubule catastrophe and rescue: implications from analysis of a dimer-scale computational model. Mol Biol Cell. 2012;23:642–656. doi: 10.1091/mbc.E11-08-0688. [DOI] [PMC free article] [PubMed] [Google Scholar]
- Maurer SP, Cade NI, Bohner G, Gustafsson N, Boutant E, Surrey T. EB1 accelerates two conformational transitions important for microtubule maturation and dynamics. Curr Biol. 2014;24:372–384. doi: 10.1016/j.cub.2013.12.042. [DOI] [PMC free article] [PubMed] [Google Scholar]
- Maurer SP, Fourniol FJ, Bohner G, Moores CA, Surrey T. EBs recognize a nucleotide-dependent structural cap at growing microtubule ends. Cell. 2012;149:371–382. doi: 10.1016/j.cell.2012.02.049. [DOI] [PMC free article] [PubMed] [Google Scholar]
- Mitchison TJ, Kirschner MW. Some thoughts on the partitioning of tubulin between monomer and polymer under conditions of dynamic instability. Cell Biophys. 1987;11:35–55. doi: 10.1007/BF02797111. [DOI] [PubMed] [Google Scholar]
- Mitchison T, Kirschner M. Dynamic instability of microtubule growth. Nature. 1984;312:237–242. doi: 10.1038/312237a0. [DOI] [PubMed] [Google Scholar]
- Mitra A, Sept D. Taxol allosterically alters the dynamics of the tubulin dimer and increases the flexibility of microtubules. Biophys J. 2008;95:3252–3258. doi: 10.1529/biophysj.108.133884. [DOI] [PMC free article] [PubMed] [Google Scholar]
- Mohan R, Katrukha EA, Doodhi H, Smal I, Meijering E, Kapitein LC, Steinmetz MO, Akhmanova A. End-binding proteins sensitize microtubules to the action of microtubule-targeting agents. Proc Natl Acad Sci USA. 2013;110:8900–8905. doi: 10.1073/pnas.1300395110. [DOI] [PMC free article] [PubMed] [Google Scholar]
- Na GC, Timasheff SN. Thermodynamic linkage between tubulin self-association and the binding of vinblastine. Biochemistry. 1980;19:1355–1365. doi: 10.1021/bi00548a014. [DOI] [PubMed] [Google Scholar]
- Nogales E, Whittaker M, Milligan RA, Downing KH. High-resolution model of the microtubule. Cell. 1999;96:79–88. doi: 10.1016/s0092-8674(00)80961-7. [DOI] [PubMed] [Google Scholar]
- Oosawa F, Asakura S. Thermodynamics of the Polymerization of Protein. New York: Academic Press; 1975. [Google Scholar]
- Padinhateeri R, Kolomeisky AB, Lacoste D. Random hydrolysis controls the dynamic instability of microtubules. Biophys J. 2012;102:1274–1283. doi: 10.1016/j.bpj.2011.12.059. [DOI] [PMC free article] [PubMed] [Google Scholar]
- Pagano A, Honoré S, Mohan R, Berges R, Akhmanova A, Braguer D. Epothilone B inhibits migration of glioblastoma cells by inducing microtubule catastrophes and affecting EB1 accumulation at microtubule plus ends. Biochem Pharmacol. 2012;84:432–443. doi: 10.1016/j.bcp.2012.05.010. [DOI] [PubMed] [Google Scholar]
- Panda D, Jordan MA, Chu KC, Wilson L. Differential effects of vinblastine on polymerization and dynamics at opposite microtubule ends. J Biol Chem. 1996;271:29807–29812. doi: 10.1074/jbc.271.47.29807. [DOI] [PubMed] [Google Scholar]
- Piehl M, Cassimeris L. Organization and dynamics of growing microtubule plus ends during early mitosis. Mol Biol Cell. 2003;14:916–925. doi: 10.1091/mbc.E02-09-0607. [DOI] [PMC free article] [PubMed] [Google Scholar]
- Prahl LS, Castle BT, Gardner MK, Odde DJ. Quantitative analysis of microtubule self-assembly kinetics and tip structure. Methods Enzymol. 2014;540:35–52. doi: 10.1016/B978-0-12-397924-7.00003-0. [DOI] [PubMed] [Google Scholar]
- Prota AE, Bargsten K, Zurwerra D, Field JJ, Díaz JF, Altmann K-H, Steinmetz MO. Molecular mechanism of action of microtubule-stabilizing anticancer agents. Science. 2013;339:587–590. doi: 10.1126/science.1230582. [DOI] [PubMed] [Google Scholar]
- Prota AE, Danel F, Bachmann F, Bargsten K, Buey RM, Pohlmann J, Reinelt S, Lane H, Steinmetz MO. The novel microtubule-destabilizing drug BAL27862 binds to the colchicine site of tubulin with distinct effects on microtubule organization. J Mol Biol. 2014;426:1848–1860. doi: 10.1016/j.jmb.2014.02.005. [DOI] [PubMed] [Google Scholar]
- Rendine S, Pieraccini S, Sironi M. Vinblastine perturbation of tubulin protofilament structure: a computational insight. Phys Chem Chem Phys. 2010;12:15530–15536. doi: 10.1039/c0cp00594k. [DOI] [PubMed] [Google Scholar]
- Rusan NM, Fagerstrom CJ, Yvon aM, Wadsworth P. Cell cycle-dependent changes in microtubule dynamics in living cells expressing green fluorescent protein-alpha tubulin. Mol Biol Cell. 2001;12:971–980. doi: 10.1091/mbc.12.4.971. [DOI] [PMC free article] [PubMed] [Google Scholar]
- Schek HT, Gardner MK, Cheng J, Odde DJ, Hunt AJ. Microtubule assembly dynamics at the nanoscale. Curr Biol. 2007;17:1445–1455. doi: 10.1016/j.cub.2007.07.011. [DOI] [PMC free article] [PubMed] [Google Scholar]
- Seetapun D, Castle BT, McIntyre AJ, Tran PT, Odde DJ. Estimating the microtubule GTP cap size in vivo. Curr Biol. 2012;22:1681–1687. doi: 10.1016/j.cub.2012.06.068. [DOI] [PMC free article] [PubMed] [Google Scholar]
- Seetapun D, Odde DJ. Cell-length-dependent microtubule accumulation during polarization. Curr Biol. 2010;20:979–988. doi: 10.1016/j.cub.2010.04.040. [DOI] [PubMed] [Google Scholar]
- Sengottuvel V, Leibinger M, Pfreimer M, Andreadaki A, Fischer D. Taxol facilitates axon regeneration in the mature CNS. J Neurosci. 2011;31:2688–2699. doi: 10.1523/JNEUROSCI.4885-10.2011. [DOI] [PMC free article] [PubMed] [Google Scholar]
- Sept D, MacKintosh FC. Microtubule elasticity: connecting all-atom simulations with continuum mechanics. Phys Rev Lett. 2010;104:018101. doi: 10.1103/PhysRevLett.104.018101. [DOI] [PubMed] [Google Scholar]
- Sept D, Xu J, Pollard TD, McCammon JA. Annealing accounts for the length of actin filaments formed by spontaneous polymerization. Biophys J. 1999;77:2911–2919. doi: 10.1016/s0006-3495(99)77124-9. [DOI] [PMC free article] [PubMed] [Google Scholar]
- Tirado MM, de la Torre JG. Translational friction coefficients of rigid, symmetric top macromolecules. Application to circular cylinders. J Chem Phys. 1979;71:2581. [Google Scholar]
- Tirado MM, de la Torre JG. Rotational dynamics of rigid, symmetric top macromolecules. Application to circular cylinders. J Chem Phys. 1980;73:1986. [Google Scholar]
- Toso RJ, Jordan MA, Farrell KW, Matsumoto B, Wilson L. Kinetic stabilization of microtubule dynamic instability in vitro by vinblastine. Biochemistry. 1993;32:1285–1293. doi: 10.1021/bi00056a013. [DOI] [PubMed] [Google Scholar]
- VanBuren V, Cassimeris L, Odde DJ. Mechanochemical model of microtubule structure and self-assembly kinetics. Biophys J. 2005;89:2911–2926. doi: 10.1529/biophysj.105.060913. [DOI] [PMC free article] [PubMed] [Google Scholar]
- VanBuren V, Odde DJ, Cassimeris L. Estimates of lateral and longitudinal bond energies within the microtubule lattice. Proc Natl Acad Sci USA. 2002;99:6035–6040. doi: 10.1073/pnas.092504999. [DOI] [PMC free article] [PubMed] [Google Scholar]
- Venier P, Maggs AC, Carlier MF, Pantaloni D. Analysis of microtubule rigidity using hydrodynamic flow and thermal fluctuations. J Biol Chem. 1994;269:13353–13360. [PubMed] [Google Scholar]
- Voter WA, O’Brien ET, Erickson HP. Dilution-induced disassembly of microtubules: relation to dynamic instability and the GTP cap. Cell Motil Cytoskeleton. 1991;18:55–62. doi: 10.1002/cm.970180106. [DOI] [PubMed] [Google Scholar]
- Walker RA, O’Brien ET, Pryer NK, Soboeiro MF, Voter WA, Erickson HP, Salmon ED. Dynamic instability of individual microtubules analyzed by video light microscopy: rate constants and transition frequencies. J Cell Biol. 1988;107:1437–1448. doi: 10.1083/jcb.107.4.1437. [DOI] [PMC free article] [PubMed] [Google Scholar]
- Walker RA, Pryer NK, Salmon ED. Dilution of individual microtubules observed in real time in vitro: evidence that cap size is small and independent of elongation rate. J Cell Biol. 1991;114:73–81. doi: 10.1083/jcb.114.1.73. [DOI] [PMC free article] [PubMed] [Google Scholar]
- Wieczorek M, Chaaban S, Brouhard GJ. Macromolecular crowding pushes catalyzed microtubule growth to near the theoretical limit. Cell Mol Bioeng. 2013;6:383–392. [Google Scholar]
- Wilson L, Jordan MA, Morse A, Margolis RL. Interaction of vinblastine with steady-state microtubules in vitro. J Mol Biol. 1982;159:125–149. doi: 10.1016/0022-2836(82)90035-3. [DOI] [PubMed] [Google Scholar]
- Yu D, Pessino V, Kuei S, Valentine MT. Mechanical and functional properties of epothilone-stabilized microtubules. Cytoskeleton (Hoboken) 2013;70:74–84. doi: 10.1002/cm.21091. [DOI] [PubMed] [Google Scholar]
- Yvon AM, Wadsworth P, Jordan MA. Taxol suppresses dynamics of individual microtubules in living human tumor cells. Mol Biol Cell. 1999;10:947–959. doi: 10.1091/mbc.10.4.947. [DOI] [PMC free article] [PubMed] [Google Scholar]
- Zanic M, Widlund PO, Hyman AA, Howard J. Synergy between XMAP215 and EB1 increases microtubule growth rates to physiological levels. Nat Cell Biol. 2013;15:688–693. doi: 10.1038/ncb2744. [DOI] [PubMed] [Google Scholar]
- Zasadil LM, Andersen KA, Yeum D, Rocque GB, Wilke LG, Tevaarwerk AJ, Raines RT, Burkard ME, Weaver BA. Cytotoxicity of paclitaxel in breast cancer is due to chromosome missegregation on multipolar spindles. Sci Transl Med. 2014;6:229ra43. doi: 10.1126/scitranslmed.3007965. [DOI] [PMC free article] [PubMed] [Google Scholar]
- Zhang R, Alushin GM, Brown A, Nogales E. Mechanistic origin of microtubule dynamic instability and its modulation by EB proteins. Cell. 2015;162:849–859. doi: 10.1016/j.cell.2015.07.012. [DOI] [PMC free article] [PubMed] [Google Scholar]
Associated Data
This section collects any data citations, data availability statements, or supplementary materials included in this article.