

SUMMARY
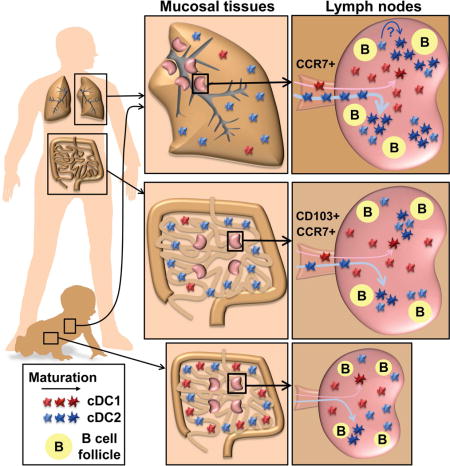
Maturation and migration to lymph nodes (LNs) constitutes a central paradigm in conventional dendritic cell (cDC) biology, but remains poorly defined in humans. Using our organ donor tissue resource, we analyzed cDC subset distribution, maturation and migration in mucosal tissues (lungs, intestines), associated lymph nodes (LNs), and other lymphoid sites from 78 individuals aged <1–93years. The distribution of cDC1 (CD141hiCD13hi) and cDC2 (Sirp-α+CD1c+) subsets was a function of tissue site and conserved between donors. We identified cDC2 as the major mature (HLA-DRhi) subset in LNs with the highest frequency in lung-draining LNs. Mature cDC2 in mucosal-draining LNs expressed tissue-specific markers derived from the paired mucosal site, reflecting their tissue-migratory origin. These distribution and maturation patterns were largely maintained throughout life, with site-specific variations. Our findings provide evidence for localized DC tissue surveillance and reveal a lifelong division of labor between DC subsets, with cDC2 functioning as guardians of the mucosa.
Keywords: Human Immunology, Dendritic cells, Tissue immunity, Mucosal Immunity
eTOC Blurb
Dendritic cells (DCs) function as tissue sentinels, but this role is difficult to study in humans. In this issue of Immunity, Granot et al. show through analysis of lymphoid and mucosal tissues that human DC maturation is tissue-specific, associated with migration phenotypes, and is predominantly observed among the cDC2 subset.
INTRODUCTION
The context in which antigens are presented to T cells is critical for the initiation of adaptive immune responses to diverse antigens including pathogens, tumors, autoantigens, and allergens. At the heart of this process lay dendritic cells (DCs), which can be subdivided into interferon-producing plasmacytoid (pDC), monocyte-derived (MoDC), and classical or conventional (cDC), the latter which most efficiently promote naïve T cell activation (for reviews, see (Merad et al., 2013; Steinman, 2011)). In mice, cDCs have been classified into two major subsets (Guilliams et al., 2014): cDC1 which express CD8α or CD103, and specialize in cross-presentation to CD8+ T cells critical for immunity against intracellular pathogens, viruses and cancer (Allan et al., 2003; Hildner et al., 2008; Pooley et al., 2001; Sung et al., 2006), and cDC2 which express CD11b, and promotes CD4+ T cell differentiation into subsets specializing in anti-viral, -fungal or -helminth immunity (Plantinga et al., 2013; Schlitzer et al., 2013). Due to the central role of cDCs in T cell activation, they have been implicated in the development of T cell-mediated autoimmune, inflammatory and allergic diseases (Steinman and Banchereau, 2007). DC-based therapies to modulate T cell activation have proven efficacious in mouse models of cancer, autoimmunity and transplantation; however, adapting these therapies to the treatment of human disease has not yet fulfilled its promise (Palucka and Banchereau, 2012).
In contrast to mice, human DC research has by necessity focused on moDCs generated ex vivo from culture of peripheral blood CD14+ monocytes with specific cytokines (Sallusto and Lanzavecchia, 1994). The extent to which moDC resemble primary cDCs responsible for T cell activation in tissues is not clear (Osugi et al., 2002; Segura et al., 2013). Human CD141+ and CD1c+ cDCs were originally identified in blood (Dzionek et al., 2000), and have been ontogenetically aligned to mouse cDC1 and cDC2, respectively (Bachem et al., 2010; Crozat et al., 2010; Jongbloed et al., 2010; Poulin et al., 2010). Human DC subsets have been characterized in tissues (Guilliams et al., 2016; Haniffa et al., 2012; Heidkamp et al., 2016; Watchmaker et al., 2014), however, tissues were derived from isolated surgical explants from a small number of individuals at different life stages. The ability to adapt DC therapies to the diverse human population requires a comprehensive analysis of DC populations in multiple tissues at different life stages.
A key paradigm in cDC biology is their capacity to acquire antigens in peripheral tissues, deliver them to draining lymph nodes (LNs), and undergo maturation through upregulation of major histocompatibility (MHC) and co-stimulatory molecules required for T cell activation (Banchereau and Steinman, 1998; Worbs et al., 2016). Peripheral tissue cDC1 and cDC2 in mice both display a capacity to mature and migrate to the draining LNs during homeostasis or inflammation (Hammer and Ma, 2013). Human tissue-migratory cDCs have been described based on phenotype or ex-vivo migration assays in LN samples and skin (Haniffa et al., 2012; Segura et al., 2012); however, little is known about human cDC migration and maturation between peripheral tissues and their draining LNs, due to the difficulty of obtaining these complementary sites for research. Thus, the defining characteristic of human cDCs as tissue sentinels remains poorly understood.
We have established a unique human tissue resource through collaborations with the local organ procurement agency, LiveOnNY, to obtain physiologically healthy lymphoid and mucosal tissues from human organ donors (Sathaliyawala et al., 2013; Thome et al., 2016a; Thome et al., 2014). Our ability to obtain multiple tissues sites from individual donors of all ages has revealed insights into the compartmentalization of T cells, their homeostatic maintenance over life, and genesis and function in tissues during early life (Thome et al., 2016a; Thome et al., 2014). Here, we asked whether tissue compartmentalization of immune responses was controlled at the level of tissue surveillance by DC. We developed a robust phenotyping scheme combining well-established (CD1c, CD141) and tissue-optimized (CD13, CD64) markers, to distinguish cDC subsets in 14 diverse tissues sites, including lung, intestines, mucosal-draining and peripheral LNs, spleen and gut-associated lymphoid tissues (GALT). Our analysis reveals new insights into human DC biology: that cDC subset composition is largely a function of the tissue site; that LNs differ in the extent of DC maturation with lung-draining LN having the highest proportion of mature DC compare to other LN sites, and that the cDC2 subset exhibits predominant maturation phenotypes within LNs compared to cDC1. This localization of DC maturation is largely maintained throughout life, with site-specific variation in subset distribution in early life and an overall increase in maturation throughout many sites in later life. Our findings provide new insights into the dynamic processes underlying adaptive immunity through tissue-specific DC maturation.
RESULTS
Analysis of DC subsets in multiple human tissues
We obtained multiple lymphoid and mucosal tissues from research-consented human organ donors as previously described (Sathaliyawala et al., 2013; Thome et al., 2016a; Thome et al., 2014) for a unique assessment of DC distribution, maturation and migration properties in human tissues. For this study, tissues were acquired from 78 donors of diverse race and ethnicity across ten decades of human life (Figure 1A and Table S1). Tissue sites analyzed included blood and bone marrow (BM), secondary lymphoid organs (spleen and multiple LNs), mucosal sites (lung, jejunum, ileum, colon) and GALT (Peyer’s patches and appendix).
Figure 1. Identification of cDC subsets in diverse human tissue sites.
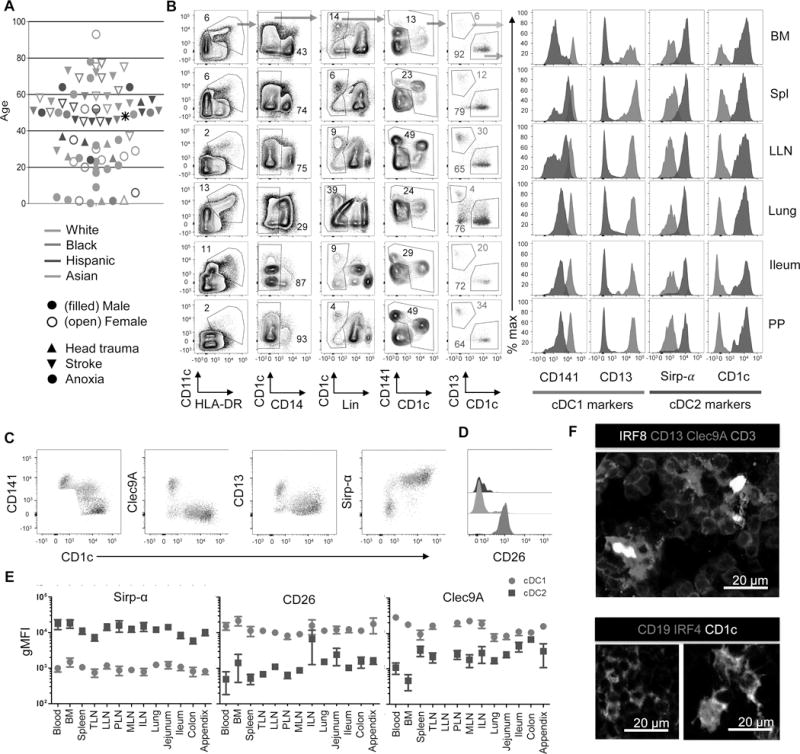
A. Top: Schematic showing the 14 tissue sites obtained for this study. Bld = blood; Spl = spleen; TLN = tracheal LN; LLN = lung LN; PLN = pancreatic LN; ILN = iliac LN; MLN = mesenteric LN; PP = Peyer’s Patches; App = appendix; BM = bone marrow; Col = colon; Ile = ileum; Jej = jejunum, Lng = lung; Bottom: Each of the 78 donors used in this study is designated by an individual symbol with the following characteristics indicated: Gender (filled symbol, male; open symbol, female), race (green, Caucasian/White; red, African American/Black; blue, Hispanic; and orange, Asian), and cause of death (upward triangle, head trauma; downward triangle, stroke; circle, anoxia). Asterisk indicates male donor from which no other information was available. B. Gating strategy for the identification of cDC1 and cDC2 in multiple tissues obtained from human organ donors (left). Cells were initially gated on live (DAPIlo) CD45+ singlets (not shown), then on CD11c+HLA-DR+CD14−, lineage (Lin)-neg (Lin = CD3, CD15, CD19, CD20, CD56.) and CD1c+ or CD141+ to identify cDC populations and further subdivided by CD141+CD13+ and CD1c+ to delineate cDC1 and cDC2, respectively. Right: Expression of key cDC markers CD141, CD13, Sirp-α and CD1c, by cDC1 (red) and cDC2 (blue) subsets. Data derive from Donor 233. C. Plots show expression of different markers (y axis) on cDC1 (red), cDC2 (blue) and CD141+ CD1c+ (tan) cells. D. Histograms show expression of CD26 on the subsets designated in C. E. Compiled Clec9a, CD26 and Sirp-α expression by cDC1 and cDC2 delineated as in (B) expressed as geometric mean fluorescence intensity (gMFI) ±SEM from 7–29 donors for each tissue. F. Fluorescence staining of LLN sections from a single donor showing nuclear IRF8 staining on CD13+Clec9A+ cells displaying a DC morphology in the T cell zone (green) (upper image), and nuclear IRF4 staining by CD1c+ cells with a DC morphology (lower right). Shown in lower left is control staining for CD1c expression on CD19+ B cells (Blue) which lack IRF4 expression. Images are shown at 200X magnification. Scale bar: 20 μm.
To identify and characterize cDC subsets, we combined flow cytometry and fluorescence imaging. For phenotypic characterization of DC subsets, we initially gated on live (DAPI low) Singlet CD45+, CD11c+ HLA-DR+, CD14- and lineage-negative and either CD141+ or CD1c+ cells (Figure 1B), delineating cDC1 and cDC2, respectively. CD13 was reported to exhibit biased expression by cDC1-like cells in mice (Ghosh et al., 2012), and we found it highly expressed on CD141+ but not on CD1c+ cells (Figure 1B), and expressed at intermediate levels on CD14+ cells (Figure S1A and B). Coordinate expression of CD13 with CD141 and CD1c provided a clear segregation of cDC1, which also express Clec9A (Huysamen et al., 2008) and CD26, from cDC2, which were Sirp-α+ (Watchmaker et al., 2014) (Figure 1C and E). Several tissues contained a population of double positive CD141+ CD1c+ cells (Figure 1B) also seen previously (Haniffa et al., 2012), and we show that these cells express markers associated with cDC2 (Figure 1C). The monocyte and macrophage marker CD64 (Tamoutounour et al., 2012) was highly expressed on CD14+ cells, and expressed at much lower levels on cDC2 and cDC1 (Figure S1A–C), further confirming our subset delineation strategy. In fluorescence images, CD13+ Clec9A+ and CD1c+ cells displayed a dendritic cell morphology and expressed the canonical cDC1 and cDC2 transcription factors IRF8 and IRF4 (Aliberti et al., 2003; Bajana et al., 2016), respectively (Figure 1F). Our results thus establish human tissue CD13hiCD141hiClec9A+ cells as cDC1, and CD1c+Sirp-α+ cells as cDC2.
Tissue-specific patterns of DC subset distribution
Using the gating strategies above, we quantitated the frequency (%CD45+ cells) of each DC subset and CD14+ cells in 14 different tissue sites of up to 60 individual donors (Figure 2A). Overall, the frequency of each subset was a function of the tissue site with minimal variation between donors for cDC1, cDC2 and CD14+ monocytes, with broader variation in pDC frequencies between donors (Figure 2A). For cDC1, overall frequencies ranged from <0.01–0.1% of CD45+ cells with the highest relative frequencies in the spleen and LNs, and lower frequencies in mucosal sites, blood and bone marrow (Figure 2A, top). The overall frequencies of cDC2 were significantly higher than cDC1, ranging from <0.1–1% CD45+ cells, with higher frequencies of cDC2 in lung and jejunum compared to other mucosal sites, and greater variation between LNs compared to cDC1 (Figure 2A, second row). The frequency of pDC (gating strategy shown in Figure S1D) ranged from 0.001–0.1% of CD45+ cells, and was highest in LNs, lungs, BM and spleen, and lower in the intestines (Figure 2A, third row). Finally, CD14+ cells (Figure S1A) exhibited the highest overall frequencies of all four subsets, ranging from <1–10% CD45+ cells, with highest frequencies in blood-rich tissues such as lungs and BM. These results provide a frequency distribution map of the key DC and monocyte populations throughout the human body, and reveal subset-specific patterns, with cDC1 evenly distributed between spleen and multiple LNs, and cDC2 varying in frequency between different lymphoid sites.
Figure 2. Tissue distribution of monocytic cells and DC subsets in the human body.

A. Compiled frequencies (mean ± SEM) of cDC1, cDC2, pDCs and CD14+ cells gated as in Figure 1 and S1, expressed as %CD45+ cells, compiled from 10–50 donors for each tissue site. Secondary lymphoid tissues are shaded in purple, mucosal tissues in tan; blood-rich sites are highlighted in grey. B. Compiled pie charts depict the ratios (mean from each site) of DC subsets and monocytes analyzed in 14 different tissues, with the perimeter of the circle denoting each tissue grouping: blood-rich tissues (grey arc), secondary lymphoid tissues (purple arc), and mucosal tissues (tan arc). The proportions of each subset are denoted by different colors: CD14+ monocytes (green), pDCs (orange), and cDCs (dark blue) which are further subdivided into cDC2 (light blue) and cDC1 (red). C. Graphical representation of cDC distribution plotted as cDC1 frequency (%CD45+ cells, y axis) versus cDC2/cDC1 ratio (x axis) for each tissue. Five tissue groupings are delineated by shaded circles into circulatory, lymphoid tissue (subdivided into peripheral lymphoid sites and gut-associated lymphoid tissues (GALT, appendix and Peyer’s Patch), mucosal tissues and lung and lung-draining LN (see text).
To gain insights into associations between different subsets within and between tissue sites, we generated a composite circular diagram (Figure 2B) of the 14 tissues organized into blood-rich (blood, BM, spleen, lungs), secondary lymphoid (spleen, LNs, GALT) and mucosal (intestines, lungs) tissues. Within each tissue, pie charts depict cDC/pDC/monocyte (dark blue/orange/green) and cDC1/cDC2 (red/light blue) ratios. Among the four populations analyzed, CD14+ cells dominated all tissues, particularly in blood-rich sites, while cDC2 was the predominant cDC subset in all sites. Although cDC1 and pDCs are low frequency populations, their frequencies were higher in lymphoid compared to mucosal sites (Figure 2B). To dissect associations between cDC subsets in each tissue, we plotted cDC1 frequency versus cDC2/cDC1 ratio resulting in segregation of the 14 tissues into five distinct groupings (Figure 2C): (i) circulatory, with low cDC1 frequencies and high cDC2/cDC1 ratios; (ii) lymphoid tissues with cDC2/cDC1 ratios averaging 2:1 subdivided into peripheral LN with higher cDC1 frequencies, and (iii) gut-associated lymphoid tissue (GALT) with lower cDC1 frequencies; (iii) peripheral/mucosal tissues with intermediate cDC1 frequencies and cDC2/cDC1 ratios; and (iv) lung and LLN, displaying higher cDC1 frequencies and high cDC2/cDC1 ratios. This analysis highlights the distinct cDC subset composition between mucosal and lymphoid sites, and also between lymphoid sites draining different tissues that is conserved between diverse individuals.
Regional and subset-specific differences in cDC maturation in LNs
We sought to determine if the differences in cDC subset distribution between lymphoid sites corresponded to alterations in DC maturation. Studies in mice and humans have shown that MHC class II expression increases during DC maturation (Banchereau and Steinman, 1998). In human tissues, we found that HLA-DR expression by cDC1 was at the low or intermediate levels in all tissues, with slightly higher levels found in the intestines (Figure 3A). In contrast, HLA-DR expression by cDC2 varied between tissues, with the highest levels found in the LLN and Tracheal LNs (TLN), and elevated levels in pancreatic (P)LN and mesenteric (M)LN compared to iliac (I)LN and mucosal sites (Figure 3A). We further investigated the proportion of immature (MHCIIlo) and mature (MHCIIhi) DC subsets in different LNs, as done with mouse cDCs (Vermaelen et al., 2001), to obtain a “maturation ratio” (mature:immature cDCs) for each site. LN mature cDCs also upregulate key co-stimulatory markers such as CD40, necessary for effective T cell activation, and possess higher side scatter, reflecting an increase in cellular complexity (Figure S2A–B). As shown in a representative donor (Figure 3B), and in compiled data from 52 donors (Figure 3C), human spleens contain largely immature cDCs (low maturation ratio), while LNs have distinct proportions of immature and mature DCs, with TLN and LLN having the highest maturation ratio, followed by MLN, with ILN having the lowest maturation ratio. Together these results demonstrate that human cDC2 display tissue-specific maturation, with lung-draining LNs exhibiting higher cDC maturation than other mucosal and peripheral draining LNs.
Figure 3. Subset and regional differences in cDC maturation in secondary lymphoid organs.
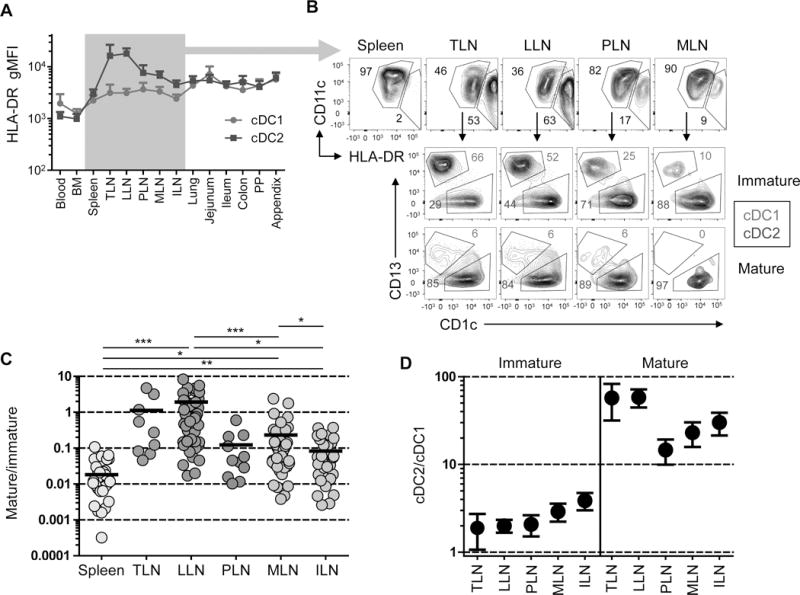
A. HLA-DR expression (gMFI± SEM) on cDC1 and cDC2 from 14 different tissues compiled from 10–30 donors per tissue. B. Top: Differential HLA-DR expression by LN cDCs delineating immature (HLA-DRlo) and mature (HLA-DRhi) populations. Bottom: cDC subset delineation of immature (tan) versus mature (teal blue) populations. Representative data from Donor 223. C. Ratio of mature to immature cDCs in spleen and five different LNs with TLN (tracheal LN); LLN (lung LN); PLN (pancreatic LN); MLN (mesenteric LN), ILN (iliac LN). Significance was determined using paired t tests. D. cDC2/cDC1 ratio of immature versus mature cDCs in LNs shown in (C). *p< 0.05, **p<0.01, ***p<0.001.
We considered whether the increased frequency of mature cDC2 in the LLN compared to other LNs was due to intubation of the donors. We stratified donor results based on whether or not they sustained acute lung injury (ALI) during hospitalization, as the most well-validated clinical parameter assessing lung injury in mechanically ventilated patients (see Materials and Methods). The increased frequency of mature cDC2 in LLN compared to other LNs (MLN, ILN) was observed in donors with and without ALI (Figure S3A, B), indicating that lung damage was not the primary factor associated with biased DC maturation in the LLN. However, cDC2 maturation was slightly increased in the LLN of donors with ALI compared to those without ALI (Figure S3A, B), suggesting that tissue injury may influence the extent of this localized maturation.
cDCs display subset and tissue-specific microanatomical compartmentalization in human LNs
To determine if the tissue and subset specific differences identified above also manifested in distinct cDC microanatomical distribution patterns, we assessed cDC1 and cDC2 localization in human LLN and MLN using fluorescence imaging. Defined regions of the LN, including B cell follicles and T cell zones are discernible in the LLN and MLN of individual donors (Figures 4A and S4). While cDC1 (Clec9A+) were sporadically dispersed in the T cell zones, cDC2 (CD1c+) tended to aggregate near B cell follicles in both LNs (Figure 4A, see boxed region). Interestingly, we observed larger clusters of interfollicular cDC2 in LLN compared to MLN, as shown in representative images of a single donor (Figures 4A and S3) and when quantified in LNs from multiple donors, with some expected heterogeneity (Figure 4B). These results are consistent with our flow cytometry data, showing higher frequency and maturation of cDC2 in the LLN compared to other LNs (Figures 2 and 3).
Figure 4. Differential clustering and density of cDC subsets in lung-draining and mesenteric LNs.
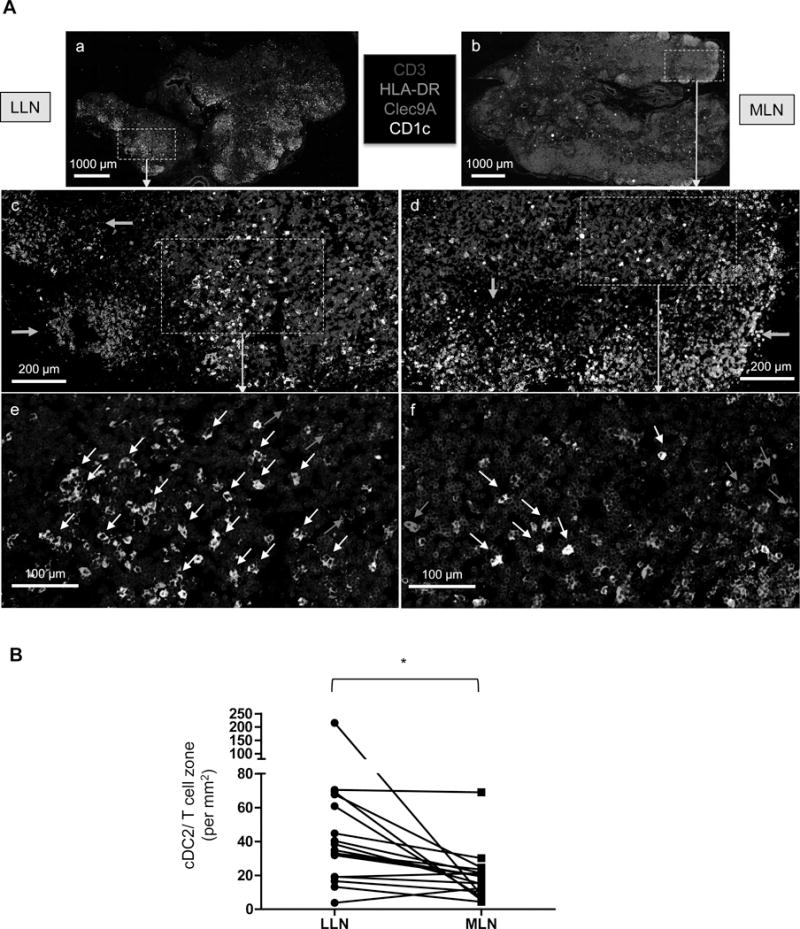
A. Visualization of cDC subsets in human LNs from a single representative donor (Donor 250). Fixed human LLN and MLN were stained for CD3(blue), HLA-DR(green), Clec9A(red) and CD1c(white). Images (a and b) show whole LN at 10X magnification with the boxed regions shown below in images c–f at 20X magnification. Green arrows indicate B cell follicles (c and d); red arrows indicate cDC1 and white arrows indicate cDC2 (e and f). Images are representative of at least five different donors. Scale bars: (a and b) 1000 μm; (c and d) 200 μm; (e and f) 100 μm. B. Quantification of cDC2 density in T cell zones of LLN and MLN obtained from 17 donors calculated by dividing the number of cDC2 (using Imaris software) by the T cell zone area, defined using ImageJ software (see methods). *P<0.05, as calculated by a paired t test.
LN mature cDC display migratory characteristics
A key question regarding LN mature cDCs is whether these cells originate from tissue-maturing cDCs that migrate to the LNs through afferent lymphatics or mature directly in the LNs. In mice, mature LN cDCs were shown to be tissue-derived in several models (Trautwein-Weidner et al., 2015; Vermaelen et al., 2001) and to require CCR7 expression for migration (Ohl et al., 2004). Here, we examined coordinate expression of HLA-DR and CCR7 as markers of maturation and migration, respectively, on cDCs in human mucosal tissues paired with their draining LNs from the same individual. In the lung tissue of two representative donors (Figure 5A, left panels), the majority of cDC1 and cDC2 exhibited an immature (HLA-DRloCCR7lo) phenotype; however, there were significant fractions of HLA-DRhiCCR7+ cells among the cDC2 subset, with much lower frequencies of this phenotype observed on the cDC1 subset. Analysis of the complementary LLN from these same individuals (Figure 5A, right panels) reveals higher frequencies of HLA-DRhiCCR7+ cDCs in the LLN compared to the lung, and among the cDC2 compared to the cDC1 subset in the LLN. Indeed, we found that the overall hierarchy of increased cDC2 maturation in the lung correlated with cDC2 maturation in the LLN, with cDC2 maturation levels in the LLN always higher than in the lung (Figure 5B). Subset ratio analysis further showed that cDC2 maturation in the LLN correlated with reduction in the cDC2/cDC1 ratio in the lung and with an increase in cDC2/cDC1 ratio in the LLN (Figure 5C), suggesting that cDC2 maturation correlates with the accumulation of cDC2 in the LLN, as was seen in the large cDC2 aggregations identified in Figure 4.
Figure 5. LN mature cDCs display characteristics of tissue migratory cells.
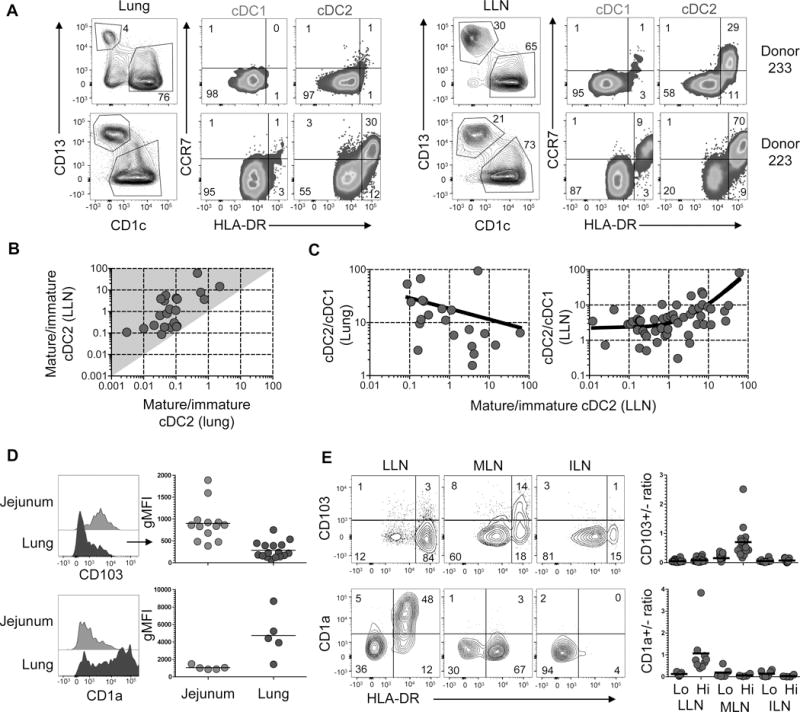
A. HLA-DR and CCR7 expression by lung (left panels) and LLN (right panels) cDC1 and cDC2 of two donors (233 and 223). B. Graph shows the ratio of mature:immature cDC2 in the LLN plotted versus the ratio of mature:immature cDC in the lung compiled from 20 donors. Shaded area (grey) delineates region of greater maturation in the LLN compared to the lung. C. Graphs show ratios of cDC2:cDC1 in the lung (left) and LLN (right) as a function of LLN cDC2 mature:immature ratios compiled from 20 (left) and 53 (right) donors. D. CD103 and CD1a expression by cDC2 in the jejunum (light blue) and lung (dark blue) shown in representative flow cytometry plots (left) and compiled gMFI from 5–16 donors (right). E. CD103 and CD1a expression by HLA-DRlo and HLA-DRhi cDC2 in three different LNs shown in representative flow cytometry plots (left) from individual donors (Donor 215, top; Donor 297, bottom) and compiled results calculating the ratio of CD103+/CD103− (top) or CD1a+/CD1a− (bottom) cDC2 from 4–22 donors (right). Lung sections were taken from the lateral basal region for each donor. *p< 0.05, **p<0.01, ***p<0.001.
As another approach to assess the tissue derivation of LN DCs, we assessed expression of markers previously found to be associated with specific mucosal sites (CD103 for intestines (Jaensson et al., 2008; Watchmaker et al., 2014), and CD1a for lung (Demedts et al., 2005) in the tissue and draining LNs. CD103 was expressed by both cDC1 (Sirp-α−) and cDC2 (Sirp-α+) subsets with the highest level of expression in intestinal sites (particularly in the jejunum) compared to other sites including lungs (Figure S5B, C). Comparing CD103 expression by cDCs between tissues and LNs reveals CD103 upregulation by cDC2 in the intestines but not in the lung (Figure 5D, top), and exclusively by HLA-DRhi mature cDC2 in intestinal draining MLN but not in LLN or ILN (Figure 5E, top). Conversely, CD1a was expressed by lung but not intestinal cDC2 (Figure 5D, bottom), and exclusively by the mature cDC2 fraction in LLN but not MLN or ILN (Figure 5E, bottom). These results provide evidence that cDC2 has specifically migrated from the mucosal site to the draining node in a localized fashion. Together, our findings suggest that LN mature cDC derive, at least in part, from cDC maturing in the tissues and migrating to the draining LN.
cDC subset frequency in tissues is differentially affected by age
Our results reveal a hierarchy of maturation and migratory phenotypes on both the subset and tissue levels, with cDC2 exhibiting higher frequencies of mature and migratory cells, and the LLN containing the highest proportion of mature and migratory cDCs. To investigate whether these subset-and tissue-specific cDC properties are maintained or altered during human life, we analyzed cDC subset frequency in tissues obtained from organ donors aged 3 months to 93 years. By plotting cDC subset frequency as a function of age, we found that overall subset frequencies remained relatively constant throughout life in most tissues. However, the jejunum and appendix contained higher cDC1 frequencies in younger donors (Figure 6A). Comparing frequencies in donors stratified by age groupings into children (age 0–9 years) and adults (age 20+ years) shows that the jejunum of children contained higher cDC1 frequencies but comparable cDC2 and CD14+ cell frequencies compared to adults (Figure 6B and 6C). However, cDC1, cDC2 and CD14+ cell frequencies in the MLN, which drains the intestines, were comparable between children and adults (Figure 6C; individualized cDC2/cDC1 ratios in Figure S6A), indicating that differences in DC content in early life were largely confined to intestinal sites.
Figure 6. cDC subset frequency in tissues over the human lifespan.
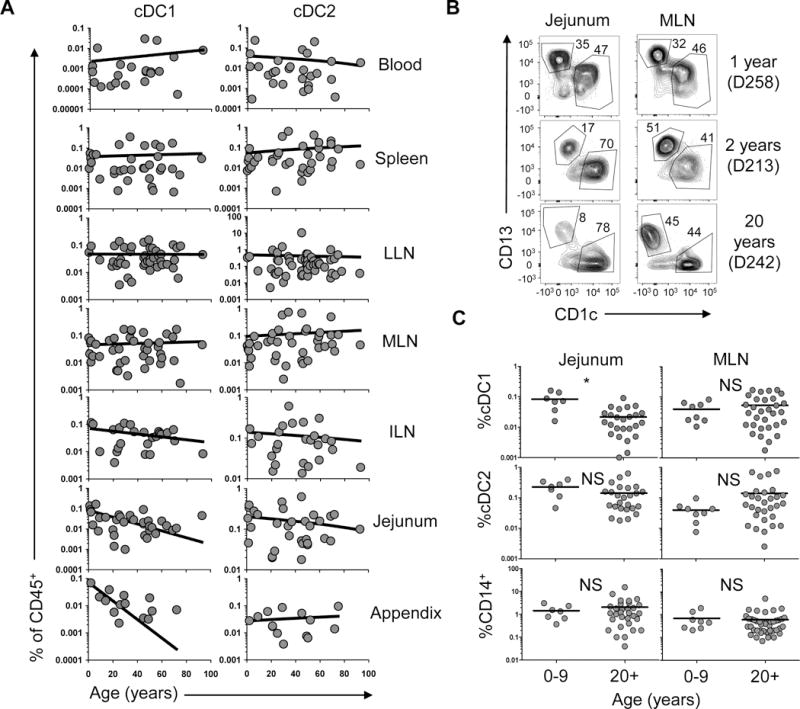
A. Graphs show compiled frequencies of cDC1 (left) and cDC2 (right) subsets (% CD45+ cells) in blood and seven different tissues as a function of age. Line shows linear regression. B. Representative flow cytometry plots showing cDC1 and cDC2 in the jejunum and MLN of two pediatric and one young adult donor as indicated. C. Compiled frequencies of cDC1, cDC2 and CD14+ cells from jejunal and MLN samples of 7–8 children and 25–31 adults.
cDC2 maturation dynamics over human life
We also investigated the effect of aging on cDC maturation, and cDC2 predominance among mature cDCs. Results from individual donors aged 3 months to 93 years show higher frequencies of mature cDCs in the LLN compared to MLN in infants and younger adults, with more comparable frequencies of mature cDCs in LLN and MLN at older ages (Figure 7A, top). This trend of increased maturation in multiple LNs with age is observed in compiled results plotting the maturation ratio in the LLN, MLN and ILN as a function of age (Figure 7A, bottom, Figure S6B). However, the predominant cDC2 representation within the mature DC fraction in different LNs was maintained with age (Figure 7B). Thus, while our data shows an overall stability in DC content over life, small shifts in cDC frequency (Figure 6) and maturation (Figure 7) may indicate subtle alterations in tissue surveillance during the course of human life.
Figure 7. cDC2 maturation dominance emerges at infancy and is retained over life.
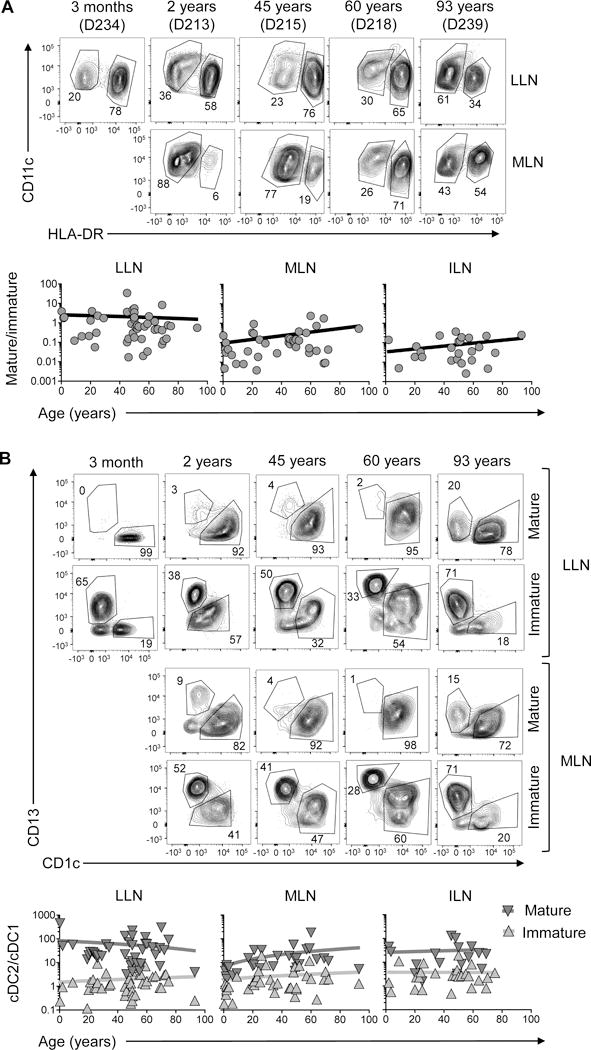
A. Top: representative flow cytometry plots show frequency of mature (HLA-DRhi) and immature (HLA-DRlo) CD11c+ cDCs in LLN and MLN of individual donors from 3 months to 93 years of age. Bottom: Graphs show ratio of mature:immature cDCs in LNs plotted as a function of age with line indicating linear regression. B. Top: representative flow cytometry plots show frequency of cDC1 and cDC2 in the mature and immature cDC fraction in the LLN and MLN of individual donors of indicated ages. Bottom: Ratio of cDC2:cDC1 in the mature and immature compartments of different LNs plotted as a function of age with line indicating linear regression. *p<0.05.
DISCUSSION
Maturation and migration from peripheral tissues to draining LNs constitutes a central paradigm in DC biology, but our understanding of this process derives primarily from animal models. In this study, we analyzed cDC subset distribution, maturation, and localization in up to 14 different tissue sites from 78 organ donors to identify patterns of DC distribution and migration. We combined quantitative analysis of cDC subset composition and maturation in multiple sites within and between individual donors of all ages, to assess human DC tissue surveillance in the body over the human lifespan. Our analyses revealed that cDC subset composition is a function of the specific tissue site, that mature cDCs are localized primarily to LNs with the LLN having the highest frequency of mature DCs, that cDC2 is the predominant subset with maturation and migration properties, and that tissue-specific signatures distinguish lung and intestinal DCs, which can be used to track their migration to draining LNs. These distribution and maturation and migration features of cDC subsets are largely maintained from infancy through old age, with some site-specific variations. Our findings indicate that DC subset composition, maturation, and migration exhibit lifelong adaptation to the tissue site, providing new insights into human DC biology important for the design of DC-targeted therapies.
A key challenge in human DC research is selecting appropriate markers to unambiguously identify DC subsets in different stages of maturation. CD141 – the most widely-used (and often eponymous) cDC1 marker, was originally identified in blood cDC1 (Dzionek et al., 2000) but was subsequently shown to also be expressed on tissue cDC2 and CD14+ cells (McGovern et al., 2014). We identified CD13 as a more reliable tissue cDC1 marker, and by combining CD141, CD13 (cDC1 markers), CD1c, Sirp-α (cDC2 markers), CD14, CD64 (CD14+ cell markers), HLA-DR and CD40 (maturation markers), we were able to accurately identify and characterize both mature and immature tissue DC subsets. Thus, our analysis of multiple tissues from individual donors has enabled us to develop a versatile and reliable human DC panel.
Because many of the human tissues examined here had not been previously studied and analysis of DCs in multiple mucosal and lymphoid tissues from single individuals has not been previously accomplished, it was important to initially “map” the monocytic or DC populations and subsets in each site. We focused our studies on analyzing cDC subset composition; cDCs were present in all sites at a lower frequency than the major CD14+ monocytic subset, but were enriched in lymphoid tissues. While cDC2 were the more frequent cDC subset in human tissues, cDC1 frequencies were enhanced in LNs. Importantly, the consistent findings between diverse donors suggest that cDC subset composition in tissues is a function of the specific tissue site rather than of the individual. The frequencies and ratio of cDC2 and cDC1 further delineated specific tissue groupings into circulatory, lymphoid tissue, GALT, mucosal sites, and lung-and lung-draining LNs which were distinguished by higher cDC2 content than the other sites. These tissue groupings include higher cDC2/cDC1 ratios in mucosal sites that could reflect localized tissue surveillance.
We used multiple overlapping analyses, including cell frequency, subset and maturation ratio, chemokine receptor/integrin expression, cell density and localization, and tissue-to-LN tracking using tissue-specific markers (CD1a and CD103) to investigate patterns of cDC migration. We found phenotypes associated with mature and migratory DCs in peripheral and mucosal-draining LNs, with mature HLA-DRhi cDCs also expressing the migration marker CCR7 (Haniffa et al., 2012; Watchmaker et al., 2014). Comparing five different LNs and spleen, the LLN contained the highest fraction of mature cDCs in the majority of donors compared to the other LNs, including MLN which drains the intestines, with spleen containing few mature cDCs consistent with their lack of afferent lymphatics. Phenotypically mature cDCs have been identified in human lymph nodes (Desch et al., 2016; Haniffa et al., 2012; Segura et al., 2012); however, these previous studies were more limited in the numbers and types of tissues examined and did not include mucosal tissues and their associated draining LNs, as done here. Our results demonstrate tissue localization of DC surveillance in the body, with lung being a more dynamic site of DC maturation and migration compared to intestines.
Using paired analysis of mucosal sites and their associated draining LNs, we were able to compare cDC subset maturation between sites, providing clues into the identity of migratory cDCs. Importantly, we identified a preferential expression of maturation and migration markers by cDC2 compared to cDC1 in tissues which was more clearly delineated in tissue-draining LNs. While these results suggest that cDC2 have distinct functions as mucosal tissue sentinels, we did observe cDC1 with maturation and migratory phenotypes, albeit to a much lower extent compared to cDC2. It is possible that the specialized function of cDC2 suggested by our data is a distinguishing feature of human cDC subsets, as in mice both cDC1 and cDC2 migrate from the lung to the draining LNs in response to respiratory infections (Worbs et al., 2016). However, we cannot rule out that cDC1 also play important roles in tissue surveillance and migration to LNs during active infection or inflammatory conditions not encountered in the samples analyzed here. Moreover, cDC1 could undergo phenotypic changes during their migration that preclude detection by the markers used here. Nevertheless, our findings provide strong evidence for localized surveillance by human cDC2 between mucosal tissues and their associated draining LNs.
Our study on human DCs can be distinguished from previous reports in the scope and number of tissues and individuals examined and the acquisition of physiologically healthy tissues from organ donors, contrasting surgical explants from diseased tissues which are typical sources for immunological studies. Our experimental approach and analyses has been specifically designed to assess how the donor population or donor state may impact our results. In our previous studies on T cell populations in these tissues, we found that variations in subset composition, activation state and function were largely associated with the tissue rather than a specific feature of the donors, including cause of death or hospital length of stay, with some specific variations based on donor age (Thome et al., 2014; Thome et al., 2016b; Thome et al., 2016c). In this study, we found that the LLN was the site for the highest frequency of mature and migratory-phenotype DCs, which could arise due to the higher inflammatory environment of the lung due to constant exposure, or as a result of all donors being intubated. However, the predominance of mature cDC2 in the LLN was not strongly associated with the presence of ALI in the donors, suggesting that the role of cDC2 in mucosal tissue surveillance, maturation and migration may be a feature of the tissue environment.
We show that the tissue distribution of cDC1 and cDC2, the extent of cDC maturation in different LNs, and the higher frequency of mature cDC2 in tissues and LNs are largely maintained throughout life in humans, with some variations at the extreme ends of life. For example, while cDC1 frequency is largely conserved in tissues with age, higher frequencies of cDC1 are found in the jejunum and appendix in infant and pediatric donors. We recently reported that the infant jejunum is a site for localization of early memory T cells and high frequencies of regulatory T cells (Tregs) (Thome et al., 2016a). In mice, cDC1-mediated priming can promote generation of Tregs and oral tolerance (Esterhazy et al., 2016), and it would be interesting to determine if early intestinal DCs in human likewise promote a localized regulatory milieu. Moreover, while increased cDC2 maturation in the LLN compared to the MLN and other peripheral LNs is observed from infancy through old age (contrasting the defective cDC2 maturation observed in neonatal lung cDC2 in mice (Ruckwardt et al., 2014)), we found increased cDC2 maturation in the MLN in older donors, suggesting an increase or broadening of cDC2 surveillance over life. Overall, the maintenance of tissue cDC subset distribution and function throughout life suggests a lifelong division of labor between cDC subsets that is essential to maintain immune health.
The emergence of mucosal vaccination approaches and cancer immunotherapy over the last few years has highlighted the need to better understand human DC biology. We present here a multidimensional study of cDC distribution and function over human life. Our findings reveal tissue specific compartmentalization of adaptive immunity at the level of tissue surveillance by cDCs, and could serve as a framework for harnessing the remarkable sensitivity, responsiveness and migratory potential of human cDCs.
EXPERIMENTAL PROCEDURES
Acquisition of tissue from human organ donors
Human tissues were obtained from deceased organ donors at the time of organ acquisition for clinical transplantation through an approved research protocol and MTA with LiveOnNY, the organ procurement organization for the New York metropolitan area. All donors were free of chronic disease and cancer, were Hepatitis B, C, and HIV-negative. Tissues were collected after the donor organs were flushed with cold preservation solution and clinical procurement process was completed. The study does not qualify as “human subjects” research, as confirmed by the Columbia University IRB as tissue samples were obtained from brain-dead (deceased) individuals. Demographic and clinical data were extracted from summaries prepared by LiveOnNY. Acute Lung Injury (ALI) (now referred to as mild ARDS) was calculated based on DonorNet records and defined using the Berlin criteria (Force et al., 2012): acute lung changes developing over < 1 week, bilateral infiltrates on chest X-ray or CT (at least three lung lobes involved) not explained solely by atelectasis or nodules, hypoxemia defined by PaO2/FiO2 ratio < 300, and absence of left-sided heart failure.
Cell isolation from human lymphoid and non-lymphoid tissues
Tissue samples were maintained in cold saline and brought to the laboratory within 2–4hrs of organ procurement. Intestinal sections were washed several times in cold PBS (Mediatech, Manassas, VA) and dried with paper towels; mucosal tissues were carefully inspected for the presence and removal of LN, then samples were processed using enzymatic and mechanical digestion resulting in high yields of live leukocytes, as described (Sathaliyawala et al., 2013).
Flow Cytometry Analysis
Single cell suspensions obtained as described above were blocked using Human TruStain FcX (Biolegend, San Diego, CA) and then stained with a 14-color antibody panel (see Table S2 for list) for 30 minutes on ice, with DAPI added 3 minutes before washing the samples in 2 ml FACS buffer. Cells were acquired on a 6-laser LSRII analytical flow cytometer (BD Biosciences). Control samples included unstained and single fluorochrome-stained compensation beads (OneComp ebeads, eBioscience, San Diego, CA) for accurate compensation and subsequent data analysis, and fluorescence minus one (FMO) for CCR7, CD103 and CD40 expression on DCs. Flow cytometry data were analyzed using FlowJo software (Treestar, Ashland, OR).
Immunofluorescence imaging
Fresh human LLN and MLN isolated from organ donors were fixed immediately in 1.0% paraformaldehyde and 0.1M L-Lysine (Sigma-Aldrich, St. Louis, MO) add to PBS (pH7.4), incubated in 20% sucrose at 4°C, embedded in tissue-tek OCT compound (Sakura Finetek USA, Inc., Torrance, CA), and stored at −80°C. Thin 5–8 μm-thick sections were cut with Leica CM 1950 cryostat (Leica Microsystems GmbH, Wetzlar, Germany). For staining, sections were permeabilized in PBS containing 0.1% Triton X-100 (Sigma-Aldrich) and 20% blocking reagent Blocking One (Nacalai tesque, Kyoto, Japan), incubated in blocking buffer (PBS + 20% blocking reagent; Blocking One) and incubated with unconjugated primary antibodies followed by fluorochrome-conjugated secondary antibodies in blocking buffer at room temperature and then incubated with fluorochrome-conjugated antibodies at 4°C. See Table S2 for a list of primary antibodies used for imaging. Secondary antibodies were conjugates of Alexa Fluor 555 and Alexa Fluor 647 (1:2000; Thermo Fisher Scientific, Waltham, MA).
Samples were mounted on cover slips with Prolong Diamond Antifade Mountant (Life Technologies, Inc., Gaithersburg, MD). Imaging was performed on a Leica DMI 6000 microscope (Leica Microsystems GmbH) with motorized z focus stage for fully automated image stitching. cDC2 were identified using the “spots” command in Imaris software (Bitplane, Zurich, Switzerland), and nonspecific fluorescence signals were manually removed. The T cell zone area were defined using ImageJ software (National Institutes of Health, Bethesda, MD).
Statistical analysis and data visualization
Descriptive statistics (percent, mean, median, SEM) were calculated for each cell subset and tissue using GraphPad Prism (Graphpad softfware, San Diego, CA). Significant differences in subset frequencies, ratios, gMFI and density were assessed using a paired t test. Correlations were assessed using linear or curved regression lines. For ALI, statistical significance was assessed using a nonparametric Mann-Whitney test.
Supplementary Material
Highlights.
Human cDC1 and cDC2 subset distribution is a function of tissue site
cDC2 exhibit maturation and migration phenotypes in mucosal-draining lymph nodes
Mature cDC2 accumulate in Lymph node interfollicular zones
Localized cDC subset distribution and maturation is largely retained over life
Acknowledgments
This work was supported by NIH grants AI06697 and AI100119 awarded to D.L.F. These studies were performed in the CCTI Flow Cytometry Core funded in part through an S10 Shared Instrumentation Grant, 1S10RR027050 and 5P30DK063608. We wish to thank Dr. Kazuhiro Furuhashi (CCTI) for help with the imaging, and Dr. Bruce Levin for statistical consultation. We wish to gratefully acknowledge the generosity of the donor families and the outstanding efforts of LiveOnNY transplant coordinators and staff for making this study possible.
Footnotes
Publisher's Disclaimer: This is a PDF file of an unedited manuscript that has been accepted for publication. As a service to our customers we are providing this early version of the manuscript. The manuscript will undergo copyediting, typesetting, and review of the resulting proof before it is published in its final citable form. Please note that during the production process errors may be discovered which could affect the content, and all legal disclaimers that apply to the journal pertain.
AUTHOR CONTRIBUTIONS
T.G. designed the experiments, processed tissues, performed flow cytometry, collected the data, and wrote the paper; T.S. designed and performed the tissue imaging experiments, obtained donor tissues, and helped write the paper; D.C., N.M. and J.W. obtained donor tissues; T.C. and D.C. evaluated ALI; J.T., C.L.G., M.M. and B.K. assisted with tissue processing, SHH assisted with flow cytometry analysis; H.L. coordinated the tissue donation and acquisition from adult donors; A.G. coordinated acquisition for pediatric donors; B.R. advised and consulted on all aspects of this work and provided expertise on DC biology; D.L.F planned experiments, coordinated tissue acquisition and data acquisition/analysis, analyzed data, and wrote the paper.
References
- Aliberti J, Schulz O, Pennington DJ, Tsujimura H, Sousa CRE, Ozato K, Sher A. Essential role for ICSBP in the in vivo development of murine CD8 alpha(+) dendritic cells. Blood. 2003;101:305–310. doi: 10.1182/blood-2002-04-1088. [DOI] [PubMed] [Google Scholar]
- Allan RS, Smith CM, Belz GT, van Lint AL, Wakim LM, Heath WR, Carbone FR. Epidermal viral immunity induced by CD8alpha+ dendritic cells but not by Langerhans cells. Science. 2003;301:1925–1928. doi: 10.1126/science.1087576. [DOI] [PubMed] [Google Scholar]
- Bachem A, Guttler S, Hartung E, Ebstein F, Schaefer M, Tannert A, Salama A, Movassaghi K, Opitz C, Mages HW, et al. Superior antigen cross-presentation and XCR1 expression define human CD11c+CD141+ cells as homologues of mouse CD8+ dendritic cells. J Exp Med. 2010;207:1273–1281. doi: 10.1084/jem.20100348. [DOI] [PMC free article] [PubMed] [Google Scholar]
- Bajana S, Turner S, Paul J, Ainsua-Enrich E, Kovats S. IRF4 and IRF8 Act in CD11c(+) Cells To Regulate Terminal Differentiation of Lung Tissue Dendritic Cells. Journal of Immunology. 2016;196:1666–1677. doi: 10.4049/jimmunol.1501870. [DOI] [PMC free article] [PubMed] [Google Scholar]
- Banchereau J, Steinman RM. Dendritic cells and the control of immunity. Nature. 1998;392:245–252. doi: 10.1038/32588. [DOI] [PubMed] [Google Scholar]
- Crozat K, Guiton R, Guilliams M, Henri S, Baranek T, Schwartz-Cornil I, Malissen B, Dalod M. Comparative genomics as a tool to reveal functional equivalences between human and mouse dendritic cell subsets. Immunol Rev. 2010;234:177–198. doi: 10.1111/j.0105-2896.2009.00868.x. [DOI] [PubMed] [Google Scholar]
- Demedts IK, Brusselle GG, Vermaelen KY, Pauwels RA. Identification and characterization of human pulmonary dendritic cells. Am J Respir Cell Mol Biol. 2005;32:177–184. doi: 10.1165/rcmb.2004-0279OC. [DOI] [PubMed] [Google Scholar]
- Desch AN, Gibbings SL, Goyal R, Kolde R, Bednarek J, Bruno T, Slansky JE, Jacobelli J, Mason R, Ito Y, et al. Flow Cytometric Analysis of Mononuclear Phagocytes in Nondiseased Human Lung and Lung-Draining Lymph Nodes. Am J Respir Crit Care Med. 2016;193:614–626. doi: 10.1164/rccm.201507-1376OC. [DOI] [PMC free article] [PubMed] [Google Scholar]
- Dzionek A, Fuchs A, Schmidt P, Cremer S, Zysk M, Miltenyi S, Buck DW, Schmitz J. BDCA-2, BDCA-3, and BDCA-4: three markers for distinct subsets of dendritic cells in human peripheral blood. J Immunol. 2000;165:6037–6046. doi: 10.4049/jimmunol.165.11.6037. [DOI] [PubMed] [Google Scholar]
- Esterhazy D, Loschko J, London M, Jove V, Oliveira TY, Mucida D. Classical dendritic cells are required for dietary antigen-mediated induction of peripheral Treg cells and tolerance. Nat Immunol. 2016;17:545–555. doi: 10.1038/ni.3408. [DOI] [PMC free article] [PubMed] [Google Scholar]
- Force ADT, Ranieri VM, Rubenfeld GD, Thompson BT, Ferguson ND, Caldwell E, Fan E, Camporota L, Slutsky AS. Acute respiratory distress syndrome: the Berlin Definition. JAMA. 2012;307:2526–2533. doi: 10.1001/jama.2012.5669. [DOI] [PubMed] [Google Scholar]
- Ghosh M, McAuliffe B, Subramani J, Basu S, Shapiro LH. CD13 regulates dendritic cell cross-presentation and T cell responses by inhibiting receptor-mediated antigen uptake. J Immunol. 2012;188:5489–5499. doi: 10.4049/jimmunol.1103490. [DOI] [PMC free article] [PubMed] [Google Scholar]
- Guilliams M, Dutertre CA, Scott CL, McGovern N, Sichien D, Chakarov S, Van Gassen S, Chen J, Poidinger M, De Prijck S, et al. Unsupervised High-Dimensional Analysis Aligns Dendritic Cells across Tissues and Species. Immunity. 2016;45:669–684. doi: 10.1016/j.immuni.2016.08.015. [DOI] [PMC free article] [PubMed] [Google Scholar]
- Guilliams M, Ginhoux F, Jakubzick C, Naik SH, Onai N, Schraml BU, Segura E, Tussiwand R, Yona S. Dendritic cells, monocytes and macrophages: a unified nomenclature based on ontogeny. Nat Rev Immunol. 2014;14:571–578. doi: 10.1038/nri3712. [DOI] [PMC free article] [PubMed] [Google Scholar]
- Hammer GE, Ma A. Molecular control of steady-state dendritic cell maturation and immune homeostasis. Annu Rev Immunol. 2013;31:743–791. doi: 10.1146/annurev-immunol-020711-074929. [DOI] [PMC free article] [PubMed] [Google Scholar]
- Haniffa M, Shin A, Bigley V, McGovern N, Teo P, See P, Wasan PS, Wang XN, Malinarich F, Malleret B, et al. Human Tissues Contain CD141(hi) Cross-Presenting Dendritic Cells with Functional Homology to Mouse CD103(+) Nonlymphoid Dendritic Cells. Immunity. 2012;37:60–73. doi: 10.1016/j.immuni.2012.04.012. [DOI] [PMC free article] [PubMed] [Google Scholar]
- Heidkamp GF, Sander J, Lehmann CHK, Heger L, Eissing N, Anna Baranska Lühr JJ, Hoffmann A, Reimer KC, Lux A, et al. Human lymphoid organ dendritic cell identity is predominantly dictated by ontogeny, not tissue microenvironment. Science Immunology. 2016 doi: 10.1126/sciimmunol.aai7677. [DOI] [PubMed] [Google Scholar]
- Hildner K, Edelson BT, Purtha WE, Diamond M, Matsushita H, Kohyama M, Calderon B, Schraml BU, Unanue ER, Diamond MS, et al. Batf3 deficiency reveals a critical role for CD8alpha+ dendritic cells in cytotoxic T cell immunity. Science. 2008;322:1097–1100. doi: 10.1126/science.1164206. [DOI] [PMC free article] [PubMed] [Google Scholar]
- Huysamen C, Willment JA, Dennehy KM, Brown GD. CLEC9A is a novel activation C-type lectin-like receptor expressed on BDCA3(+) dendritic cells and a subset of monocytes. J Biol Chem. 2008;283:16693–16701. doi: 10.1074/jbc.M709923200. [DOI] [PMC free article] [PubMed] [Google Scholar]
- Jaensson E, Uronen-Hansson H, Pabst O, Eksteen B, Tian J, Coombes JL, Berg PL, Davidsson T, Powrie F, Johansson-Lindbom B, et al. Small intestinal CD103(+) dendritic cells display unique functional properties that are conserved between mice and humans. Journal of Experimental Medicine. 2008;205:2139–2149. doi: 10.1084/jem.20080414. [DOI] [PMC free article] [PubMed] [Google Scholar]
- Jongbloed SL, Kassianos AJ, McDonald KJ, Clark GJ, Ju XS, Angel CE, Chen CJJ, Dunbar PR, Wadley RB, Jeet V, et al. Human CD141(+) (BDCA-3)(+) dendritic cells (DCs) represent a unique myeloid DC subset that cross-presents necrotic cell antigens. Journal of Experimental Medicine. 2010;207:1247–1260. doi: 10.1084/jem.20092140. [DOI] [PMC free article] [PubMed] [Google Scholar]
- McGovern N, Schlitzer A, Gunawan M, Jardine L, Shin A, Poyner E, Green K, Dickinson R, Wang XN, Low D, et al. Human dermal CD14(+) cells are a transient population of monocyte-derived macrophages. Immunity. 2014;41:465–477. doi: 10.1016/j.immuni.2014.08.006. [DOI] [PMC free article] [PubMed] [Google Scholar]
- Merad M, Sathe P, Helft J, Miller J, Mortha A. The dendritic cell lineage: ontogeny and function of dendritic cells and their subsets in the steady state and the inflamed setting. Annu Rev Immunol. 2013;31:563–604. doi: 10.1146/annurev-immunol-020711-074950. [DOI] [PMC free article] [PubMed] [Google Scholar]
- Ohl L, Mohaupt M, Czeloth N, Hintzen G, Kiafard Z, Zwirner J, Blankenstein T, Henning G, Forster R. CCR7 governs skin dendritic cell migration under inflammatory and steady-state conditions. Immunity. 2004;21:279–288. doi: 10.1016/j.immuni.2004.06.014. [DOI] [PubMed] [Google Scholar]
- Osugi Y, Vuckovic S, Hart DN. Myeloid blood CD11c(+) dendritic cells and monocyte-derived dendritic cells differ in their ability to stimulate T lymphocytes. Blood. 2002;100:2858–2866. doi: 10.1182/blood.V100.8.2858. [DOI] [PubMed] [Google Scholar]
- Palucka K, Banchereau J. Cancer immunotherapy via dendritic cells. Nat Rev Cancer. 2012;12:265–277. doi: 10.1038/nrc3258. [DOI] [PMC free article] [PubMed] [Google Scholar]
- Plantinga M, Guilliams M, Vanheerswynghels M, Deswarte K, Branco-Madeira F, Toussaint W, Vanhoutte L, Neyt K, Killeen N, Malissen B, et al. Conventional and monocyte-derived CD11b(+) dendritic cells initiate and maintain T helper 2 cell-mediated immunity to house dust mite allergen. Immunity. 2013;38:322–335. doi: 10.1016/j.immuni.2012.10.016. [DOI] [PubMed] [Google Scholar]
- Pooley JL, Heath WR, Shortman K. Cutting edge: intravenous soluble antigen is presented to CD4 T cells by CD8- dendritic cells, but cross-presented to CD8 T cells by CD8+ dendritic cells. J Immunol. 2001;166:5327–5330. doi: 10.4049/jimmunol.166.9.5327. [DOI] [PubMed] [Google Scholar]
- Poulin LF, Salio M, Griessinger E, Anjos-Afonso F, Craciun L, Chen JL, Keller AM, Joffre O, Zelenay S, Nye E, et al. Characterization of human DNGR-1(+) BDCA3(+) leukocytes as putative equivalents of mouse CD8 alpha(+) dendritic cells. Journal of Experimental Medicine. 2010;207:1261–1271. doi: 10.1084/jem.20092618. [DOI] [PMC free article] [PubMed] [Google Scholar]
- Ruckwardt TJ, Malloy AM, Morabito KM, Graham BS. Quantitative and qualitative deficits in neonatal lung-migratory dendritic cells impact the generation of the CD8+ T cell response. Plos Pathog. 2014;10:e1003934. doi: 10.1371/journal.ppat.1003934. [DOI] [PMC free article] [PubMed] [Google Scholar]
- Sallusto F, Lanzavecchia A. Efficient presentation of soluble antigen by cultured human dendritic cells is maintained by granulocyte/macrophage colony-stimulating factor plus interleukin 4 and downregulated by tumor necrosis factor alpha. J Exp Med. 1994;179:1109–1118. doi: 10.1084/jem.179.4.1109. [DOI] [PMC free article] [PubMed] [Google Scholar]
- Sathaliyawala T, Kubota M, Yudanin N, Turner D, Camp P, Thome JJ, Bickham KL, Lerner H, Goldstein M, Sykes M, et al. Distribution and compartmentalization of human circulating and tissue-resident memory T cell subsets. Immunity. 2013;38:187–197. doi: 10.1016/j.immuni.2012.09.020. [DOI] [PMC free article] [PubMed] [Google Scholar]
- Schlitzer A, McGovern N, Teo P, Zelante T, Atarashi K, Low D, Ho AW, See P, Shin A, Wasan PS, et al. IRF4 transcription factor-dependent CD11b+ dendritic cells in human and mouse control mucosal IL-17 cytokine responses. Immunity. 2013;38:970–983. doi: 10.1016/j.immuni.2013.04.011. [DOI] [PMC free article] [PubMed] [Google Scholar]
- Segura E, Touzot M, Bohineust A, Cappuccio A, Chiocchia G, Hosmalin A, Dalod M, Soumelis V, Amigorena S. Human Inflammatory Dendritic Cells Induce Th17 Cell Differentiation. Immunity. 2013;38:336–348. doi: 10.1016/j.immuni.2012.10.018. [DOI] [PubMed] [Google Scholar]
- Segura E, Valladeau-Guilemond J, Donnadieu MH, Sastre-Garau X, Soumelis V, Amigorena S. Characterization of resident and migratory dendritic cells in human lymph nodes. J Exp Med. 2012;209:653–660. doi: 10.1084/jem.20111457. [DOI] [PMC free article] [PubMed] [Google Scholar]
- Steinman RM. Decisions About Dendritic Cells: Past, Present, and Future. Annu Rev Immunol. 2011 doi: 10.1146/annurev-immunol-100311-102839. [DOI] [PubMed] [Google Scholar]
- Steinman RM, Banchereau J. Taking dendritic cells into medicine. Nature. 2007;449:419–426. doi: 10.1038/nature06175. [DOI] [PubMed] [Google Scholar]
- Sung SS, Fu SM, Rose CE, Jr, Gaskin F, Ju ST, Beaty SR. A major lung CD103 (alphaE)-beta7 integrin-positive epithelial dendritic cell population expressing Langerin and tight junction proteins. J Immunol. 2006;176:2161–2172. doi: 10.4049/jimmunol.176.4.2161. [DOI] [PubMed] [Google Scholar]
- Tamoutounour S, Henri S, Lelouard H, de Bovis B, de Haar C, van der Woude CJ, Woltman AM, Reyal Y, Bonnet D, Sichien D, et al. CD64 distinguishes macrophages from dendritic cells in the gut and reveals the Th1-inducing role of mesenteric lymph node macrophages during colitis. Eur J Immunol. 2012;42:3150–3166. doi: 10.1002/eji.201242847. [DOI] [PubMed] [Google Scholar]
- Thome JJ, Bickham KL, Ohmura Y, Kubota M, Matsuoka N, Gordon C, Granot T, Griesemer A, Lerner H, Kato T, et al. Early-life compartmentalization of human T cell differentiation and regulatory function in mucosal and lymphoid tissues. Nat Med. 2016a;22:72–77. doi: 10.1038/nm.4008. [DOI] [PMC free article] [PubMed] [Google Scholar]
- Thome JJ, Yudanin N, Ohmura Y, Kubota M, Grinshpun B, Sathaliyawala T, Kato T, Lerner H, Shen Y, Farber DL. Spatial map of human T cell compartmentalization and maintenance over decades of life. Cell. 2014;159:814–828. doi: 10.1016/j.cell.2014.10.026. [DOI] [PMC free article] [PubMed] [Google Scholar]
- Thome JJC, Bickham KL, Ohmura Y, Kubota M, Matsuoka N, Gordon C, Granot T, Griesemer A, Lerner H, Kato T, et al. Early-life compartmentalization of human T cell differentiation and regulatory function in mucosal and lymphoid tissues. Nature Medicine. 2016b;22:72–+. doi: 10.1038/nm.4008. [DOI] [PMC free article] [PubMed] [Google Scholar]
- Thome JJC, Grinshpun B, Kumar BV, Kubota M, Ohmura Y, Lerner H, Sempowski GD, Shen Y, Farber DL. Long-term maintenance of human naïve T cells through in situ homeostasis in lymphoid tissue sites. Science Immunology. 2016c;1 doi: 10.1126/sciimmunol.aah6506. [DOI] [PMC free article] [PubMed] [Google Scholar]
- Trautwein-Weidner K, Gladiator A, Kirchner FR, Becattini S, Rulicke T, Sallusto F, LibundGut-Landmann S. Antigen-Specific Th17 Cells Are Primed by Distinct and Complementary Dendritic Cell Subsets in Oropharyngeal Candidiasis. Plos Pathog. 2015;11 doi: 10.1371/journal.ppat.1005164. [DOI] [PMC free article] [PubMed] [Google Scholar]
- Vermaelen KY, Carro-Muino I, Lambrecht BN, Pauwels RA. Specific migratory dendritic cells rapidly transport antigen from the airways to the thoracic lymph nodes. J Exp Med. 2001;193:51–60. doi: 10.1084/jem.193.1.51. [DOI] [PMC free article] [PubMed] [Google Scholar]
- Watchmaker PB, Lahl K, Lee M, Baumjohann D, Morton J, Kim SJ, Zeng R, Dent A, Ansel KM, Diamond B, et al. Comparative transcriptional and functional profiling defines conserved programs of intestinal DC differentiation in humans and mice. Nat Immunol. 2014;15:98–108. doi: 10.1038/ni.2768. [DOI] [PMC free article] [PubMed] [Google Scholar]
- Worbs T, Hammerschmidt SI, Forster R. Dendritic cell migration in health and disease. Nat Rev Immunol. 2016 doi: 10.1038/nri.2016.116. [DOI] [PubMed] [Google Scholar]
Associated Data
This section collects any data citations, data availability statements, or supplementary materials included in this article.