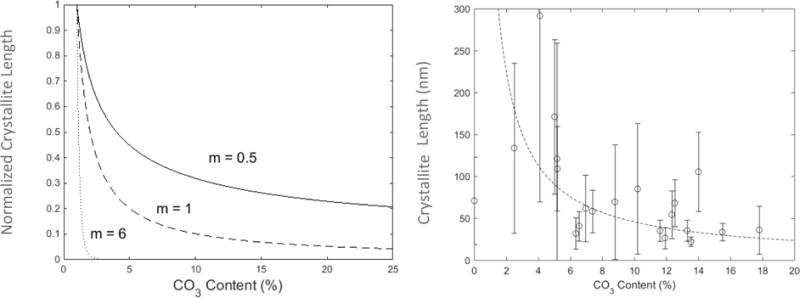
Figure 7.

A) Normalized crystallite length vs. carbonate content as calculated from the modified Weibull analysis. Crystallite length exhibits a rapid decrease at low carbonate levels, which plateaus at higher carbonate levels, where the slope and endpoint of the drop are controlled by the Weibull modulus (m). B) Assuming a starting crystallite length at a CO3 concentration of 0wt% of 400 nm, the calculated variation in crystallite sizes as a function of carbonate content matches well with the experimental data when m=1.
