Figure 5.
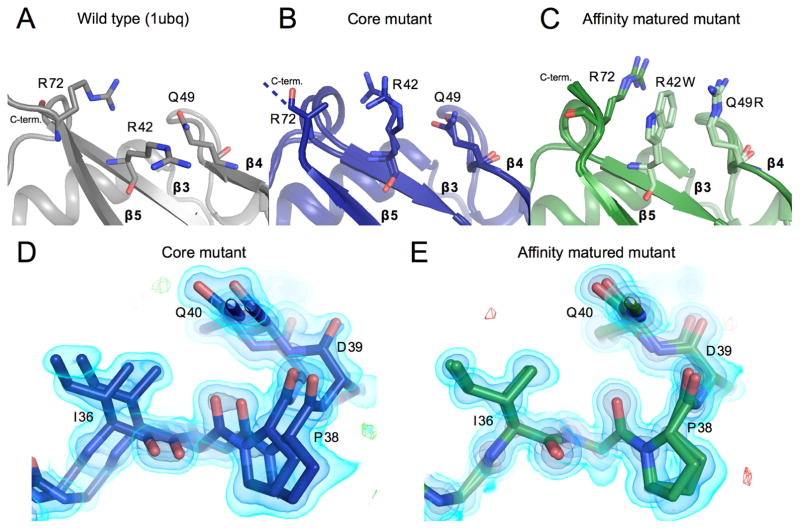
Reduced conformational heterogeneity from core mutant to affinity matured mutant A, B, C) The packing of residues 42, 49, and 72 are shown. Panels and colors show the WT, core and affinity matured mutants in gray, blue and green respectively. Once mutated, residues are shown in a lighter shade of the same color. Residue Arg72 could not be fully built in the core mutant model and thus is truncated at the Cβ. Residues mutated in the affinity matured protein now show new cation-pi interactions, both between residues 72 and 42, and between 42 and 49.
D) Residues 36–39 are shown highlighting heterogeneity in the affinity matured mutant that spans residues 32–41. There is signal for two conformations that differ in this region by a shift of as much as 2.2 Å. 2FoFc map shown as a volume contoured to 3.5, 1.5 and 0.65 eÅ−3 (light blue, blue, black), with the difference FoFc map contoured to 3 eÅ−3.
E) The heterogeneity seen in the core mutant in panel D is not seen for the affinity matured structure at the same residues. Maps are contoured as in D.
See also Figure S4.

