

Abstract
The brain's reward network has been reported to be smaller in alcoholic men compared to nonalcoholic men, but little is known about the volumes of reward regions in alcoholic women. Morphometric analyses were performed on magnetic resonance brain scans of 60 long-term chronic alcoholics (ALC; 30 men) and 60 nonalcoholic controls (NC; 29 men). We derived volumes of total brain, and cortical and subcortical reward-related structures including the dorsolateral prefrontal (DLPFC), orbitofrontal, and cingulate cortices, and the temporal pole, insula, amygdala, hippocampus, nucleus accumbens septi (NAc), and ventral diencephalon (VDC). We examined the relationships of the volumetric findings to drinking history. Analyses revealed a significant gender interaction for the association between alcoholism and total reward network volumes, with ALC men having smaller reward volumes than NC men and ALC women having larger reward volumes than NC women. Analyses of a priori subregions revealed a similar pattern of reward volume differences with significant gender interactions for DLPFC and VDC. Overall, the volume of the cerebral ventricles in ALC participants was negatively associated with duration of abstinence, suggesting decline in atrophy over time.
Keywords: Alcohol, abstinence, MRI, sex, reward network, brain morphometry, drinking history
1. Introduction
Identification of gender differences in association with Alcohol Use Disorder (referred to hereafter as “alcoholism”) has sparked controversy regarding the extent of cerebral and neuropsychological pathology (Lancaster, 1994; Mann et al., 2005; Oscar-Berman and Marinković, 2007; Ruiz and Oscar-Berman, 2013; Pfefferbaum and Sullivan, 2002; Sullivan et al., 2004; U.S. Department of Health and Human Services (USDHHS), 1997), but little research exists to inform this debate. Independent neuropathological processes may distinguish the residual effects of alcoholism on women from those on men, and neuroimaging provides insight into how brain structures are differentially affected with abstinence. Importantly, care should be taken not to confound the long-term neuropsychological sequelae of alcoholism with the responses to acute intoxication, or other health consequences associated with ongoing heavy alcohol consumption. These confounding factors can be mitigated by comparing men and women after long periods of abstinence. The few studies examining the relationship between gender and long-term alcoholism pathology have produced conflicting results, especially in terms of specific effects on the brains of women. Using structural magnetic resonance imaging (MRI), Pfefferbaum and colleagues (Pfefferbaum et al., 2001) found less brain shrinkage among alcoholic women than among alcoholic men. Kroft and colleagues (Kroft et al., 1991) found that the average ventricular volume in alcoholic women was within the typical range found in MRI studies of nonalcoholic women of similar ages. However, Hommer and colleagues (Hommer et al., 1996) found that the corpus callosum was smaller in alcoholic women than in alcoholic men and nonalcoholic control women; alcoholic men did not differ from nonalcoholic control men. Using computerized tomography scans to measure atrophy, Jacobson (Jacobson, 1986) reported that alcoholic women presented with greater ventricular enlargement and widening of cortical sulci than nonalcoholic women, and Mann and colleagues (Mann et al., 2005) found comparable degrees of brain atrophy in men and women despite shorter drinking histories in the women. Therefore, to clarify these conflicting results, we sought to examine how different lengths of abstinence are related to brain morphometry, from relatively short- (four weeks) through long periods (many years).
In other studies, Pfefferbaum and colleagues measured white matter brain microstructure in alcoholic women by using diffusion tensor imaging (DTI) (Pfefferbaum and Sullivan, 2002; Pfefferbaum et al., 2010, 2009). They noted cerebral white matter abnormalities in women alcoholics that were not observed with conventional MRI, suggesting that alcohol use by women is associated with white matter microstructural disruption that may antedate detection with the use of grosser measures of white matter volumetric loss (Pfefferbaum and Sullivan, 2002). They also found that fractional anisotropy changes showed gender differences, being more pronounced in the corpus callosum in men and more pronounced in the centrum semiovale in women (Pfefferbaum and Sullivan, 2002). Additionally, Pfefferbaum and colleagues (Pfefferbaum et al., 2009) reported that, when matched for alcohol exposure, alcoholic women showed more DTI signs of white matter degradation than alcoholic men in several fiber bundles, and that alcoholic women with longer abstinence from alcohol had larger cortical white matter volumes (Pfefferbaum et al., 2002, 2001). However, in a later study, Pfefferbaum et al. did not identify alcoholism-related differences in diffusion measures (Pfefferbaum et al., 2010). Ruiz and colleagues (Ruiz et al., 2013) found widespread white matter degradation in alcoholic women (in frontal, temporal, ventricular, and callosal regions) but only callosal degradation in men; women experienced faster callosal white matter recovery during abstinence. However, another study using magnetic resonance spectroscopy (MRS) to compare alcoholic men and women (Schweinsburg et al., 2003) found that in frontal lobe gray matter, but not frontal lobe white matter, alcoholic women had a significantly greater deficit in concentrations of N-acetylaspartate (a marker for neuronal integrity) than alcoholic men. The MRS findings are consistent with the suggestion by Hommer and colleagues (Hommer, 2003) that gray matter damage distinguishes alcoholic women and men to a greater extent than white matter damage. These discrepant findings necessitate non-directional hypotheses when considering differences between alcoholic men and women not only in total gray matter, white matter, and ventricular volumes, but also in the total “extended reward and oversight system” (Makris et al., 2008) and its component subregions.
Emotional, memory, and motivational abnormalities in Alcohol Use Disorder are associated with changes in the mesocorticolimbic system (Bowirrat and Oscar-Berman, 2005; Oscar-Berman and Bowirrat, 2005), a complex multi-functional network responsive to positive and negative reinforcement. Principal components of the mesocorticolimbic reward circuit include the amygdala, hippocampus, nucleus accumbens septi (NAc; part of the ventral striatum), and ventral diencephalon (VDC; including basal forebrain, hypothalamus, sublenticular extended amygdala, mammillary bodies, and a large portion of the ventral tegmentum area), and cortical areas with modulating and oversight functions, such as the dorsolateral prefronatal cortex (DLPFC), orbitofrontal, temporal pole, subcallosal, and cingulate cortices, parahippocampal gyri, and the insula (Alheid and Heimer, 1988; Barbas, 2000; Fuster, 1997; Heimer and Van Hoesen, 2006; LeDoux et al., 1991, 1988; Ochsner and Gross, 2005; Oscar-Berman and Bowirrat, 2005). Collectively, this cortical/subcortical circuitry is referred to as the extended reward and oversight system (Makris et al., 2008) or the reward network.
The brain's reward system is a critical component of the brain disease model of addiction (Volkow et al., 2016). Moreover, Alcohol Use Disorder has been associated with abnormalities in the reward system, but alcoholic women were not included in the research (Makris et al., 2008). Since there are known differences in the ways in which alcoholism affects men and women (Ruiz and Oscar-Berman, 2013), it is essential to disclose these differences, especially with regard to damage in brain systems involved in addiction. The present study directly addresses that concern, with the hopes of customizing individualized treatment and prevention strategies required by precision medicine. Furthermore, abnormalities in this network not only have implications for clarifying the underlying etiology of addictions such as alcoholism, but also could differentially alter the course of treatment and recovery, by affecting sensitivity to feedback, evaluation of the consequences of one's behavior, and the ability to make economic, social, and health-related decisions.
In alcoholics, mesocorticolimbic reward circuit regions previously studied with MRI have demonstrated structural changes with both atrophy and white matter damage (Agartz et al., 1999; Laakso et al., 2000; Pfefferbaum et al., 2005; Schneider et al., 2001; Sullivan et al., 2000, 1995; Szabo et al., 2004). The affected regions include not only the reward network as an interconnected system in its entirety, but also its specific component subregions (Harris et al., 2008; Makris et al., 2008). However, most studies have included only men.
We previously reported morphometric abnormalities in alcoholic men in the reward network (Harris et al., 2008; Makris et al., 2008). Using MRI in the present study, we analyzed brains of abstinent long-term chronic alcoholic (ALC) men and women and healthy nonalcoholic control (NC) men and women to test the hypothesis that there are gender differences with respect to the relationship of alcoholism to volumetric measures of the reward network. We also explored relationships between volumetric alterations of the reward network and drinking history.
2. Methods
2.1. Subjects
Participants were right-handed (handedness as assessed in (Briggs and Nebes, 1975)) men and women from the Boston area. The study included 60 abstinent long-term chronic alcoholics (ALC; 30 men) and 60 nonalcoholic controls (NC; 29 men) (Table 1). Nine of the ALC men and eight of the NC men were added to the sample of men who had participated in our prior research (Makris et al., 2008). The ALC men and women were selected to have similar drinking history profiles. Participation was solicited from newspaper and web-based advertisements and from Boston University Medical Center, Boston Veterans Affairs (VA) Healthcare System, and VA after-care programs. The Institutional Review Boards of the participating institutions approved this study. Informed consent was obtained prior to neuropsychological testing and scanning. Participants were reimbursed for time and travel expenses. Neurobehavioral and psychiatric evaluations typically required from six to nine hours over two or more days. Participants had frequent breaks as needed.
Table 1.
Neuropsychological and drinking variables of the participants. Mean values are provided with standard deviations (SD). Significant differences are presented in bold text. Abbreviations: ALC = Alcoholic; NC = Nonalcoholic Control; 95% CI = 95% confidence interval of the mean difference between groups.
| ALC Women (N=30) | Men (N=30) | NC Women (N=31) | NC Men (N=29) | NC - ALC | NC Women - ALC Women | NC Men -ALC Men | ALC Women – ALC Men | NC Women – NC Men | ||
|---|---|---|---|---|---|---|---|---|---|---|
|
| ||||||||||
| Mean (SD) | Mean (SD) | Mean (SD) | Mean (SD) | 95% CI | 95% CI | 95% CI | 95% CI | 95% CI | ||
| Demographic and Neuropsychological Measures | Age | 51.6 (9.8) | 51.8 (11.1) | 55.8 (13.8) | 51.9 (12.2) | [-2.0, 6.5] | [-1.9, 10.4] | [-6.0, 6.2] | [-5.6, 5.2] | [-2.8, 10.7] |
| Education | 14.7 (2.5) | 13.9 (2.3) | 16.1 (2.3) | 14.7 (2) | [0.3, 2.0] | [0.2, 2.6] | [-0.3, 1.9] | [-0.4, 2.0] | [0.3, 2.5] | |
| FSIQb | 108 (18.3) | 104.2 (11.4) | 111.3 (14.4) | 109.3 (10.3) | [-0.8, 9.3] | [-5.7, 10.0] | [-0.7, 10.8] | [-4.2, 11.8] | [-4.4, 8.5] | |
| PIQc | 106.6 (18.5) | 100.4 (12.2) | 110.4 (15.3) | 106.9 (11.6) | [-0.1, 10.7] | [-5.0, 12.6] | [0.3, 12.7] | [-2.1, 14.4] | [-3.6, 10.5] | |
| VIQd | 107.9 (17.9) | 106.8 (11.8) | 110.5 (14) | 109.9 (11.4) | [-2.2, 7.9] | [-5.8, 10.9] | [-3.0, 9.1] | [-6.8, 9.1] | [-6.0, 7.3] | |
| WMIe | 105.9 (17) | 106.1 (13.2) | 108 (12.9) | 104.6 (9.9) | [-4.5, 5.3] | [-5.7, 10.0] | [-7.6, 4.6] | [-8.2, 7.8] | [-2.5, 9.4] | |
| Delayed Memoryf | 117.6 (17) | 101 (11.5) | 116.8 (15.1) | 104.3 (13) | [-4.1, 7.6] | [-9.1, 7.6] | [-3.1, 9.8] | [9.0, 24.2] | [5.2, 19.8] | |
| HRSDg | 3.45 (3.77) | 3.97 (4.7) | 1.52 (2.29) | 0.86 (1.15) | [-3.7, -1.3] | [-3.6, -0.3] | [-4.9, -1.3] | [-2.7, 1.7] | [-0.3, 1.6] | |
| MAACL Anxietyh | 48.6 (15.2) | 46.1 (11.1) | 45.6 (14.3) | 43.6 (6.3) | [-7.2, 1.8] | [-10.6, 4.7] | [-7.3, 2.3] | [-4.6, 9.4] | [-3.7, 7.7] | |
| Drinking Measures | Daily Drinks (ounces ethanol per day) | 7.7 (6.8) | 11 (8.3) | 0.2 (0.3) | 0.3 (0.5) | [-11.1, -7.1] | [-10.1, -5.0] | [-13.8, -7.6] | [-7.3, 0.6] | [-0.4, 0.1] |
| Duration of Heavy Drinking (years) | 13 (6.3) | 16.6 (8.3) | 0 (0) | 0 (0) | [-16.7, -12.9] | [-15.4, -10.7] | [-19.6, -13.5] | [-7.3, 0.3] | N/A | |
| Length of Sobriety (years) | 7.3 (9.3) | 5.2 (9.9) | N/A (N/A) | N/A (N/A) | N/A | N/A | N/A | [-2.9, 7.0] | N/A | |
Neuropsychological scores were unavailable for 1 ALC woman, 1 ALC man, and 1 NC woman. The number of daily drinks was not obtained from 1 NC man.
Wechsler Adult Intelligence Scale, Full Scale IQ.
Wechsler Adult Intelligence Scale, Performance IQ.
Wechsler Adult Intelligence Scale, Verbal IQ.
Wechsler Adult Intelligence Scale, Working Memory Index.
Wechsler Memory Scale, Delayed Memory.
Hamilton Rating Scale for Depression.
Multiple Affect Adjective Checklist, Anxiety.
2.2. Clinical Evaluation and Neuropsychological Assessment
Participants underwent a medical history interview and vision testing, plus a series of questionnaires (e.g., handedness, medical history, alcohol and drug use) to ensure they met inclusion criteria. Participants performed a computer assisted, shortened version of the Diagnostic Interview Schedule (Robins et al., 2000) that provides lifetime psychiatric diagnoses according to DSM-IV (American Psychiatric Association, 1994) criteria. Participants were excluded from further participation if any source (DIS scores, hospital records, referrals, or personal interviews) indicated that English was not one of their first languages, or if they had any of the following: corrected visual acuity worse than 20/50 in both eyes; Korsakoff's syndrome; HIV; cirrhosis; major head injury with loss of consciousness greater than 30 minutes unrelated to alcoholism; stroke; epilepsy or seizures unrelated to alcoholism; schizophrenia; Hamilton Rating Scale for Depression (HRSD) (Hamilton, 1960) score over 16; electroconvulsive therapy; history of drug use once per week or more within the past four years (except for one ALC woman who had not smoked marijuana within the past six months, and one ALC man who had not used cocaine within the past eight months).
A number of participants were taking medications for a variety of conditions, had used drugs earlier than four years before enrollment, or had a potentially confounding medical history. Therefore, in analyses of the results, a subgroup of 85 participants (31 ALC; 54 NC) was created consisting of “unconfounded” participants who were not currently taking psychotropic medications, and reported never using illicit drugs more than once a week. Additionally, that subgroup was restricted to individuals for whom no source indicated: hepatitis; an HRSD score over 13; or any of the following disorders: major depressive, bipolar I or II, schizoaffective, schizophreniform, or generalized anxiety. Analyses of the results from the “unconfounded” subgroup of participants were consistent with those as reported in the text for the total sample.
Participants received a structured interview regarding their drinking patterns, including length of sobriety (LOS) and duration of heavy drinking (DHD), i.e., more than 21 drinks per week (one drink: 355 ml beer, 148 ml wine, or 44 ml hard liquor). At-risk drinking is considered to be more than three drinks per week (Cavacuiti, 2011). Additionally, a Quantity Frequency Index (Cahalan et al., 1969) which factors the amount, type, and frequency of alcohol usage (roughly corresponding to number of daily drinks, DD) over the last six months (for the NC participants), or over the six months preceding cessation of drinking (for the ALC participants), was calculated for each participant. Subjects also were asked about family history of alcoholism (see Supplemental Table 1). The ALC participants met DSM-IV criteria for alcohol abuse or dependence and drank heavily for a period of at least five years in their lives; they had abstained from alcohol for at least four weeks prior to testing (range of abstinence: four weeks to 38 years), except for one ALC woman and two ALC men with shorter sobriety periods and who were excluded from the unconfounded subgroup. Length of sobriety was ascertained with several comprehensive interviews over multiple testing sessions, in which the date of last drink was obtained and examined for consistency across sessions. Alcoholic men and women did not differ by DD, DHD, or LOS.
Tests of intelligence, memory, and affect were administered, including the Wechsler Adult Intelligence Scale, Third Edition (WAIS-III) (Wechsler, 1997a) for Full-Scale IQ (FSIQ), Verbal IQ (VIQ), Performance IQ (PIQ), and Working Memory Index (WMI); the Wechsler Memory Scale, Third Edition (WMS-III) (Wechsler, 1997b) for Delayed Memory; the HRSD (Hamilton, 1960) for depression; and the Multiple Affect Adjective Check List (MAACL) (Zuckerman and Lubin, 1965) for anxiety.
2.3. MRI acquisition
MRI scans were obtained on a Siemens 3-Tesla TIM Trio scanner with an 8-channel head coil (Siemens Medical Solutions USA, Inc., Malvern, Pennsylvania). Image acquisitions included sagittal scout and two T1-weighted MP-RAGE series for volumetric analysis: TR=2530ms, TE=3.39ms, TI=1100ms, flip-angle=7°, Field-of-View=256, slice-thickness=1.33mm, number-of-slices=128 contiguous, sagittal images of the entire brain, matrix=256×256, number-of-excitations=2. The two MP-RAGE series were averaged, then the averaged series was re-sliced in a standard coronal three-dimensional brain coordinate system (Kennedy et al., 1989). Images were re-formatted to standard spatial orientation, but not rescaled in size.
2.4. MRI morphometric analyses
Image analyses followed semi-automated procedures (Caviness et al., 1996a; Filipek et al., 1994; Makris et al., 1999). Images were inspected for gross abnormalities, and cortical gray matter, white matter, subcortical structures, and ventricles were manually segmented on T1-weighted images using a computer-assisted approach (Filipek et al., 1994). Neocortex was subdivided further into parcellation units, involving a number of manual and computer-assisted operations (Caviness et al., 1996b). Cortical subregions of the reward network were derived: DLPFC (defined as the sum of the dorsolateral superior-frontal and middle-frontal gyri, approximating Brodmann areas 8, 9, and 46), insular, subcallosal, orbitofrontal, and cingulate cortices, parahippocampal gyrus, and temporal pole. Gray matter subcortical structures in the reward network included NAc, amygdala, hippocampus, and VDC. For volumetric comparisons to reward network regions, we included analyses of sensory cortex (cuneus) and subcortical (dorsal striatum) regions.
Segmentation and cortical parcellation were supervised by our neuroanatomist (NM). Blindness to group assignment was maintained during analyses. High inter-rater and intra-rater reliability of these methods have been established (Caviness et al., 1996b; De Fossé et al., 2004; Frazier et al., 2005; Goldstein et al., 2001, 1999; Herbert et al., 2003; Makris et al., 2004; Seidman et al., 1999). Estimated total intracranial volume was obtained using FreeSurfer 5.3, an automated procedure (Fischl, 2004; Fischl et al., 2002).
A primary purpose of our study was to determine sex differences in the brain's reward system in individuals with Alcohol Use Disorder. We chose to use a semi-automated observer-assisted method to measure the reward volume and its components, rather than more automated techniques, for two primary reasons. Firstly, we have previously published a comparison between the method used in the current project and the automated Freesurfer method (Oscar-Berman and Song, 2011), in which we identified the trade-offs for each approach. Specifically, the advantages of using fully automated methods such as FreeSurfer are speed and low cost, and thus may be preferable for some studies. In fact, we did use FreeSurfer in the present study for measuring estimated total intracranial volume. However, automated measures are more prone to coregistration problems, atlasing misalignment, and other artifacts (Devlin and Poldrack, 2007), and are not as accurate, particularly for measuring the small regions in the reward system. By comparison, the method used in the present study is the gold standard for neuroanatomic accuracy, and ensures precision and reliability in measuring regional brain networks (Caviness et al., 1996b; Makris et al., 2004). Secondly, since we had previously observed and reported abnormalities in the reward system of men with Alcohol Use Disorder (Makris et al., 2008), we wanted to use the same semi-automated MRI methods as in that prior report, to ensure consistency across studies.
2.5. Statistical analyses
Statistical analyses were performed using JMP Pro software (version 11, SAS Institute, Inc., Cary, NC). We applied a multi-level data analysis approach. First, global volumetric brain measures (cm3) were assessed to determine if there were alcoholism-related or gender-related differences in brain, cerebrum, cortical gray matter, cerebral white matter, or ventricular volumes. Second, we assessed the reward network as a whole (sum of all reward network regions) to determine whether the entire reward network specifically was affected in alcoholism. Third, we analyzed the individual component regions previously identified to be important in addiction and reward (see Figure 1). Because each region has been independently established in the literature as an area of interest, and because we limited the analyses to a small set of hypothesis-driven regions, each analysis was considered a separate research question, mitigating the need for multiple comparison correction (Veazie, 2006; but see Frane, 2015). To reduce the number of comparisons, and thus Type I errors, the left and right hemispheric volumes were summed.
Figure 1.
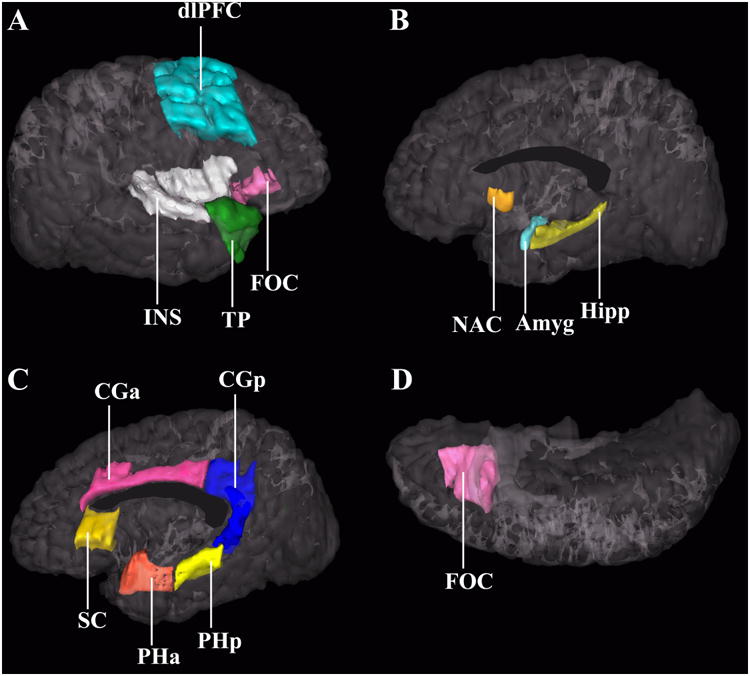
Three-dimensional representation of the cortical and subcortical structures of the brain's reward system. Image A shows a lateral view of the right hemisphere. Images B and C show a medial view of the right hemisphere; image D is an inferior view. Each region has been justified as an independent a priori analysis in previous literature that indicates involvement in alcoholism and addiction: Amyg – amygdala (32; 35; 68), CGa – anterior cingulate cortex (66; 69; 70), CGp – posterior cingulate cortex (71; 72), DLPFC – dorsolateral prefrontal cortex (35; 66; 69), FOC – orbitofrontal cortex (73–75), Hipp – hippocampus (29; 30), INS – insula (35; 66; 69; 70), NAc – nucleus accumbens septi (35), PHa – anterior parahippocampal gyrus (76), PHp – posterior parahippocampal gyrus (77), SC – subcallosal cortex (78), TP – temporal pole (79), VDC – ventral diencephalon (not shown; composed of the basal forebrain, hypothalamus, sublenticular extended amygdala, mammillary bodies, and a large portion of the ventral tegmentum area) (80). Modified from Makris et al. (2008), with permission.
In order to identify brain regions disproportionately affected by alcoholism exceeding generalized effects on the cerebrum, we normalized the total reward region, component reward subregions, and comparison regions by determining percentages of each region relative to total cerebral volume for each subject. Of note, we also computed analogous regional volumes as a percentage of intracranial volume (Supplemental Tables 2 and 5) in order to measure the subregions relative to cranial size, and also report the raw regional volumes (Supplemental Table 3). The results of the raw volume analyses were similar to analyses of proportional volumes, with the expected exception that men have larger heads (and brains) than women. We applied linear regression analyses (covaried for age) to assess the relationships between global and reward subregion volumes as predicted by age, alcoholism, gender, and the alcoholism by gender interaction. Then, among alcoholics alone, models were constructed for each region, as predicted by age, gender, drinking history (i.e., DHD, DD, or LOS), and the interaction of each drinking history measure with gender. Based upon a discrepancy in the literature regarding gender differences in relation to alcoholism-related brain abnormalities, non-directional statistical procedures (i.e., two-tailed tests) were necessary when examining the brain volumes of interest. In all significant statistical analyses, the data from participants were removed if Cook's D (Cook, 1977) exceeded 1, to account for participants with disproportionate influence. This procedure resulted in the removal of one ALC woman for the relationship of LOS to ventricular volume. Direct comparisons within subgroups according to gender (men vs. women) and group (ALC vs. NC) were conducted to shed light on the results of significant interactions. Likewise, analyses of drinking variables are reported within the gender subgroups.
3. Results
3.1. Subjects
Table 1 provides information about the participants. The regression models examining interactions between group (NC vs. ALC) and gender (men vs. women) were not significant for any of the demographic, drinking, or neuropsychological variables. With the exception of drinking variables, education, and HRSD scores, the NC and ALC groups did not differ. The average level of education for ALC participants was 1.1 years lower (t(117.8) = 2.67, p < 0.01), and the average HRSD scores were 2.5 points higher in ALC participants (t(79.1) = 4.16, p < 0.001). The significant results revealed by the main morphometric analyses remained significant after covarying for education and HRSD.
3.2. Morphometric analyses
Table 2A shows that there were no significant main effects of alcoholism on the six global volumetric measures, nor were any of the alcoholism by gender interactions significant. Table 2B and Figure 2 show that there was a significant alcoholism by gender interaction for total reward network volumes as a proportion of total cerebral volume (F(1,119) = 8.73, p < 0.01). The ALC men had 4.1% smaller reward region volumes than the NC men, while the ALC women had 4.4% larger reward region volumes than the NC women (although the comparison between the women subgroups was not significant). In terms of reward subregions, there was a similar significant alcoholism by gender interaction for the DLPFC (F(1,119) = 9.46, p < 0.01). The ALC men had 9.0% smaller DLPFC volumes than the NC men, while the ALC women had 13.6% larger DLPFC volumes than the NC women (although the comparison between the subgroups of men was not significant). There was also a significant alcoholism by gender interaction for the VDC (F(1,119) = 5.83, p < 0.05). The ALC men had 4.7% smaller VDC volumes than the NC men, while the ALC women had 5.1% larger VDC volumes than the NC women; here, neither comparison was significant by itself. No other reward subregion volumes exhibited significant alcoholism by gender interaction effects, and there were no significant main effects of alcoholism on subregions. As expected for the comparison region (dorsal striatum and cuneus), there were no significant alcoholism by gender interactions or significant main effects of alcoholism on volumes.
Table 2.
Morphometric analyses. Table 2A shows values for the six global volumetric regions (cm3). Table 2B shows values for the total reward system volume, the 13 a priori subregions, and two comparison regions (percentage of cerebrum). Mean values are provided with standard deviations (SD). Significant differences (p < 0.05) are presented in bold text. Abbreviations: ALC = Alcoholic; NC = Nonalcoholic Control; 95% CI = 95% confidence interval of the mean difference between groups, expressed as the percentage of the mean volume for each of the regions.
| ALC Women (N=30) | ALC Men (N=30) | NC Women (N=31) | NC Men (N=29) | ALC - NC | ALC Men - NC Men | ALC Women - NC Women | ALC Women - ALC Men | NC Women - NC Men | ||||||
|---|---|---|---|---|---|---|---|---|---|---|---|---|---|---|
|
| ||||||||||||||
| Mean | (SD) | Mean | (SD) | Mean | (SD) | Mean | (SD) | 95% CI | 95% CI | 95% CI | 95% CI | 95% CI | ||
| 2A. | Global Regions (cm3) | |||||||||||||
| Estimated Total Intracranial Volume | 1,445. 87 | (144.2 8) | 1,601. 03 | (127.8 9) | 1,376. 18 | (118.1 8) | 1,565. 87 | (146.3 3) | [-1%, 7%] | [-2%, 6%] | [0%, 9%] | [-15%, -6%] | [-16%, -7%] | |
| Total Brain | 1,233. 57 | (129.4 6) | 1,327. 11 | (106.5 4) | 1,176. 31 | (116.2 4) | 1,302. 51 | (142.6 2) | [-1%, 7%] | [-3%, 6%] | [-1%, 9%] | [-12%, -3%] | [-14%, -4%] | |
| Total Cerebrum | 1,073. 19 | (120.2 3) | 1,163. 87 | (94.24) | 1,025. 51 | (103.6 3) | 1,138. 77 | (122.8 6) | [-1%, 7%] | [-2%, 7%] | [-2%, 9%] | [-13%, -3%] | [-14%, -4%] | |
| Total Cerebral Cortex | 579.71 | (66.38) | 607.07 | (61.32) | 550.02 | (56.66) | 599.67 | (64.44) | [-1%, 7%] | [-4%, 6%] | [-1%, 11%] | [-10%, 1%] | [-13%, -2%] | |
| Total Cerebral White Matter | 421.58 | (54.78) | 479.72 | (58.72) | 409.88 | (61.82) | 462.68 | (67.46) | [-3%, 8%] | [-3%, 10%] | [-6%, 9%] | [-19%, -6%] | [-17%, -3%] | |
| Total Ventricular System | 24.89 | (20.03) | 27.58 | (10.21) | 20.80 | (7.80) | 26.79 | (14.70) | [-5%, 33%] | [-19%, 25%] | [-6%, 59%] | [-39%, 20%] | [-55%, -9%] | |
| 2B | Reward Regions (percentage of cerebrum) | |||||||||||||
| Total Rewarda | 12.72 | (1.01) | 11.70 | (0.98) | 12.17 | (1.11) | 12.19 | (0.58) | [-3%, 3%] | [-8%, -1%] | [0%, 9%] | [4%, 13%] | [-4%, 4%] | |
| Dorsolateral Prefrontal Cortexa | 3.68 | (0.74) | 3.24 | (0.70) | 3.21 | (0.74) | 3.54 | (0.47) | [-5%, 10%] | [-18%, 0%] | [2%, 25%] | [2%, 23%] | [-20%, 0%] | |
| Insula | 1.28 | (0.11) | 1.21 | (0.12) | 1.29 | (0.15) | 1.25 | (0.07) | [-5%, 2%] | [-7%, 1%] | [-5%, 5%] | [0%, 10%] | [-2%, 7%] | |
| Subcallosal Cortex | 0.37 | (0.05) | 0.39 | (0.07) | 0.39 | (0.07) | 0.40 | (0.06) | [-11%, 1%] | [-11%, 6%] | [-16%, 1%] | [-15%, 1%] | [-10%, 7%] | |
| Orbitofrontal Cortex | 0.89 | (0.17) | 0.87 | (0.17) | 0.89 | (0.22) | 0.92 | (0.13) | [-11%, 4%] | [-15%, 3%] | [-13%, 10%] | [-8%, 12%] | [-13%, 7%] | |
| Anterior Cingulate Cortex | 1.06 | (0.20) | 1.05 | (0.22) | 1.13 | (0.18) | 1.04 | (0.23) | [-9%, 5%] | [-10%, 12%] | [-15%, 3%] | [-9%, 12%] | [-3%, 16%] | |
| Posterior Cingulate Cortex | 0.92 | (0.12) | 0.96 | (0.17) | 0.97 | (0.11) | 0.96 | (0.15) | [-8%, 2%] | [-9%, 9%] | [-12%, 1%] | [-13%, 3%] | [-7%, 8%] | |
| Anterior Parahippocampal Gyrus | 0.50 | (0.10) | 0.47 | (0.10) | 0.49 | (0.09) | 0.48 | (0.09) | [-5%, 8%] | [-12%, 8%] | [-3%, 15%] | [-4%, 16%] | [-9%, 9%] | |
| Posterior Parahippocampal Gyrus | 0.29 | (0.06) | 0.24 | (0.05) | 0.28 | (0.06) | 0.25 | (0.05) | [-7%, 9%] | [-13%, 9%] | [-8%, 15%] | [6%, 28%] | [0%, 23%] | |
| Temporal Pole | 1.84 | (0.25) | 1.48 | (0.20) | 1.68 | (0.28) | 1.48 | (0.22) | [-2%, 10%] | [-7%, 7%] | [0%, 16%] | [14%, 28%] | [5%, 22%] | |
| Nucleus Accumbens Septi | 0.10 | (0.02) | 0.09 | (0.02) | 0.10 | (0.02) | 0.10 | (0.02) | [-8%, 5%] | [-14%, 6%] | [-8%, 11%] | [-5%, 16%] | [-9%, 10%] | |
| Amygdala | 0.27 | (0.03) | 0.26 | (0.04) | 0.27 | (0.04) | 0.27 | (0.05) | [-8%, 4%] | [-16%, 4%] | [-5%, 10%] | [-1%, 14%] | [-12%, 7%] | |
| Hippocampus | 0.66 | (0.07) | 0.62 | (0.06) | 0.65 | (0.06) | 0.64 | (0.07) | [-5%, 3%] | [-9%, 2%] | [-4%, 6%] | [1%, 12%] | [-4%, 7%] | |
| Ventral Diencephalona | 0.87 | (0.09) | 0.80 | (0.09) | 0.82 | (0.09) | 0.84 | (0.10) | [-4%, 4%] | [-11%, 1%] | [0%, 11%] | [2%, 13%] | [-8%, 4%] | |
| Cuneus | 0.98 | (0.20) | 1.03 | (0.26) | 1.08 | (0.21) | 1.03 | (0.20) | [-13%, 3%] | [-12%, 12%] | [-21%, 0%] | [-17%, 6%] | [-6%, 14%] | |
| Dorsal Striatum | 1.68 | (0.16) | 1.69 | (0.17) | 1.72 | (0.16) | 1.73 | (0.15) | [-6%, 0%] | [-7%, 2%] | [-8%, 2%] | [-6%, 3%] | [-5%, 5%] | |
Interaction significant for alcoholism by gender (p < 0.05).
Figure 2.

Reward volumes in alcoholic and nonalcoholic men and women. Lower alcoholism-related reward network volumes were observed for men, but increases were observed for women. Boxplot whiskers represent the most extreme values within double the interquartile range, and the middle band represents the median. There was one outlier, indicated by the red dot, and results did not change when that value was removed. Stars indicate significant differences (p < 0.05).
3.3. Imaging measures in relation to drinking variables
The relationships between drinking variables (DD, DHD, and LOS) and brain volumes were examined in ALC men and women. Significant results can be found in Figure 3 and in Table 3, which provides 95% confidence intervals and partial r2 for each region. Supplemental Table 4 expands upon Table 3.
Figure 3.

Brain volumes in relation to drinking variables. Brain volumes were significantly associated with daily drinks, duration of heavy drinking, and length of sobriety. These leverage plots (81) represent the relationships between the specified drinking history variables and regional brain volumes, covaried for age. For the anterior cingulate cortex and the temporal pole, the gender interactions were significant (p < 0.05), so the relationships were calculated separately for ALC men and ALC women, and the plots for men and women were overlaid. Red circles indicate ALC women; blue triangles indicate ALC men. Regression lines and 95% confidence curves of the slopes (dotted lines) are displayed.
Table 3.
Significant relationships among volumes and drinking variables. Values for total cerebrum, total cerebral cortex, and the total ventricular system were calculated using raw volumes (cm3). Values for the remaining regions were analyzed as a percentage of cerebrum volume. The 95% confidence interval (CI) of the slope is expressed as the percentage of the mean volume for each of the regions. Partial r2 was calculated with the formula: SSterm/(SSterm + SSerror). See Supplemental Table 4 for all analyses.
| All ALC (N=60) | ALC Women (N=30) | ALC Men (N=30) | |||||
|---|---|---|---|---|---|---|---|
|
| |||||||
| 95% CI | Partial r2 | 95% CI | Partial r2 | 95% CI | Partial r2 | ||
| Daily Drinks (percent / ounces ethanol per day) | |||||||
| Total Cerebrum | [0.0, 0.7] | 0.07 | [-0.1, 1.2] | 0.11 | [-0.4, 0.4] | 0.00 | |
| Total Cerebral Cortex | [0.0, 0.7] | 0.07 | [-0.1, 1.1] | 0.10 | [-0.4, 0.6] | 0.01 | |
| Anterior Cingulate Cortexa | [-0.8, 0.6] | 0.00 | [-1.9, 0.0] | 0.12 | [-0.3, 1.7] | 0.07 | |
| Hippocampus | [-0.8, -0.1] | 0.09 | [-1.0, 0.2] | 0.07 | [-0.7, 0.2] | 0.03 | |
| Duration of Heavy Drinking (percent/year) | |||||||
| Temporal Polea | [-1.1, 0.1] | 0.04 | [-0.1, 1.6] | 0.11 | [-1.4, -0.3] | 0.26 | |
| Length of Sobriety (percent/year) | |||||||
| Total Ventricular Systemb | [-3.4, -0.1] | 0.08 | [-2.7, 4.4] | 0.01 | [-3.4, -0.2] | 0.17 | |
Interaction significant for drinking variable by gender (p < 0.05).
Data from one woman exerted disproportionate influence (Cook's D > 1.0), and therefore was removed from the analysis.
3.3.1 Daily Drinks
Table 3a shows that there were significant main effects of DD on total cerebrum volume, which was 0.36% higher per daily drink, and cerebral cortex volume, which was 0.38% higher per daily drink. These effects were consistent with those observed for the alcoholic women (partial r2 values for women were 0.11 and 0.10 respectively, whereas r2 for men were 0.00 and 0.01 respectively). There also was a significant interaction between the effect of DD and gender on anterior cingulate cortex volume, with women exhibiting 0.93% lower volumes per daily drink, and men exhibiting 0.71% higher volumes per daily drink. For the alcoholic group, the volume of the hippocampus was 0.40% lower per daily drink. No other main effects of alcoholism or interactions were significant.
3.3.2 Duration of Heavy Drinking
Table 3b shows that there was a significant interaction between the effect of DHD and gender (F(1,119) = 9.60, p < 0.01) on temporal pole volumes, with men exhibiting 0.84% lower volumes per year of heavy drinking, and women exhibiting 0.74% higher volumes per year of heavy drinking. No main effects of DHD or other interactions were significant.
Length of Sobriety
Table 3 shows that there was a significant main effect of LOS on total ventricular volume, which was 1.8% lower per year of sobriety, suggesting that atrophy declines with increasing duration of sobriety. No other main effects of LOS and no interactions were significant.
4. Discussion
4.1. Findings
We investigated alcoholism-associated volumetric abnormalities disproportionately affecting the reward network, a cortical/subcortical circuit associated with reinforcement, punishment, and oversight of complex behaviors, including initiation and relapse of substance abuse (Makris et al., 2008). The results of the present study confirmed the findings of Makris et al. (2008) showing a smaller volume of the total reward system in ALC men than NC men. Although Makris et al. (2008) reported that four component regions (DLPFC, insula, amygdala, and NAc) of the reward system were significantly smaller in ALC men than NC men, we observed similar, but not statistically significant, magnitudes of difference in the same regions.
In any case, the primary aim of the present study was the identification of gender differences in association with Alcohol Use Disorder and brain reward volumes. We observed significant gender by alcoholism interactions for total reward network volumes, as well as DLPFC and VDC subregions. Importantly, our findings are particularly pertinent when considered within a larger body of research that considers gender and drinking history. We found dimorphic abnormalities in ALC men and women: Whereas the observed cerebral volume measures were smaller in ALC men compared to NC men, they were larger in ALC women compared to NC women. The DLPFC has rich connections with many reward regions (Heimer and Van Hoesen, 2006; LaBar and Cabeza, 2006; Schmahmann and Pandya, 2006), and its oversight of limbic-paralimbic centers such as the VDC within the reward circuitry is crucial for normal cognitive and emotional functioning (Barbas, 2000; Petrides and Pandya, 2002; Schmahmann and Pandya, 2006). Structural abnormalities in DLPFC and VDC associated with alcoholism would naturally disrupt the reward processing stream and disorganize these integrative functions. Our comparisons of imaging and drinking variables echoed this gender dimorphic effect. That is, the temporal pole volume and duration of heavy drinking had an alcoholism by gender interaction with a negative relationship in alcoholic men, but a positive relationship in alcoholic women. There also was a suggestion that global measures of cerebrum and cerebral cortex volumes were increased in relation to drinking severity (DD) for alcoholic women but not for alcoholic men.
The gender dimorphism that we observed in the total reward system, including its individual DLPFC and VDC subregions, would suggest that alcoholism in women has different risk factors, etiologies, or consequences than in men. While it is reasonable to surmise that long-term alcohol abuse might cause decreased reward volumes in men, it is unlikely that long-term alcohol abuse leads to increased reward volumes in women, or that drinking severity and duration causes increases in brain volume measures in women. A more likely explanation, we believe, is that alcoholic women begin with larger reward volumes, and that the reward system volume gender dimorphism is a reflection of a phenotypic distinction that may be related to differing underlying neuroanatomical and neurobehavioral discrepancies in risk factors or in gender-based motivation to seek alcohol. For example, a study by Squeglia et al. (2012) supports the view of pre-existing risk factors contributing to our observed gender differences in the brain's reward system. Findings from that study showed gender differences in brain structure early in the course of drinking that may preexist in younger populations, with female drinkers having thicker cortices than same sex controls, and male drinkers having thinner cortices. The influence of gonadal and stress hormones also can contribute to differences in the brains of alcoholic men and women (Reilly et al., 2009; Esper & Furtado, 2013), and these hormones have been shown to modulate the action of reward circuitry in particular (Witt, 2007).
Evidence for or against the notion of gender-based motivation to drink, would require large prospective studies over many years, such as those currently in progress1. Nonetheless, alcoholic men and women are known to have differing neuropsychological and neurobehavioral profiles: alcoholic men, in aggregate, are more likely to have anti-social characteristics, whereas alcoholic women are more likely to have heightened anxiety co-morbidity (Leggio et al., 2009; Sameti et al., 2011). In addition, alcohol has paradoxical effects of acting as a stimulant and mood-enhancer in some individuals, and in others, as a relaxant and anxiety-reducer (Myrick, 2014). Thus, it may be that the neuroanatomical differences reported in the current study could potentially reflect an underlying gender difference in neuropsychological factors of motivational risk to developing alcoholism. However, caution is urged in that these data suggest only an aggregate dimorphism, and that there is substantial overlap between genders in both neuroanatomical and psychobehavioral effects.
Furthermore, we found that the structural impact of alcoholism was specific to the reward network. We did not observe significant alcoholism by gender interactions or alcoholism main effects in global brain and gray matter, or in cuneus or dorsal striatum comparison regions. Prior structural neuroimaging studies in alcoholism have reported volumetric reductions in cerebral cortex, white matter, and cerebellum, but these studies have yielded variable results (Oscar-Berman et al., 2014).
An important factor contributing to this variability is length of abstinence. One study (Pfefferbaum et al., 1995) found that alcoholics showed recovery of cortical gray matter, sulcal, and lateral ventricular volumes as early as a month into sobriety, as well as reduction in third ventricular volume with continued abstinence as early as one year. In another study (Cardenas et al., 2007), baseline atrophy in abstinent alcoholics was reversed following eight months of sobriety. In yet another study (Pfefferbaum et al., 1998) examining longitudinal cortical gray matter and ventricular changes in alcoholics and controls over a five-year period, alcoholics demonstrated faster gray matter volume loss than controls. However, alcoholics who maintained sobriety showed ventricular enlargement comparable to that of controls, and the authors suggested that continued alcohol abuse leads to progressive brain tissue volume shrinkage. In the present study, the average LOS of the ALC group was 6.3 years, with a maximum of 37.8 years, and this duration of abstinence may explain the similarity of the ALC and NC groups in overall brain volume, as LOS significantly correlated with lower ventricular volumes.
There was a negative correlation between hippocampus volume and drinking severity, which was reflected in both genders. The hippocampus is known to be highly sensitive to the neurotoxic effects of alcohol (Agartz et al., 1999; Sullivan et al., 1995), so this finding may reflect the sensitivity of hippocampus to alcoholism-related damage in both genders. The anterior cingulate relationship with daily drinks displayed a gender interaction that varied from the other gender dimorphic effects described above, with women showing smaller volumes and men showing larger volumes with more daily drinks. Finally, ventricular volume was inversely related to length of sobriety, thereby confirming both the deleterious cerebral effects of chronic alcoholism and the potential for improvement in brain structural deficits following abstinence.
4.2. Limitations
Despite the clear alcoholism by gender volumetric effects observed in the present study, there were several limitations. First, although the average level of education for ALC participants was 1.1 years lower than NC participants, and the average HRSD scores were 2.5 points higher in ALC participants, both groups had completed high school, and the mean HRSD scores were below 4.0 for both groups (individuals scoring above 20 can be considered depressed). Moreover, any participants with HRSD scores above 16 were excluded entirely. More importantly, the significant results revealed by the main morphometric analyses remained significant after covarying for education and HRSD. Second, we did not restrict study recruitment to ALC participants with a strong family history of alcohol dependence, and the morphometric alterations we observed may be more distinct in families with a high prevalence of alcoholism (that is, family history may be associated with pre-existing differences in reward system volumes). Third, this study used a cross-sectional approach. This approach prevented us from determining whether the relationships we observed predated the onset of heavy drinking (and thus could be considered risk factors for alcoholism) or were actually consequences of heavy drinking. Nevertheless, the present findings expanded upon results found in male participants by Makris and colleagues (Makris et al., 2008) by showing gender dimorphic alcoholism-related abnormalities.
Finally, because we examined numerous subregions of the reward system (Table 2), thereby increasing the study's vulnerability to a Type I error, we performed additional analyses with a false discovery rate multiple comparison correction procedure (Benjamini and Hochberg, 1995) for the 13 reward subregions. Despite this procedure's increasing the chance of making a Type II error, significant results were unchanged for the group by gender interaction involving the DLPFC, as well as for differences within the ALC group for the posterior parahippocampal gyrus and temporal pole, and for gender differences within the NC group for the temporal pole. However, no relationships among the 13 reward subregions and the drinking variables (DD, DHD, or LOS) remained significant. Nevertheless, it is important to note that our inclusion of each separate region was based upon independent findings derived from previously published reports, and the examination of each region represented an independent aim, although there is controversy regarding this justification (Veazie, 2006; Frane, 2015). Therefore, we reported the magnitudes of the effects — along with the confidence intervals, which reflect the probability levels — for each region we investigated. Such an approach is concordant with sophisticated Bayesian frameworks (Gelman and Shalizi, 2013).
5. Conclusions
The present study considered the reward network as an interconnected and interrelated system, using statistical analyses that treated it as a unique group of subregions. For the total extended reward and oversight system, as well as its DLPFC and VDC subregions, alcoholism was associated with smaller volumes in men; conversely, alcoholism was associated larger volumes in women, yielding a significant alcoholism by gender interaction. These findings demonstrated gender differences in brain reward circuitry. In terms of specific reward regions, alcoholism-associated changes were most apparent in DLPFC and VDC. The present study also connected reward network morphometry to drinking history, finding a number of effects and interactions. Additionally, total ventricular volume decreased in association with the number of years that alcoholics remained sober, suggesting significant recovery with abstinence. Overall, the findings highlight the impact of alcoholism on the reward network, the potential for amelioration of structural deficits with sobriety, and differences based on gender. Further exploration of these relationships may aid in finding potential biological and psychological therapeutic targets.
Supplementary Material
Highlights.
The volume of the brain's reward system was smaller in alcoholic men, but not alcoholic women.
These gender differences were most evident in dorsolateral prefrontal cortex and ventral diencephalon.
The volumes of several reward regions were related to drinking history.
Acknowledgments
This work was supported in part by grants from: National Institute on Alcohol Abuse and Alcoholism (NIAAA) R01-AA07112 and K05-AA00219, and by the US Department of Veterans Affairs Clinical Science Research and Development grant to Dr. Marlene Oscar Berman; the National Association for Research in Schizophrenia and Depression (NARSAD) and the National Institutes of Health National Center for Complementary and Alternative Medicine (NCAM) to Dr. Nikos Makris; and the Center for Functional Neuroimaging Technologies grant P41RR14075 from the National Center for Research Resources. We thank Diane Merritt, Trinity Urban, and Maria Valmas for assistance with recruitment, assessment, or neuroimaging of the research participants. The content is solely the responsibility of the authors and does not necessarily represent the official views of the National Institutes of Health, the U.S. Department of Veterans Affairs, or the United States Government.
Footnotes
The Adolescent Brain Cognitive Development [ABCD] USA Consortium Research Project
Conflicts of interest: None of the authors reported having any relevant biomedical financial interest or potential conflicts of interest.
Publisher's Disclaimer: This is a PDF file of an unedited manuscript that has been accepted for publication. As a service to our customers we are providing this early version of the manuscript. The manuscript will undergo copyediting, typesetting, and review of the resulting proof before it is published in its final citable form. Please note that during the production process errors may be discovered which could affect the content, and all legal disclaimers that apply to the journal pertain.
References
- Agartz I, Momenan R, Rawlings RR, Kerich MJ, Hommer DW. Hippocampal volume in patients with alcohol dependence. Arch Gen Psychiatry. 1999;56:356–363. doi: 10.1001/archpsyc.56.4.356. [DOI] [PubMed] [Google Scholar]
- Alheid GF, Heimer L. New perspectives in basal forebrain organization of special relevance for neuropsychiatric disorders: The striatopallidal, amygdaloid, and corticopetal components of substantia innominata. Neuroscience. 1988;27:1–39. doi: 10.1016/0306-4522(88)90217-5. [DOI] [PubMed] [Google Scholar]
- American Psychiatric Association. Diagnostic and Statistical Manual of Mental Disorders. Fourth. American Psychiatric Press; Washington, DC: 1994. [Google Scholar]
- Barbas H. Connections underlying the synthesis of cognition, memory, and emotion in primate prefrontal cortices. Brain Res Bull. 2000;52:319–330. doi: 10.1016/S0361-9230(99)00245-2. [DOI] [PubMed] [Google Scholar]
- Benjamini Y, Hochberg Y. Controlling the false discovery rate: A practical and powerful approach to multiple testing. J Royal Statist Soc Series B (Methodological) 1995;57:289–300. [Google Scholar]
- Bowirrat A, Oscar-Berman M. Relationship between dopaminergic neurotransmission, alcoholism, and reward deficiency syndrome. Am J Med Genet Part B Neuropsychiatr Genet. 2005;132B:29–37. doi: 10.1002/ajmg.b.30080. [DOI] [PubMed] [Google Scholar]
- Briggs GG, Nebes RD. Patterns of hand preference in a student population. Cortex. 1975;11:230–238. doi: 10.1016/S0010-9452(75)80005-0. [DOI] [PubMed] [Google Scholar]
- Cahalan V, Cisin I, Crossley HM. American Drinking Practices: A National Study of Drinking Behavior and Attitudes, Report 6. Rutgers Center for Alcohol Studies; New Brunswick, NJ: 1969. [Google Scholar]
- Cardenas VA, Studholme C, Gazdzinski S, Durazzo TC, Meyerhoff DJ. Deformation-based morphometry of brain changes in alcohol dependence and abstinence. Neuroimage. 2007;34:879–887. doi: 10.1016/j.neuroimage.2006.10.015. [DOI] [PMC free article] [PubMed] [Google Scholar]
- Cavacuiti CA, editor. Principles of Addiction Medicine: The Essentials. first. Lippincott Williams & Wilkins; Philadelphia: 2011. [Google Scholar]
- Caviness VS, Kennedy DN, Richelme C, Rademacher J, Filipek PA. The human brain age 7–11 years: A volumetric analysis based on magnetic resonance images. Cereb Cortex. 1996a;6:726–736. doi: 10.1093/cercor/6.5.726. [DOI] [PubMed] [Google Scholar]
- Caviness VS, Meyer J, Makris N, Kennedy DN. MRI-based topographic parcellation of human neocortex: An anatomically specified method with estimate of reliability. J Cogn Neurosci. 1996b;8:566–587. doi: 10.1162/jocn.1996.8.6.566. [DOI] [PubMed] [Google Scholar]
- Cook RD. Detection of influential observation in linear regression. Technometrics. 1977;19:15–18. doi: 10.2307/1268249. [DOI] [Google Scholar]
- Devlin JT, Poldrack RA. In praise of tedious anatomy. Neuroimage. 2007;37:1033–1038. doi: 10.1016/j.neuroimage.2006.09.055. [DOI] [PMC free article] [PubMed] [Google Scholar]
- De Fossé L, Hodge SM, Makris N, Kennedy DN, Caviness VS, McGrath L, Steele S, Ziegler DA, Herbert MR, Frazier JA, Tager-Flusberg H, Harris GJ. Language-association cortex asymmetry in autism and specific language impairment. Ann Neurol. 2004;56:757–766. doi: 10.1002/ana.20275. [DOI] [PubMed] [Google Scholar]
- Esper LH, Furtado EF. Gender differences and association between psychological stress and alcohol consumption: a systematic review. J Alcohol Drug Depend. 2013;1:116. doi: 10.4172/2329-6488.1000116. [DOI] [Google Scholar]
- Filipek PA, Richelme C, Kennedy DN, Caviness VS. The young adult human brain: An MRI-based morphometric analysis. Cereb Cortex. 1994;4:344–360. doi: 10.1093/cercor/4.4.344. [DOI] [PubMed] [Google Scholar]
- Fischl B. Automatically parcellating the human cerebral cortex. Cereb Cortex. 2004;14:11–22. doi: 10.1093/cercor/bhg087. [DOI] [PubMed] [Google Scholar]
- Fischl B, Salat DH, Busa E, Albert M, Dieterich M, Haselgrove C, van der Kouwe A, Killiany R, Kennedy D, Klaveness S, Montillo A, Makris N, Rosen B, Dale AM. Whole brain segmentation. Neuron. 2002;33:341–355. doi: 10.1016/S0896-6273(02)00569-X. [DOI] [PubMed] [Google Scholar]
- Frane AV. Planned hypothesis tests are not necessarily exempt from multiplicity adjustment. [accessed 13.10.2016];J Res Pract. 2015 11 Article P2. http://jrp.icaap.org/index.php/jrp/article/view/514/417. [Google Scholar]
- Frazier JA, Chiu S, Breeze JL, Makris N, Lange N, Kennedy DN, Herbert MR, Bent EK, Koneru VK, Dieterich ME, Hodge SM, Rauch SL, Grant PE, Cohen BM, Seidman LJ, Caviness VS, Biederman J. Structural brain magnetic resonance imaging of limbic and thalamic volumes in pediatric bipolar disorder. Am J Psychiatry. 2005;162:1256–1265. doi: 10.1176/appi.ajp.162.7.1256. [DOI] [PubMed] [Google Scholar]
- Fuster JM. The Prefrontal Cortex Anatomy, Physiology, and Neuropsychology of the Frontal Lobe. Lippincott-Raven; Philadelphia: 1997. [Google Scholar]
- Gelman A, Shalizi CR. Philosophy and the practice of Bayesian statistics. Br J Math Stat Psychol. 2013;66:8–38. doi: 10.1111/j.2044-8317.2011.02037.x. [DOI] [PMC free article] [PubMed] [Google Scholar]
- Goldstein JM, Goodman JM, Seidman LJ, Kennedy DN, Makris N, Lee H, Tourville J, Caviness VS, Faraone SV, Tsuang MT. Cortical abnormalities in schizophrenia identified by structural magnetic resonance imaging. Arch Gen Psychiatry. 1999;56:537–547. doi: 10.1001/archpsyc.56.6.537. [DOI] [PubMed] [Google Scholar]
- Goldstein JM, Seidman LJ, Horton NJ, Makris N, Kennedy DN, Caviness VS, Faraone SV, Tsuang MT. Normal sexual dimorphism of the adult human brain assessed by in vivo magnetic resonance imaging. Cereb Cortex. 2001;11:490–497. doi: 10.1093/cercor/11.6.490. [DOI] [PubMed] [Google Scholar]
- Hamilton M. A rating scale for depression. J Neurol Neurosurg Psychiatry. 1960;23:56–62. doi: 10.1136/jnnp.23.1.56. [DOI] [PMC free article] [PubMed] [Google Scholar]
- Harris GJ, Jaffin SK, Hodge SM, Kennedy D, Caviness VS, Marinkovic K, Papadimitriou GM, Makris N, Oscar-Berman M. Frontal white matter and cingulum diffusion tensor imaging deficits in alcoholism. Alcohol Clin Exp Res. 2008;32:1001–1013. doi: 10.1111/j.1530-0277.2008.00661.x. [DOI] [PMC free article] [PubMed] [Google Scholar]
- Heimer L, Van Hoesen GW. The limbic lobe and its output channels: Implications for emotional functions and adaptive behavior. Neurosci Biobehav Rev. 2006;30:126–147. doi: 10.1016/j.neubiorev.2005.06.006. [DOI] [PubMed] [Google Scholar]
- Herbert MR, Ziegler DA, Deutsch CK, O'Brien LM, Lange N, Bakardjiev A, Hodgson J, Adrien KT, Steele S, Makris N, Kennedy D, Harris GJ, Caviness VS. Dissociations of cerebral cortex, subcortical and cerebral white matter volumes in autistic boys. Brain. 2003;126:1182–1192. doi: 10.1093/brain/awg110. [DOI] [PubMed] [Google Scholar]
- Hommer DW. Male and female sensitivity to alcohol-induced brain damage. Alcohol Res Heal. 2003;27:181–185. [PMC free article] [PubMed] [Google Scholar]
- Hommer DW, Momenan R, Rawlings R, Ragan P, Williams W, Rio D, Eckardt M. Decreased corpus callosum size among alcoholic women. Arch Neurol. 1996;53:359–363. doi: 10.1001/archneur.1996.00550040099019. [DOI] [PubMed] [Google Scholar]
- Jacobson R. Female alcoholics: A controlled CT brain scan and clinical study. Addiction. 1986;81:661–669. doi: 10.1111/j.1360-0443.1986.tb00386.x. [DOI] [PubMed] [Google Scholar]
- Kennedy DN, Filipek PA, Caviness VS. Anatomic segmentation and volumetric calculations in nuclear magnetic resonance imaging. IEEE Trans Med Imaging. 1989;8:1–7. doi: 10.1109/42.20356. [DOI] [PubMed] [Google Scholar]
- Kroft CL, Gescuk B, Woods BT, Mello NK, Weiss RD, Mendelson JH. Brain ventricular size in female alcoholics: An MRI study. Alcohol. 1991;8:31–34. doi: 10.1016/0741-8329(91)91200-L. [DOI] [PubMed] [Google Scholar]
- Laakso M, Vaurio O, Savolainen L, Repo E, Soininen H, Aronen H, Tiihonen J. A volumetric MRI study of the hippocampus in Type 1 and 2 alcoholism. Behav Brain Res. 2000;109:177–186. doi: 10.1016/S0166-4328(99)00172-2. [DOI] [PubMed] [Google Scholar]
- LaBar KS, Cabeza R. Cognitive neuroscience of emotional memory. Nat Rev Neurosci. 2006;7:54–64. doi: 10.1038/nrn1825. [DOI] [PubMed] [Google Scholar]
- Lancaster FE. Gender differences in the brain: Implications for the study of human alcoholism. Alcohol Clin Exp Res. 1994;18:740–746. doi: 10.1111/j.1530-0277.1994.tb00940.x. [DOI] [PubMed] [Google Scholar]
- LeDoux JE, Farb CR, Romanski LM. Overlapping projections to the amygdala and striatum from auditory processing areas of the thalamus and cortex. Neurosci Lett. 1991;134:139–144. doi: 10.1016/0304-3940(91)90526-Y. [DOI] [PubMed] [Google Scholar]
- LeDoux JE, Iwata J, Cicchetti P, Reis DJ. Different projections of the central amygdaloid nucleus mediate autonomic and behavioral correlates of conditioned fear. J Neurosci. 1988;8:2517–2529. doi: 10.1523/JNEUROSCI.08-07-02517.1988. [DOI] [PMC free article] [PubMed] [Google Scholar]
- Leggio L, Kenna GA, Fenton M, Bonenfant E, Swift RM. Typologies of alcohol dependence. From Jellinek to genetics and beyond. Neuropsychol Rev. 2009;19:115–129. doi: 10.1007/s11065-008-9080-z. [DOI] [PubMed] [Google Scholar]
- Makris N, Gasic GP, Seidman LJ, Goldstein JM, Gastfriend DR, Elman I, Albaugh MD, Hodge SM, Ziegler DA, Sheahan FS, Caviness VS, Tsuang MT, Kennedy DN, Hyman SE, Rosen BR, Breiter HC. Decreased absolute amygdala volume in cocaine addicts. Neuron. 2004;44:729–740. doi: 10.1016/j.neuron.2004.10.027. [DOI] [PubMed] [Google Scholar]
- Makris N, Meyer JW, Bates JF, Yeterian EH, Kennedy DN, Caviness VS. MRI-based topographic parcellation of human cerebral white matter and nuclei. Neuroimage. 1999;9:18–45. doi: 10.1006/nimg.1998.0384. [DOI] [PubMed] [Google Scholar]
- Makris N, Oscar-Berman M, Jaffin SK, Hodge SM, Kennedy DN, Caviness VS, Marinkovic K, Breiter HC, Gasic GP, Harris GJ. Decreased volume of the brain reward system in alcoholism. Biol Psychiatry. 2008;64:192–202. doi: 10.1016/j.biopsych.2008.01.018. [DOI] [PMC free article] [PubMed] [Google Scholar]
- Mann K, Ackermann K, Croissant B, Mundle G, Nakovics H, Diehl A. Neuroimaging of gender differences in alcohol dependence: Are women more vulnerable? Alcohol Clin Exp Res. 2005;29:896–901. doi: 10.1097/01.ALC.0000164376.69978.6B. [DOI] [PubMed] [Google Scholar]
- Myrick H. The American Psychiatric Publishing Textbook of Substance Abuse Treatment. American Psychiatric Publishing; Washington, DC: 2014. Treatment of alcohol intoxication and alcohol withdrawal; pp. 159–168. [DOI] [Google Scholar]
- Ochsner KN, Gross JJ. The cognitive control of emotion. Trends Cogn Sci. 2005;9:242–249. doi: 10.1016/j.tics.2005.03.010. [DOI] [PubMed] [Google Scholar]
- Oscar-Berman M, Bowirrat A. Genetic influences in emotional dysfunction and alcoholism-related brain damage. Neuropsychiatr Dis Treat. 2005;1:211–229. [PMC free article] [PubMed] [Google Scholar]
- Oscar-Berman M, Marinković K. Alcohol: Effects on neurobehavioral functions and the brain. Neuropsychol Rev. 2007;17:239–257. doi: 10.1007/s11065-007-9038-6. [DOI] [PMC free article] [PubMed] [Google Scholar]
- Oscar-Berman M, Song J. Brain volumetric measures in alcoholics: a comparison of two segmentation methods. Neuropsychiatr Dis Treat. 2011;7:65–75. doi: 10.2147/NDT.S13405. [DOI] [PMC free article] [PubMed] [Google Scholar]
- Oscar-Berman M, Valmas MM, Sawyer KS, Ruiz SM, Luhar RB, Gravitz ZR. Profiles of impaired, spared, and recovered neuropsychologic processes in alcoholism. In: Pfefferbaum A, Sullivan EV, editors. Handbook of Clinical Neurology: Alcohol and the Nervous System. Elsevier; Edinburgh: 2014. pp. 183–210. [DOI] [PMC free article] [PubMed] [Google Scholar]
- Petrides M, Pandya DN. Association pathways of the prefrontal cortex and functional observations. In: Stuss DT, Knight RT, editors. Principles of Frontal Lobe Function. Oxford University Press; New York: 2002. pp. 31–50. [DOI] [Google Scholar]
- Pfefferbaum A, Adalsteinsson E, Sullivan EV. Frontal circuitry degradation marks healthy adult aging: Evidence from diffusion tensor imaging. Neuroimage. 2005;26:891–899. doi: 10.1016/j.neuroimage.2005.02.034. [DOI] [PubMed] [Google Scholar]
- Pfefferbaum A, Rosenbloom M, Deshmukh A, Sullivan EV. Sex differences in the effects of alcohol on brain structure. Am J Psychiatry. 2001;158:188–197. doi: 10.1176/appi.ajp.158.2.188. [DOI] [PubMed] [Google Scholar]
- Pfefferbaum A, Rosenbloom M, Rohlfing T, Sullivan EV. Degradation of association and projection white matter systems in alcoholism detected with quantitative fiber tracking. Biol Psychiatry. 2009;65:680–690. doi: 10.1016/j.biopsych.2008.10.039. [DOI] [PMC free article] [PubMed] [Google Scholar]
- Pfefferbaum A, Rosenbloom M, Serventi KL, Sullivan EV. Corpus callosum, pons, and cortical white matter in alcoholic women. Alcohol Clin Exp Res. 2002;26:400–406. doi: 10.1111/j.1530-0277.2002.tb02552.x. [DOI] [PubMed] [Google Scholar]
- Pfefferbaum A, Rosenbloom MJ, Fama R, Sassoon SA, Sullivan EV. Transcallosal white matter degradation detected with quantitative fiber tracking in alcoholic men and women: selective relations to dissociable functions. Alcohol Clin Exp Res. 2010;34:1201–1211. doi: 10.1111/j.1530-0277.2010.01197.x. [DOI] [PMC free article] [PubMed] [Google Scholar]
- Pfefferbaum A, Sullivan EV. Microstructural but not macrostructural disruption of white matter in women with chronic alcoholism. Neuroimage. 2002;15:708–718. doi: 10.1006/nimg.2001.1018. [DOI] [PubMed] [Google Scholar]
- Pfefferbaum A, Sullivan EV, Mathalon DH, Shear PK, Rosenbloom MJ, Lim KO. Longitudinal changes in magnetic resonance imaging brain volumes in abstinent and relapsed alcoholics. Alcohol Clin Exp Res. 1995;19:1177–1191. doi: 10.1111/j.1530-0277.1995.tb01598.x. [DOI] [PubMed] [Google Scholar]
- Pfefferbaum A, Sullivan EV, Rosenbloom MJ, Mathalon DH, Lim KO. A controlled study of cortical gray matter and ventricular changes in alcoholic men over a 5-year interval. Arch Gen Psychiatry. 1998;55:905–912. doi: 10.1001/archpsyc.55.10.905. [DOI] [PubMed] [Google Scholar]
- Reilly W, Koirala B, Devaud LL. Sex differences in acoustic startle responses and seizure thresholds between ethanol-withdrawn male and female rats. Alcohol Alcohol. 2009;44:561–566. doi: 10.1093/alcalc/agp049. [DOI] [PMC free article] [PubMed] [Google Scholar]
- Robins LN, Cottler LB, Bucholz KK, Compton WM, North CS, Rourke KM. Diagnostic Interview Schedule for the DSM-IV (DIS-IV) Washington University School of Medicine; St. Louis, MO: 2000. [Google Scholar]
- Ruiz SM, Oscar-Berman M. Closing the gender gap: The case for gender-specific alcoholism research. J Alcohol Drug Depend. 2013;1:e106. doi: 10.4172/2329-6488.1000e106. [DOI] [PMC free article] [PubMed] [Google Scholar]
- Ruiz SM, Oscar-Berman M, Sawyer KS, Valmas MM, Urban T, Harris GJ. Drinking history associations with regional white matter volumes in alcoholic men and women. Alcohol Clin Exp Res. 2013;37:110–22. doi: 10.1111/j.1530-0277.2012.01862.x. [DOI] [PMC free article] [PubMed] [Google Scholar]
- Sameti M, Smith S, Patenaude B, Fein G. Subcortical volumes in long-term abstinent alcoholics: Associations with psychiatric comorbidity. Alcohol Clin Exp Res. 2011;35:1067–1080. doi: 10.1111/j.1530-0277.2011.01440.x. [DOI] [PMC free article] [PubMed] [Google Scholar]
- Schmahmann JD, Pandya DN. Fiber Pathways of the Brain. Oxford University Press; New York: 2006. [DOI] [Google Scholar]
- Schneider F, Habel U, Wagner M, Franke P, Salloum JB, Shah NJ, Toni I, Sulzbach C, Hönig K, Maier W, Gaebel W, Zilles K. Subcortical correlates of craving in recently abstinent alcoholic patients. Am J Psychiatry. 2001;158:1075–1083. doi: 10.1176/appi.ajp.158.7.1075. [DOI] [PubMed] [Google Scholar]
- Schweinsburg BC, Alhassoon OM, Taylor MJ, Gonzalez R, Videen JS, Brown GG, Patterson TL, Grant I. Effects of alcoholism and gender on brain metabolism. Am J Psychiatry. 2003;160:1180–1183. doi: 10.1176/appi.ajp.160.6.1180. [DOI] [PubMed] [Google Scholar]
- Seidman LJ, Faraone SV, Goldstein JM, Goodman JM, Kremen WS, Toomey R, Tourville J, Kennedy D, Makris N, Caviness VS, Tsuang MT. Thalamic and amygdala–hippocampal volume reductions in first-degree relatives of patients with schizophrenia: An MRI-based morphometric analysis. Biol Psychiatry. 1999;46:941–954. doi: 10.1016/S0006-3223(99)00075-X. [DOI] [PubMed] [Google Scholar]
- Squeglia LM, Pulido C, Wetherill RR, Jacobus J, Brown GG, Tapert SF. Brain response to working memory over three years of adolescence: influence of initiating heavy drinking. J Stud Alcohol Drugs. 2012;73:749–760. doi: 10.15288/jsad.2012.73.749. [DOI] [PMC free article] [PubMed] [Google Scholar]
- Sullivan EV, Deshmukh A, Desmond JE, Lim KO, Pfefferbaum A. Cerebellar volume decline in normal aging, alcoholism, and Korsakoff's syndrome: Relation to ataxia. Neuropsychology. 2000;14:341–352. doi: 10.1037/0894-4105.14.3.341. [DOI] [PubMed] [Google Scholar]
- Sullivan EV, Marsh L, Mathalon DH, Lim KO, Pfefferbaum A. Anterior hippocampal volume deficits in nonamnesic, aging chronic alcoholics. Alcohol Clin Exp Res. 1995;19:110–122. doi: 10.1111/j.1530-0277.1995.tb01478.x. [DOI] [PubMed] [Google Scholar]
- Sullivan EV, Rosenbloom M, Serventi KL, Pfefferbaum A. Effects of age and sex on volumes of the thalamus, pons, and cortex. Neurobiol Aging. 2004;25:185–192. doi: 10.1016/S0197-4580(03)00044-7. [DOI] [PubMed] [Google Scholar]
- Szabo Z, Owonikoko T, Peyrot M, Varga J, Mathews WB, Ravert HT, Dannals RF, Wand G. Positron emission tomography imaging of the serotonin transporter in subjects with a history of alcoholism. Biol Psychiatry. 2004;55:766–771. doi: 10.1016/j.biopsych.2003.11.023. [DOI] [PubMed] [Google Scholar]
- U.S. Department of Health and Human Services (USDHHS) Ninth special report to the US Congress on alcohol and health from the Secretary of Health and Human Services. USDHHS, Public Health Service, National Institutes of Health, National Institute on Alcohol Abuse and Alcoholism; Washington, DC: 1997. [Google Scholar]
- Veazie PJ. When to combine hypotheses and adjust for multiple tests. Health Serv Res. 2006;41:804–818. doi: 10.1111/j.1475-6773.2006.00512.x. [DOI] [PMC free article] [PubMed] [Google Scholar]
- Volkow ND, Koob GF, McLellan AT. Neurobiologic advances from the brain disease model of addiction. New Engl J Med. 2016;374:363–371. doi: 10.1056/NEJMra1511480. [DOI] [PMC free article] [PubMed] [Google Scholar]
- Witt ED. Puberty, hormones, and sex differences in alcohol abuse and dependence. Neurotoxicol Teratol. 2007;29:81–95. doi: 10.1016/j.ntt.2006.10.013. [DOI] [PubMed] [Google Scholar]
- Wechsler D. WAIS-III Administration and Scoring Manual. The Psychological Corporation; San Antonio, TX: 1997a. [Google Scholar]
- Wechsler D. WMS-III Administration and Scoring Manual. The Psychological Corporation; San Antonio, TX: 1997b. [Google Scholar]
- Zuckerman M, Lubin B. Multiple Affect Adjective Check List. Educational and Industrial Testing Service; San Diego, CA: 1965. [Google Scholar]
Associated Data
This section collects any data citations, data availability statements, or supplementary materials included in this article.