Abstract
Background
The safety of front‐line chemotherapies for the treatment of extensive stage small‐cell lung cancer (ED‐SCLC) is uncertain. We carried out a network meta‐analysis to compare the toxicity of different therapies for ED‐SCLC.
Methods
We searched EMBASE, PubMed, CENTRAL and clinicaltrials.gov. We performed network meta‐analysis on hematological (anemia, leukopenia, neutropenia, and thrombocytopenia) and non‐hematological toxicities (diarrhea, infection, and nausea and vomiting).
Results
Nine studies with 2317 patients were included. Etoposide with carboplatin (EC) was associated with a higher incidence of anemia (odds ratio [OR] 2.02, 95% confidence interval [CI] 1.13–3.63), leukopenia (OR 2.67, 95% CI 1.25–5.72), neutropenia (OR 12.08, 95% CI 2.13–68.66), and thrombocytopenia (OR 2.73, 95% CI 1.27–5.85) compared with irinotecan with carboplatin (IC). Similarly, etoposide with cisplatin (EP) was associated with a higher incidence of anemia (OR 1.70, 95% CI 1.13–2.56), leukopenia (OR 2.65, 95% CI 1.34–5.28), neutropenia (OR 5.70, 95% CI 2.93–11.10), and thrombocytopenia (OR 3.26, 95% CI 1.66–6.38) compared with irinotecan with cisplatin (IP). EC was associated with a lower incidence of diarrhea (OR 0.26, 95% CI 0.10–0.68) compared with IC, and EP was associated with a lower incidence of diarrhea (OR 0.09, 95% CI 0.03–0.25) and nausea and vomiting (OR 0.53, 95% CI 0.33–0.84) than IP.
Conclusions
Hematological toxicities were most common in EC‐treated patients, while the lowest incidence occurred with IP treatment. The IP regimen was associated with the highest incidence of toxicities of the digestive tract, while the lowest incidence occurred with EC treatment.
Keywords: Adverse effects, network meta‐analyses, small cell lung cancer patients with extensive disease
Introduction
Small cell lung cancer (SCLC), with a short doubling time, as well as early invasion and rapid metastasis, is the most aggressive type of lung cancer. Approximately 60–70% of patients with SCLC are initially diagnosed at extensive stage, which has a poor median overall survival (mOS) of six weeks.1, 2 Currently, platinum‐based chemotherapy (platinum in combination with etoposide or irinotecan) is the primary treatment for extensive stage small‐cell lung cancer (ED‐SCLC), as previous studies have proven the role of chemotherapy in alleviating symptoms and prolonging survival.3, 4, 5
Despite the fact that some traditional pairwise meta‐analyses have assessed the safety of front‐line chemotherapies for the treatment ED‐SCLC, none of these studies conducted a comprehensive evaluation of the four available front‐line chemotherapy regimens; comparisons were only made between two chemotherapy regimens, which failed to provide a rank of the comparative effectiveness of multiple interventions.6, 7, 8, 9 Recently, Bakalos et al. conducted a network meta‐analysis to estimate the effectiveness and tolerability of chemotherapy regimens in SCLC.10 However, this study did not distinguish patients with extensive stage from those with limited stage, which made for less convincing conclusions. Furthermore, toxicities other than neutropenia and febrile neutropenia were not assessed in this study. Thus, evidence of the relative toxicities of these front‐line therapies need to be further integrated and compared.
We carried out a network meta‐analysis to compare the toxicity of different therapies for patients with ED‐SCLC. By integrating direct evidence (from head‐to‐head trials) with indirect evidence (information about two treatments derived via a common intermediate comparator), the study provides the hierarchies of these interventions based on the frequency of toxicities, thus demonstrating the optimal chemotherapy regimens with acceptable toxicities and enabling comprehensive evidence synthesis for guiding clinical practice.11
Methods
Eligibility criteria
Participants
We included randomized controlled trials (RCTs) of patients with untreated ED‐SCLC. We only abstracted the data of patients with ED‐SCLC if the studies included both patients with ED‐SCLC and patients with limited SCLC. We excluded studies of patients who received surgery, radiotherapy, or chemotherapy before receiving first‐line chemotherapy.
Interventions and comparisons
We included studies with any two of the following interventions: irinotecan with cisplatin (IP), etoposide with carboplatin (EC), irinotecan with carboplatin (IC), and etoposide with cisplatin (EP). We ignored the dosage, route, and time of the interventions to facilitate calculation.
Outcomes
Hematological (anemia, leukopenia, neutropenia, and thrombocytopenia) and non‐hematological toxicities (diarrhea, infection, and nausea and vomiting) were included. We did not include other adverse effects (such as renal and kidney function), because of the limited number of relevant studies and sample sizes, which were not adequate to form a relative comprehensive network.
Study design
We included parallel RCTs. We did not restrict the type of language or duration of follow‐up.
Information sources and search strategy
We searched EMBASE, PubMed, CENTRAL, and clinicaltrials.gov using the terms “small‐cell lung cancer,” “randomized controlled trials,” and their synonyms. In addition, we searched the references of included studies, relevant guidelines, and reviews to minimize possible omission.
Study and information selection process
Two authors independently made the preliminary selection according to citation title and abstract. After obtaining the full text, two authors performed secondary screening and recorded reasons to exclude any study. Any disagreement during the process was solved by discussion. A third author was consulted if no consensus was achieved.
We used a standard Excel table to extract the details of included studies (e.g. duration of follow‐up, generation of random sequence, and concealment of allocation), participants (e.g. stage of cancer, diagnostic criteria, and baseline characteristics), interventions and comparisons, outcomes, and others factors which might affect the results. If information was unclear, we contacted the corresponding author of the included study.
Methodological quality appraisal
Two authors independently assessed the methodological quality of the included studies with the Cochrane risk of bias tool.12 The tool included seven domains: random sequence generation, allocation concealment, blinding of participants and personnel, attrition bias, reporting bias, blinding of outcome evaluators, and other bias (such as commercial sponsorships, early drop‐out, and baseline unbalance). We judged each domain with yes, no, or unclear.
Synthesis
All outcomes were indicated with odds ratios (ORs) and corresponding 95% confidence intervals (CIs). The network geometry showed that no comparison was informed by either direct or indirect evidence. Thus, to estimate the network estimates, we used the command “mvmeta” to synthesize the data through STATA V 13.1 (Stata Corp, College Station, TX, USA).13 For transitivity assumption, we compared the baseline characteristics of each included study and performed data synthesis after verifying that the transitivity among different studies was good.14 Consistency could not be assessed, as only tree‐shaped networks were available.14 We assumed a common within‐network between‐study variance indicated by I2 calculated using the restricted maximum likelihood method (if a value of I2 exceeds 0.5, then significant heterogeneity is considered to exist between studies).15 We did not perform a funnel plot for publication bias because the number of included studies was less than 10.16 To confirm the robustness of the results, we calculated the predictive interval (PrI) of each outcome and excluded studies with a high risk of bias as sensitivity analyses (we did not conduct sensitivity analysis if a comparison only included one study). The value of PrI is relatively more conservative than CI and predicts the potential treatment effects caused by an additionally available study.17 We did not perform subgroup analysis to assess potential effect modifiers because some comparisons only included one study. For presentation of the intervention hierarchy, the surface under the cumulative ranking (SUCRA) curve was used to rank the treatments according to their safety. A rank‐heat plot was used to depict the SUCRA values for all outcomes.18
Results
Literature search
Figure 1 depicts a PRISMA flow diagram of study identification and selection. A total of 2378 references were identified through database searches and additional sources on 15 April 2016. After removing the duplicates and screening, 87 studies were considered eligible for full‐text assessment. Finally, nine studies were included in the network meta‐analyses.19, 20, 21, 22, 23, 24, 25, 26, 27 Of the 78 excluded studies, 52 studies contained inappropriate control groups, 17 lacked relevant interventions, eight were non‐RCTs, and one study contained an inseparable target population (interest outcomes of ED‐SCLC cannot be extracted from overall SCLC).
Figure 1.
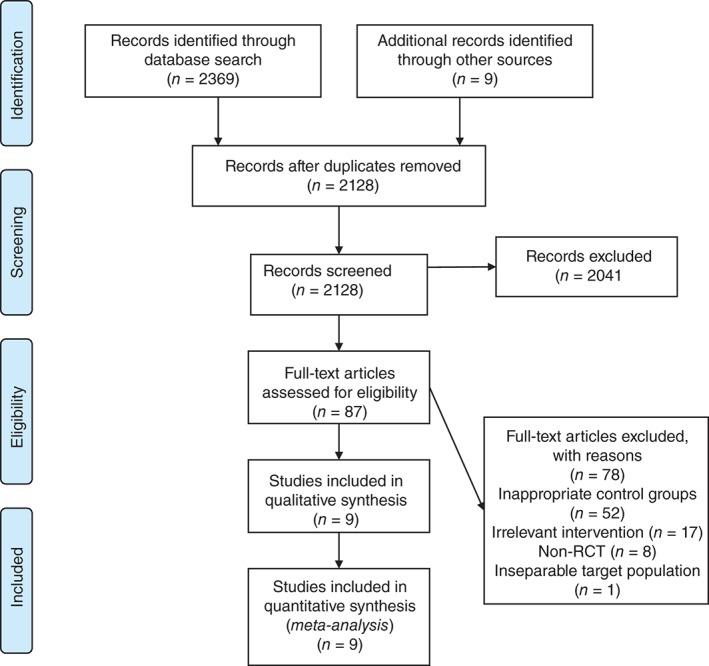
PRISMA flow diagram. RCT, randomized controlled trial.
Study features
A summary of the nine included RCTs, containing a total of 2317 participants, are detailed in Table 1. The sample size in each study varied from 61 to 651, and the median age of patients ranged from 51 to 74 years old. Cisplatin or carboplatin combined with etoposide or irinotecan were evaluated in the nine included studies. Four studies were performed in Europe, three in Asia, and two in the United States.
Table 1.
The characteristics of included studies
| Study | Comparators | Dosage | Country | Race | Sample size | Gender (M/F) | Age (median) | Follow‐up | Premedication |
|---|---|---|---|---|---|---|---|---|---|
| Hermes et al. 20 | IRI + CAR vs. ETO + CAR |
Group A IRI: 175 mg/m2 IV day 1; 4 cycles CAR: (AUC) = 4 IV day 1; 4 cycles Group B ETO: 120 mg/m2 orally day 1–5; 4 cycles CAR: (AUC) = 4 IV day 1; 4 cycles |
Norway, Sweden | NA | 209 | 138/71 | 67 vs. 68 | 40 weeks | Trimethoprim/sulfamethoxazole 160/800mg and ofloxacin 200mg (day 5 to day 14; the first circle) |
| Lara et al. 21 † | IRI + CIS vs. ETO + CIS |
Group A IRI: 60 mg/m2 IV days 1, 5, 8; 4 cycles CIS: 60 mg/m2 IV day 1; 4 cycles Group B ETO: 100 mg/m2 IV days 1–3; 4 cycles CIS: 80 mg/m2 IV day 1; 4 cycles |
US |
White: 93% vs. 93% Black: 4% vs. 6% Asian: 1% vs. 0% Others: 2% vs. 1% |
651 | 370/281 | 62 vs. 63 | NA | Antiemetic drugs |
| Hanna et al. 19 | IRI + CIS vs. ETO + CIS |
Group A IRI: 65 mg/m2 IV days 1, 8; 4 cycles CIS: 30 mg/m2 IV days 1, 8; 4 cycles Group B ETO: 120 mg/m2 IV day 1; 4 cycles CIS: 60 mg/m2 IV day 1; 4 cycles |
US |
White: 92.3% vs. 88.2. Black: 2.3% vs. 5.5% Asian: 0.9% vs. 0.9% Others: 4.5% vs. 5.4% |
331 | 189/141 | 63 vs. 62 | 18 months | NA |
| Noda et al. 22 | IRI + CIS vs. ETO + CIS |
Group A IRI: 60 mg/m2 IV days 1, 8, 15; 4 cycles CIS: 60 mg/m2 IV day 1; 4 cycles Group B ETO: 100 mg/m2 IV days 1–3; 4 cycles CIS: 80 mg/m2 IV day 1; 4 cycles |
Japan | NA | 154 | 136/22 | 63 vs. 63 | 1.5 years | Antiemetic drugs |
| Okamoto et al. 23 | ETO + CAR vs. ETO + CIS |
Group A ETO: 80 mg/m2 IV days 1–3; 4 cycles CAR: (AUC) = 5 IV day 1; 4 cycles Group B ETO: 80 mg/m2 IV days 1–3; 4 cycles CIS: 25 mg/m2 IV days 1–3; 4 cycles |
Japan | NA | 220 | 193/27 | 74 vs. 73.5 | NA | NA |
| Pan et al. 24 | IRI + CIS vs. ETO + CIS |
Group A IRI: 80 mg/m2 IV days 1, 8, 15; 4 cycles CIS: 80 mg/m2 IV days 1–3; 4 cycles Group B ETO: 120 mg/m2 IV days 1–3; 4 cycles CIS: 80 mg/m2 IV day 1–3; 4 cycles |
China | NA | 61 | 47/14 | 54 vs. 51 | NA | NA |
| Schmittel et al. 26 | IRI + CAR vs. ETO + CAR |
Group A IRI: 50 mg/m2 IV days 1, 8, 15; 4 cycles CAR: (AUC) = 5 IV day 1; 4 cycles Group B ETO: 140 mg/m2 IV days 1–3; 4 cycles CAR: (AUC) = 5 IV day 1; 4 cycles |
German | NA | 216 | 141/75 | 60 vs. 63 | NA | Antiemetic therapy consisting of 5‐HT3 antagonist iv |
| Zatloukal et al. 27 | IRI + CIS vs. ETO + CIS |
Group A IRI: 65 mg/m2 IV days 1, 8; 6 cycles CIS: 80 mg/m2 IV day 1; 6 cycles Group B ETO: 100 mg/m2 IV days 1–3; 6 cycles CIS: 80 mg/m2 IV day 1; 6 cycles |
Europe | NA | 405 | 309/96 | 60 vs. 61 | 31.6 months | NA |
| Schmittel et al. 25 | IRI + CAR vs. ETO + CAR |
Group A IRI: 50 mg/m2 IV days 1, 8, 15; 4 cycles CAR: [AUC] = 5 IV day 1; 4 cycles Group B ETO: 140 mg/m2 IV days 1–3; 4 cycles CAR: (AUC) = 5 IV day 1; 4 cycles |
German | NA | 70 | 50/20 | 59 vs. 63 | 21 months | Antiemetic therapy consisting of 5‐HT3 antagonist iv |
ABCB1 (C3435T) T/T was associated with an increased risk of irinotecan‐associated grade 3 or worse diarrhea (odds ratio [OR] 3.9; 95% confidence interval [CI] 1.1–13.8) compared with C/C and C/T; UGT1A1 (G‐3156A) A/A was associated with an increased risk of irinotecan‐associated grade 3 or worse neutropenia (OR 24; 95% CI 2–282); combined grade 3 neutropenia and diarrhea was associated with ABCB1 (C3435) T/T (OR 5.0; 95% CI 1.2–22.9) and UGT1A1 (G‐3156A) A/A (OR 7.6; 95% CI 0.9–63).
AUC, area under the curve; CAR, carboplatin; CIS, cisplatin; ETO, etoposide; F, female; IRI, irinotecan; IV, intravenous; M, male; NA, not available.
Risk of bias in included studies
Figure 2 provides the judgments of the risk of bias in the nine included trials. Random sequence generation and allocation concealment were adequately performed in seven and three studies separately. All studies required the blinding of participants and personnel, and were considered as having a low risk of attrition or reporting bias. Only two trials blinded the process of outcome assessment. Considering the other bias, three trials received commercial sponsorships.
Figure 2.
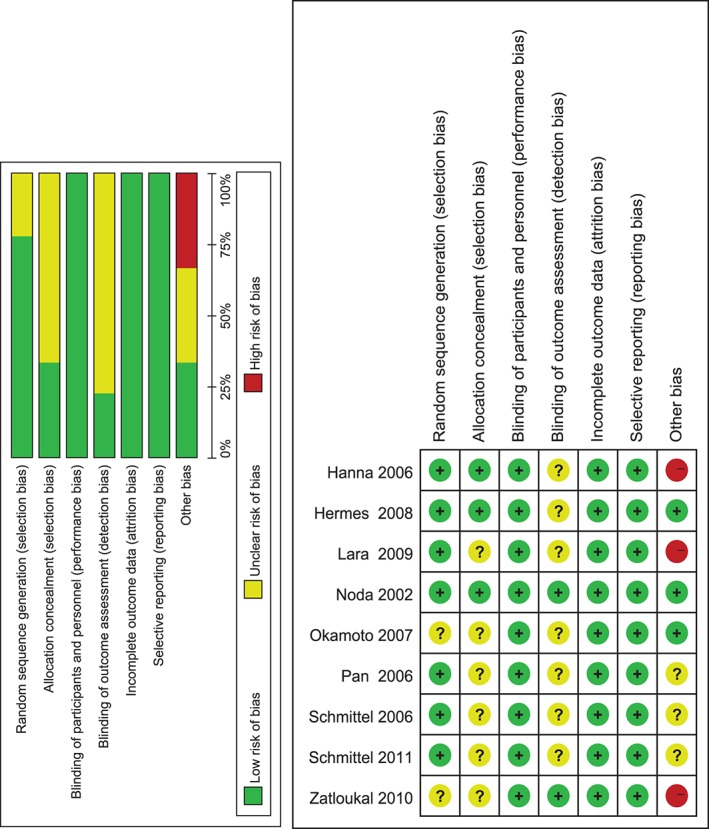
Risk of bias summary and graph.
Hematological toxicities
Anemia
The four front‐line chemotherapy‐related incidences of grade 3 and 4 anemia were reported in the nine trials with 2305 participants (Fig 3). As shown in Figure 4, etoposide with carboplatin (EC) is associated with the highest incidence, while irinotecan with cisplatin (IP) resulted in the lowest rate. Among these comparisons, the incidence of anemia was significantly higher in the EC group than in the IC group (OR 2.02, 95% CI 1.13–3.63). Patients who received an EP regimen were remarkably more likely to suffer anemia compared with those treated with an IP regimen (OR 1.70, 95% CI 1.13–2.56). The details of comparisons are listed in Table 2. The PrI result indicated no significant differences between any of the comparisons (Fig 5).
Figure 3.
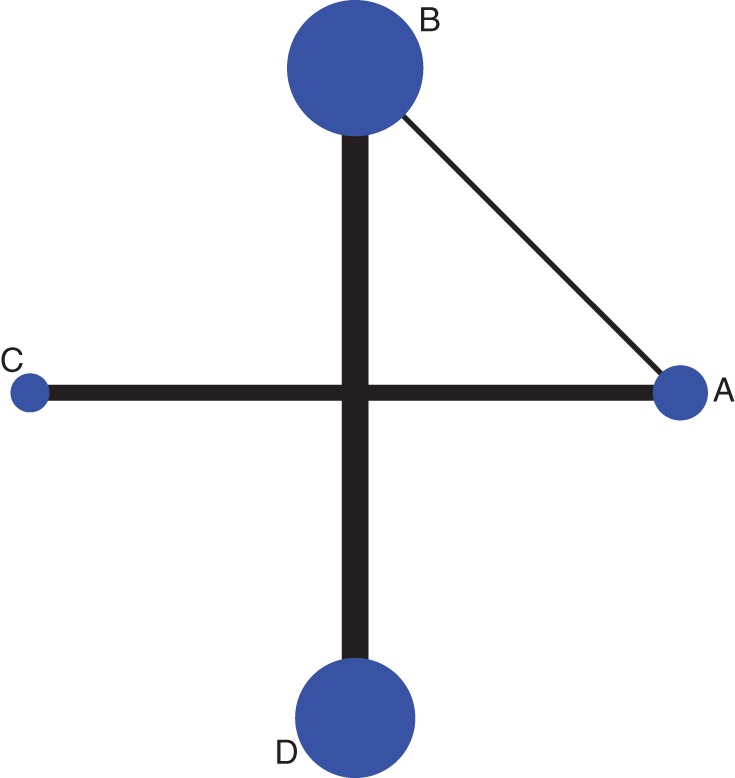
Network plot of anemia. A: Etoposide with carboplatin, B: etoposide combined cisplatin, C: irinotecan with carboplatin and D: irinotecan with cisplatin. The size of each dot represents the number of patients receiving the corresponding intervention. The width of each line represents the number of studies of corresponding comparison.
Figure 4.
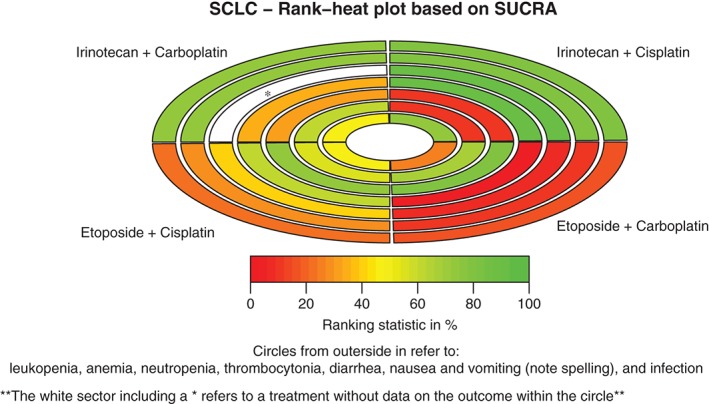
Rank‐heat plot of the four first‐line chemotherapy regimens for patients with extensive‐stage small‐cell lung cancer (SCLC) in seven outcomes. Each sector is colored according to the surface under the cumulative ranking (SUCRA) value of the corresponding treatment and outcome. The scale consists of the transformation of three colors: red (0%), yellow (50%), and green (100%), and each color is associated with a different pattern. Uncolored sectors show that the underlying treatment was not included in the network meta‐analyses for the particular outcome.
Table 2.
The direct and indirect results of anemia
| EC | |||
| 1.26 (0.61,2.62) | EP | ||
| 2.02 (1.13,3.63) | 1.60 (0.63,4.09) | IC | |
| 2.14 (0.93,4.95) | 1.70 (1.13,2.56) | 1.06 (0.38,2.94) | IP |
EC, etoposide with carboplatin; EP, etoposide with cisplatin; IC, irinotecan with carboplatin; IP, irinotecan combined cisplatin.
Indirect results are shown in italics.
Figure 5.
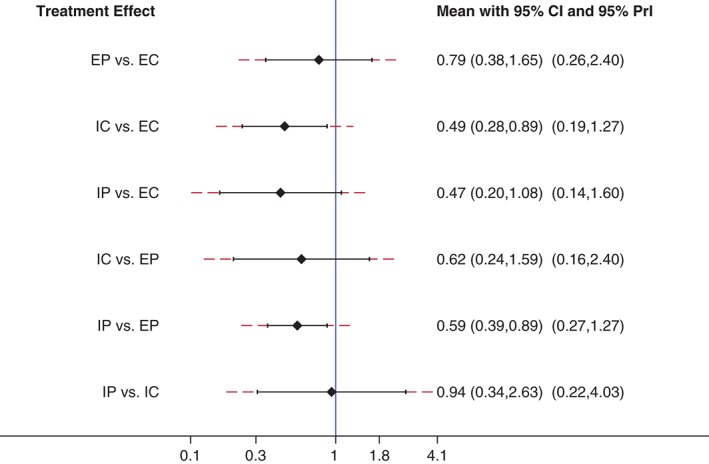
Forest plot of the network meta‐analyses with corresponding 95% confidence intervals (CIs) and 95% predictive intervals for anemia. EC, etoposide with carboplatin; EP: etoposide with cisplatin; IC: irinotecan with carboplatin; IP: irinotecan with cisplatin.
Leukopenia
Incidences of grade 3 or higher leukopenia during the four primary platinum‐based chemotherapies for the treatment of ED‐SCLC were reported in eight trials, including 1983 patients. As demonstrated in Figure 4, EC was associated with the highest incidence, while IP resulted in the lowest rate. Among these comparisons, the incidence of leukopenia was significantly higher in the EC than in the IC group (OR 2.67, 95% CI 1.25–5.72). Patients who received an EP regimen were remarkably more likely to suffer leukopenia compared with those treated with an IP regimen (OR 2.65, 95% CI 1.34–5.28). The PrI result indicated no significant differences between any of the comparisons.
Neutropenia
Only three front‐line chemotherapy regimens (EC, EP, and IP) administered to 1813 patients with ED‐SCLC in six studies were associated with the incidence of grade 3 or higher neutropenia. Based on the results shown in Figure 4, EC was associated with the highest incidence, while IP resulted in the lowest rate. Among these comparisons, the incidence of neutropenia was significantly higher in the EC than in the IP group (OR 12.08, 95% CI 2.13–68.66). Patients who received an EP regimen were remarkably more likely to suffer neutropenia compared with those treated with an IP regimen (OR 5.70, 95% CI 2.93–11.10). IC related comparisons were not available, as none of the studies that contained IC as an intervention reported any incidence of neutropenia. The PrI result indicated no significant differences between any of the comparisons.
Thrombocytopenia
Incidences of grade 3 and 4 thrombocytopenia from the four front‐line chemotherapies were reported in a total of nine trials with 2305 participants. As shown in Figure 4, EC is associated with the highest incidence, while IP resulted in the lowest rate. Among these comparisons, the incidence of thrombocytopenia was significantly higher in the EC than in the EP (OR 6.81, 95% CI 1.97–23.51), IC (OR 2.73, 95% CI 1.27–5.85), or IP groups (OR 22.17, 95% CI 5.41–90.83). Patients who received an EP regimen were remarkably more likely to suffer thrombocytopenia compared with those treated with an IP regimen (OR 3.26, 95% CI 1.66–6.38). The incidence of thrombocytopenia in the IC group also significantly outnumbered that of the IP group (OR 8.13, 95% CI 1.64–40.34). The PrI results indicated there were no significant differences between the comparisons, except for the EC versus the IP group.
Non‐hematological toxicities
Diarrhea
Nine trials with 2305 participants reported incidences of grade 3 or higher diarrhea caused by the four front‐line chemotherapies. As demonstrated in Figure 4, IP is associated with the highest incidence, while EP and EC reported the lowest rates. Among these comparisons, incidences of diarrhea were significantly less frequent in the EP than in the IP group (OR 0.09, 95% CI 0.03–0.25). Patients who received an EC regimen experienced remarkably lower rates of diarrhea compared with those treated with an IC regimen (OR 0.26, 95% CI 0.10–0.68). The PrI result indicated no significant differences between the comparisons, except for the EP versus the IP group.
Infection
Six trials with 1633 participants reported incidences of grade 3 and 4 infection associated with all four of the front‐line chemotherapies. As demonstrated in Figure 4, EC is associated with the highest incidence, while IP demonstrated the lowest rate. None of these comparisons were statistically significant regarding the incidence of infection. The PrI results indicated no significant differences between any of the comparisons.
Nausea and vomiting
Incidences of grade 3 or higher nausea and vomiting during the four primary platinum‐based chemotherapies for the treatment of ED‐SCLC were reported in eight trials including 2099 patients. As shown in Figure 4, IP was associated with the highest incidence, while EC resulted in the lowest rate. Among these comparisons, the incidence of nausea and vomiting was significantly lower in the EP compared with the IP group (OR 0.53, 95% CI 0.33–0.84). The PrI result indicated no significant differences between any of the comparisons.
Sensitivity analysis and between‐study variances
The results of sensitivity analyses were similar to the previous results. There was no significant heterogeneity between studies.
Discussion
Summary of the results
Our network meta‐analysis reveals the different toxicity profiles of the four front‐line chemotherapy regimens for the treatment of patients with ED‐SCLC. We provided each toxicity profile a ranking according to toxicity frequency. Both hematological and non‐hematological toxicities were evaluated. Some grade 3/4 toxicities, such as renal and hepatic dysfunction, were not included because their rare occurrence meant there was inadequate data for comparison. Comparisons between adverse effects, such as fatigue, dehydration, hypertension, anorexia, dyspnea and multiple therapies were also not performed, as these effects were only reported in three studies. Among the four platinum‐based front‐line chemotherapy regimens, hematological toxicities were the most common in EC‐treated patients, while IP was associated with the lowest incidence. In contrast, the incidence of non‐hematological toxicities, especially for the incidence of toxicities of the digestive tract (such as diarrhea, and nausea and vomiting), was the highest with the IP regimen and lowest with the EC regimen. No significant differences regarding infection were found between these regimens.
Comparison with previous studies
Our results are compatible with previous traditional pairwise meta‐analyses, in which hematological adverse effects occurred less frequently with IP treatment, while non‐hematological toxicities (e.g. diarrhea), were more likely with an EP regimen.6, 8 Additionally, in one study, patients who received etoposide‐based chemotherapy were less susceptible to diarrhea, but tended to suffer severe hematological toxicities compared with irinotecan‐based chemotherapy.7 Furthermore, Jiang et al. also reported that some hematological toxicities, such as thrombocytopenia, were more common in patients who received EC compared with those who received EP. However, none of these studies provided an exact rank of the safety of the four regimens for each adverse effect. According to our results, IP is the safest regimen in respect to hematological toxicities. The comparatively minimal myelosuppression of an IP regimen reasonably explained the lowest occurrence rate of infection; however, the incidence rate of serious side effects of the digestive tract is highest with IP. Etoposide is related to a significantly higher incidence of hematological toxicities compared with irinotecan when both are combined with platinum. The incidence of hematological toxicities is more likely to be higher in patients treated with carboplatin than in those treated with cisplatin.
Limitations
Initially, our network meta‐analyses included more studies and patients compared with previous pairwise meta‐analyses (Lima 2010: 6 studies with 1619 patients; Jiang 2012: 7 studies with 1872 patients; Shao 2012; 7 studies with 2027 patients), thus, the relatively limited sample size finally used might affect the precision of the results. In addition, we could not evaluate the inconsistency of the network because there were no loops in our study and we could not assess publication bias because of the limited number of studies included. These methodological flaws might influence the robustness of the results. Evaluation of other important toxicities, such as febrile neutropenia, drug‐related death, and dehydration, were not feasible because of a lack of reported data. Finally, the different follow‐up durations, variations in dosage, premedication, racial differences, and genetic variations between the comparisons could not be adjusted because of the absence of data, which also restrict the application of the results.
Among the four platinum based front‐line chemotherapy regimens, hematological toxicities were the most common in EC‐treated patients, while IP were associated with the lowest incidence. The incidence of toxicities of the digestive tract (such as diarrhea, and nausea and vomiting), was the highest for the IP regimen, and lowest for the EC regimen. No significant differences regarding infection were found between these regimens.
Disclosure
No authors report any conflict of interest.
Acknowledgments
The authors wish to thank Areti Angeliki Veroniki for input into the rank‐heat plot and for providing feedback on the paper. We also wish to thank Andrea C. Tricco for completing the rank‐heat plot.
References
- 1. Lara PN Jr, Gandara DR, Natale RB. Randomized phase III trial of cisplatin/irinotecan versus cisplatin/etoposide in patients with extensive‐stage small‐cell lung cancer. Clin Lung Cancer 2006; 7: 353–6. [DOI] [PubMed] [Google Scholar]
- 2. Varghese AM, Zakowski MF, Yu HA et al. Small‐cell lung cancers in patients who never smoked cigarettes. J Thorac Oncol 2014; 9: 892–6. [DOI] [PMC free article] [PubMed] [Google Scholar]
- 3. National Comprehensive Cancer Network . Small Cell Lung Cancer [Cited 18 Jul 2014.] Available from URL: http://www.nccn.org/professionals/physician_gls/pdf/sclc.pdf
- 4. Ettinger DS, Aisner J. Changing face of small‐cell lung cancer: Real and artifact. J Clin Oncol 2006; 24: 4526–7. [DOI] [PubMed] [Google Scholar]
- 5. van Meerbeeck JP, Fennell DA, De Ruysscher DKM. Small‐cell lung cancer. Lancet 2011; 378: 1741–55. [DOI] [PubMed] [Google Scholar]
- 6. Jiang L, Yang KH, Guan QL, Mi DH, Wang J. Cisplatin plus etoposide versus other platin‐based regimens for patients with extensive small‐cell lung cancer: A systematic review and meta‐analysis of randomised, controlled trials. Intern Med J 2012; 42: 1297–309. [DOI] [PubMed] [Google Scholar]
- 7. Lima JP, dos Santos LV, Sasse EC, Lima CS, Sasse AD. Camptothecins compared with etoposide in combination with platinum analog in extensive stage small cell lung cancer: Systematic review with meta‐analysis. J Thorac Oncol 2010; 5: 1986–93. [DOI] [PubMed] [Google Scholar]
- 8. Shao N, Jin S, Zhu W. An updated meta‐analysis of randomized controlled trials comparing irinotecan/platinum with etoposide/platinum in patients with previously untreated extensive‐stage small cell lung cancer. J Thorac Oncol 2012; 7: 470–2. [DOI] [PubMed] [Google Scholar]
- 9. Li T, Puhan MA, Vedula SS, Singh S, Dickersin K, AD Hoc Network Meta‐analysis Methods Meeting Working Group . Network meta‐analysis‐highly attractive but more methodological research is needed. BMC Med 2011; 9: 79. [DOI] [PMC free article] [PubMed] [Google Scholar]
- 10. Bakalos G, Miligkos M, Doxani C, Mpoulimari I, Rodopoulou P, Zintzaras E. Assessing the relative effectiveness and tolerability of treatments in small cell lung cancer: A network meta‐analysis. Cancer Epidemiol 2013; 37: 675–82. [DOI] [PubMed] [Google Scholar]
- 11. Salanti G, Higgins JP, Ades AE, Ioannidis JP. Evaluation of networks of randomized trials. Stat Methods Med Res 2008; 17: 279–301. [DOI] [PubMed] [Google Scholar]
- 12. Higgins JP, Thompson SG. Quantifying heterogeneity in a meta‐analysis. Stat Med 2002; 21: 1539–58. [DOI] [PubMed] [Google Scholar]
- 13. White IR. Multivariate random‐effects meta‐analysis. Stata J 2009; 9: 40–56. [Google Scholar]
- 14. Dias S, Welton NJ, Sutton AJ, Caldwell DM, Lu G, Ades AE. NICE Decision Support Unit Technical Support Document No. 4. Inconsistency in Networks of Evidence Based on Randomised Controlled Trials. London: National Institute for Health and Care Excellence 2014. [PubMed]
- 15. Veroniki AA, Jackson D, Viechtbauer W et al. Methods to estimate the between‐study variance and its uncertainty in meta‐analysis. Res Synth Methods 2016; 7: 55–79. [DOI] [PMC free article] [PubMed] [Google Scholar]
- 16. Dias S, Sutton AJ, Welton NJ, Ades AE. Evidence synthesis for decision making 3: Heterogeneity‐‐subgroups, meta‐regression, bias, and bias‐adjustment. Med Decis Making 2013; 33: 618–40. [DOI] [PMC free article] [PubMed] [Google Scholar]
- 17. Riley RD, Higgins JP, Deeks JJ. Interpretation of random effects meta‐analyses. BMJ 2011; 342: d549. [DOI] [PubMed] [Google Scholar]
- 18. Veroniki AA, Straus SE, Fyraridis A, Tricco AC. The rank‐heat plot is a novel way to present the results from a network meta‐analysis including multiple outcomes. J Clin Epidemiol 2016; 76: 193–9. [DOI] [PubMed] [Google Scholar]
- 19. Hanna N, Bunn PA Jr, Langer C et al. Randomized phase III trial comparing irinotecan/cisplatin with etoposide/cisplatin in patients with previously untreated extensive‐stage disease small‐cell lung cancer. J Clin Oncol 2006; 24: 2038–43. [DOI] [PubMed] [Google Scholar]
- 20. Hermes A, Bergman B, Bremnes R et al. Irinotecan plus carboplatin versus oral etoposide plus carboplatin in extensive small‐cell lung cancer: A randomized phase III trial. J Clin Oncol 2008; 26: 4261–7. [DOI] [PubMed] [Google Scholar]
- 21. Lara PN Jr, Natale R, Crowley J et al. Phase III trial of irinotecan/cisplatin compared with etoposide/cisplatin in extensive‐stage small‐cell lung cancer: Clinical and pharmacogenomic results from SWOG S0124. J Clin Oncol 2009; 27: 2530–5. [DOI] [PMC free article] [PubMed] [Google Scholar]
- 22. Noda K, Nishiwaki Y, Kawahara M et al. Irinotecan plus cisplatin compared with etoposide plus cisplatin for extensive small‐cell lung cancer. N Engl J Med 2002; 346: 85–91. [DOI] [PubMed] [Google Scholar]
- 23. Okamoto H, Watanabe K, Kunikane H et al. Randomised phase III trial of carboplatin plus etoposide vs split doses of cisplatin plus etoposide in elderly or poor‐risk patients with extensive disease small‐cell lung cancer: JCOG 9702. Br J Cancer 2007; 97: 162–9. [DOI] [PMC free article] [PubMed] [Google Scholar]
- 24. Pan D, Hou M, Li H, Yu P, Liu J. Irinotecan plus cisplatin compared with etoposide plus cisplatin for small cell lung cancer: A randomized clinical trial. Zhongguo Fei Ai Za Zhi 2006; 9: 443–6. [DOI] [PubMed] [Google Scholar]
- 25. Schmittel A, Fischer von Weikersthal L, Sebastian M et al. A randomized phase II trial of irinotecan plus carboplatin versus etoposide plus carboplatin treatment in patients with extended disease small‐cell lung cancer. Ann Oncol 2006; 17: 663–7. [DOI] [PubMed] [Google Scholar]
- 26. Schmittel A, Sebastian M, Fischer von Weikersthal L et al. A German multicenter, randomized phase III trial comparing irinotecan‐carboplatin with etoposide‐carboplatin as first‐line therapy for extensive‐disease small‐cell lung cancer. Ann Oncol 2011; 22: 1798–804. [DOI] [PubMed] [Google Scholar]
- 27. Zatloukal P, Cardenal F, Szczesna A et al. A multicenter international randomized phase III study comparing cisplatin in combination with irinotecan or etoposide in previously untreated small‐cell lung cancer patients with extensive disease. Ann Oncol 2010; 21: 1810–6. [DOI] [PubMed] [Google Scholar]


