

Abstract
Background
DNA methylation is an important epigenetic mechanism involved in gene regulation, with alterations in DNA methylation in the nuclear genome being linked to numerous complex diseases. Mitochondrial DNA methylation is a phenomenon that is receiving ever-increasing interest, particularly in diseases characterized by mitochondrial dysfunction; however, most studies have been limited to the investigation of specific target regions. Analyses spanning the entire mitochondrial genome have been limited, potentially due to the amount of input DNA required. Further, mitochondrial genetic studies have been previously confounded by nuclear-mitochondrial pseudogenes. Methylated DNA Immunoprecipitation Sequencing is a technique widely used to profile DNA methylation across the nuclear genome; however, reads mapped to mitochondrial DNA are often discarded. Here, we have developed an approach to control for nuclear-mitochondrial pseudogenes within Methylated DNA Immunoprecipitation Sequencing data. We highlight the utility of this approach in identifying differences in mitochondrial DNA methylation across regions of the human brain and pre-mortem blood.
Results
We were able to correlate mitochondrial DNA methylation patterns between the cortex, cerebellum and blood. We identified 74 nominally significant differentially methylated regions (p < 0.05) in the mitochondrial genome, between anatomically separate cortical regions and the cerebellum in matched samples (N = 3 matched donors). Further analysis identified eight significant differentially methylated regions between the total cortex and cerebellum after correcting for multiple testing. Using unsupervised hierarchical clustering analysis of the mitochondrial DNA methylome, we were able to identify tissue-specific patterns of mitochondrial DNA methylation between blood, cerebellum and cortex.
Conclusions
Our study represents a comprehensive analysis of the mitochondrial methylome using pre-existing Methylated DNA Immunoprecipitation Sequencing data to identify brain region-specific patterns of mitochondrial DNA methylation.
Keywords: 5-mC, 5-Methylcytosine, Blood, Brain, DNA methylation, Epigenetics, MeDIP-seq, Mitochondria, NUMTs
Introduction
Mitochondria are unique organelles in that they have their own circular genome, approximately 16.6 kb in size [1]. Mitochondrial DNA (mtDNA) consists of 37 genes, 22 encoding for transfer RNAs (tRNAs), two for ribosomal RNAs (rRNAs) and 13 encoding for proteins important in the electron transport chain. Each of these 13 proteins are directly involved in the regulation of cellular respiration, generating the majority of ATP required for the process. However, mitochondria have an array of other important cellular roles such as calcium homeostasis [2] and neural stem cell differentiation [3]. As such, abnormal mitochondrial function, dynamics and trafficking have been associated with a number of brain disorders including Alzheimer’s disease [4, 5], schizophrenia [6], bipolar disorder [7] and major depressive disorder [8].
Epigenetic processes mediate the reversible regulation of gene expression, occurring independently of DNA sequence variation, acting principally through chemical modifications to DNA and nucleosomal histone proteins and orchestrate a diverse range of important physiological functions. DNA methylation is the best characterized and most stable epigenetic modification modulating the transcription of mammalian genomes and, because it can be robustly assessed using existing genomic DNA resources, is the focus of most human epidemiological epigenetic research to date [9]. The most widely used method for epigenome-wide analysis of DNA methylation is the Illumina 450K methylation array, and a number of studies have recently shown differential DNA methylation of the nuclear genome (ncDNA), between different tissue types [10–12] and also in a range of complex diseases, from brain disorders such as Alzheimer’s disease [13–15] and schizophrenia [16, 17], to systemic diseases such as type 2 diabetes [18] and Crohn’s disease [19]. However, with no representation of the mitochondrial genome on this platform, as well as a lack of analysis on other genome-wide platforms, the role of mtDNA methylation has been largely neglected [20, 21].
Since the identification of 5-methylcytosine (5-mC) in mitochondria, research into mtDNA methylation as an independent and potentially relevant mark has received more regular attention [22, 23]. However, most research is either focussed on low resolution, global DNA methylation, or candidate gene DNA methylation changes using techniques such as bisulfite pyrosequencing [20]. These recent publications have indicated that differences in mtDNA methylation are present in a variety of different phenotypes [24–29] and may have potential utility as a biomarker [30]. In addition, a recent study has explored the use of Methylated DNA Immunoprecipitation Sequencing (MeDIP-seq) to investigate changes in mtDNA methylation across 39 cell lines and tissues from publicly available data [31]. At present, genome-wide sequencing technologies have not yet been used to interrogate alterations in the mtDNA methylome across tissues in the same individuals.
A high proportion of current, publicly available, genome-wide DNA methylation data has been generated through the use of MeDIP-seq, a method designed to interrogate genome-wide changes in methylation at high throughput and low cost [32]. However, given the presence of nuclear-mitochondrial pseudogenes (NUMTs), regions of the nuclear genome that share a high sequence homology with their mitochondrial paralogue [33, 34], mitochondrial reads are often discarded from further analysis. The development of bioinformatic pipelines to investigate regions of differential mtDNA methylation from whole genome data would provide a novel way in which to interrogate the mtDNA methylome in publicly available data. Here, we control for the presence of NUMTs in a previously published MeDIP-seq dataset, to investigate differential DNA methylation across the mitochondrial genome in human post-mortem brain samples.
Results
MtDNA methylation patterns are correlated between the cortex, cerebellum and blood
To date, no study has investigated differences in mtDNA methylation across different matched regions of human brain and blood samples. Our sample (Table 1) consisted of MeDIP-seq data from three individuals, free of any neuropathology and neuropsychiatric disease, for five different regions of the cortex (Brodmann areas (BA) 8, 9 and 10, superior temporal gyrus (STG) and entorhinal cortex (ECX)), the cerebellum (CER) and pre-mortem blood [35]. Given that MeDIP-seq data has been generated from standardly extracted total genomic DNA and thus contains a mixture of ncDNA and mtDNA [36], we initially controlled for regions of high sequence homology between the two genomes within our data by realigning mtDNA reads to a series of custom reference genomes using an in-house pipeline (see the Methods section) to specifically analyze mtDNA methylation (Fig. 1). Briefly, after an initial alignment to the GRCH37 reference genome using BWA, uniquely mapped reads were extracted and aligned to a custom GRCH37 reference genome not containing the mitochondrial sequence. Reads that did not map to this custom genome were found to share less homology with the nuclear genome and were taken forward and realigned once more to the full reference genome. Initially, we were interested to investigate whether changes in mtDNA across the mitochondrial genome were highly correlated between different tissue types. Using principal component analysis (PCA), we found that mtDNA methylation patterns are highly correlated between different cortical regions (r > 0.99, p < 2.2E−16), with a slightly weaker correlation between the cerebellum and cortex (r > 0.97, p < 2.2E−16) (Fig. 2). Due to the small number of blood samples available, deriving a significance level for the correlations between the cerebellum and blood could not be made. Instead, in an attempt to explore the similarity between matched blood and cerebellum samples, the direction of differential methylation with respect to the cortex was used. Here, we found that 93.1% of the windows analyzed in the cerebellum and blood had the same direction of methylation difference with respect to the cortex, further suggesting a strong correlation between the two tissue types.
Table 1.
Demographic information
| Individual | Age at death (years) | Age at bloods sampled (years) | Post-mortem delay (hours) | Gender |
|---|---|---|---|---|
| 1 | 82 | 79 | 43 | Female |
| 2 | 92 | N/A | 17 | Female |
| 3 | 78 | 78 | 10 | Male |
MeDIP-seq data was available from post-mortem brain samples obtained from three individuals free of any neuropathology and neuropsychiatric disease. Data was available for five different regions of the cortex (Brodmann areas (BA) 8, 9 and 10, superior temporal gyrus (STG), entorhinal cortex (ECX), the cerebellum (CER) and pre-mortem blood (BLD). MeDIP-seq data was available for all individuals from cortical and cerebellar samples; however, blood MeDIP-seq data was not available for individual 2. Data is freely available to download from http://epigenetics.iop.kcl.ac.uk/brain
Fig. 1.
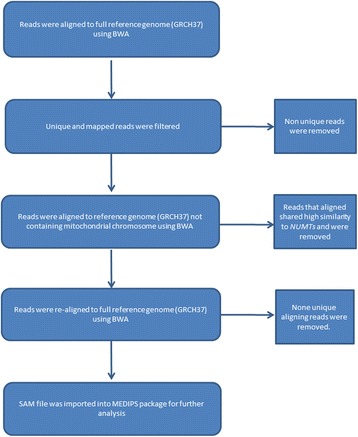
Overview of the analysis pipeline
Fig. 2.
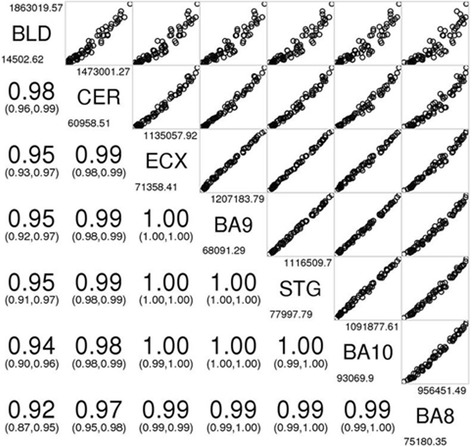
MtDNA methylation patterns are correlated between the cortex, cerebellum and blood. Samples were ordered based upon the similarity of their principal components, RPKM values, with r calculated for the correlations between each tissue. BLD blood, BA8 Brodmann area 8, BA9 Brodmann area 9, BA10 Brodmann area 10, CER cerebellum, CTX cortex, ECX entorhinal cortex, STG superior temporal gyrus
Differentially methylated regions of the mitochondrial genome can be identified between anatomically distinct cortical regions and the cerebellum
Having identified correlated mtDNA methylation patterns across different brain regions, we were interested to investigate whether we could identify differentially methylated regions (DMRs) in the mitochondrial genome between different regions of the cortex and cerebellum. To identify such tissue-specific DMRs within the mitochondrial genome, paired t tests were performed across matched cortical and cerebellum samples at 100 bp windows across the mitochondrial genome (see the Methods section). In total, we identified 74 nominally significant DMRs (p < 0.05) between the five individual cortical regions and the cerebellum (Table 2; Fig. 3). Of these DMRs, seven (Table 2, bold face) were found to be present across all prefrontal cortex areas (BA8, BA9, BA10). Furthermore, the direction of methylation difference was maintained in all Brodmann area regions, with three conserved regions of hypomethylation and four conserved regions of hypermethylation, with respect to the cerebellum. Furthermore, four of the seven conserved regions were adjacent to each other within the mitochondrial displacement loop (D-Loop) (16201–16600 bp), a region associated with gene transcription and DNA replication.
Table 2.
List of DMRs identified between five anatomically discreet cortical regions and cerebellum
| Start (bp) | Stop (bp) | Gene(s) | BA8 | BA9 | BA10 | EC | STG | |||||
|---|---|---|---|---|---|---|---|---|---|---|---|---|
| p value | Δ RPKM | p value | Δ RPKM | p value | Δ RPKM | p value | Δ RPKM | p value | Δ RPKM | |||
| 1 | 100 | D-Loop | - | - | - | - | - | - | - | - | - | - |
| 101 | 200 | D-Loop | - | - | - | - | - | - | - | - | - | - |
| 201 | 300 | D-Loop | - | - | - | - | - | - | - | - | - | - |
| 301 | 400 | D-Loop | - | - | - | - | - | - | - | - | - | - |
| 401 | 500 | D-Loop | - | - | - | - | - | - | - | - | - | - |
| 501 | 600 | MT-TF | - | - | - | - | - | - | - | - | - | - |
| 601 | 700 | MT-TF/MT-RNR1 | - | - | - | - | - | - | - | - | - | - |
| 701 | 800 | MT-RNR1 | - | - | - | - | - | - | 3.21E−02 | 79156 | - | - |
| 801 | 900 | MT-RNR1 | 4.31E−02 | 94246 | 2.93E−02 | −43592 | - | - | - | - | 1.79E−02 | 95257 |
| 901 | 1000 | MT-RNR1 | ND | ND | ND | ND | ND | ND | ND | ND | ND | ND |
| 1001 | 1100 | MT-RNR1 | ND | ND | ND | ND | ND | ND | ND | ND | ND | ND |
| 1101 | 1200 | MT-RNR1 | ND | ND | ND | ND | ND | ND | ND | ND | ND | ND |
| 1201 | 1300 | MT-RNR1 | ND | ND | ND | ND | ND | ND | ND | ND | ND | ND |
| 1301 | 1400 | MT-RNR1 | ND | ND | ND | ND | ND | ND | ND | ND | ND | ND |
| 1401 | 1500 | MT-RNR1 | ND | ND | ND | ND | ND | ND | ND | ND | ND | ND |
| 1501 | 1600 | MT-RNR1 | ND | ND | ND | ND | ND | ND | ND | ND | ND | ND |
| 1601 | 1700 | MT-RNR1/MT-TV/MT-RNR2 | ND | ND | ND | ND | ND | ND | ND | ND | ND | ND |
| 1701 | 1800 | MT-RNR2 | ND | ND | ND | ND | ND | ND | ND | ND | ND | ND |
| 1801 | 1900 | MT-RNR2 | ND | ND | ND | ND | ND | ND | ND | ND | ND | ND |
| 1901 | 2000 | MT-RNR2 | ND | ND | ND | ND | ND | ND | ND | ND | ND | ND |
| 2001 | 2100 | MT-RNR2 | ND | ND | ND | ND | ND | ND | ND | ND | ND | ND |
| 2101 | 2200 | MT-RNR2 | ND | ND | ND | ND | ND | ND | ND | ND | ND | ND |
| 2201 | 2300 | MT-RNR2 | ND | ND | ND | ND | ND | ND | ND | ND | ND | ND |
| 2301 | 2400 | MT-RNR2 | 2.54E−02 | −97351 | 3.20E−02 | −29509 | 4.31E−02 | −82048 | - | - | - | - |
| 2401 | 2500 | MT-RNR2 | 8.90E−03 | 70950 | - | - | - | - | - | - | - | - |
| 2501 | 2600 | MT-RNR2 | 3.30E−03 | 51937 | - | - | - | - | - | - | - | - |
| 2601 | 2700 | MT-RNR2 | ND | ND | ND | ND | ND | ND | ND | ND | ND | ND |
| 2701 | 2800 | MT-RNR2 | ND | ND | ND | ND | ND | ND | ND | ND | ND | ND |
| 2801 | 2900 | MT-RNR2 | - | - | - | - | - | - | - | - | - | - |
| 2901 | 3000 | MT-RNR2 | - | - | - | - | - | - | - | - | - | - |
| 3001 | 3100 | MT-RNR2 | - | - | - | - | - | - | - | - | - | - |
| 3101 | 3200 | MT-RNR2 | ND | ND | ND | ND | ND | ND | ND | ND | ND | ND |
| 3201 | 3300 | MT-RNR2/MT-TL | - | - | - | - | - | - | 2.09E−02 | 242424 | - | - |
| 3301 | 3400 | MT-TL1/MT-ND1 | - | - | - | - | - | - | - | - | - | - |
| 3401 | 3500 | MT-ND1 | - | - | 1.54E−02 | 864685 | - | - | - | - | - | - |
| 3501 | 3600 | MT-ND1 | 4.41E−02 | 1180914 | - | - | 1.72E−02 | 226066 | - | - | - | - |
| 3601 | 3700 | MT-ND1 | 4.73E−02 | 1250436 | 4.52E−02 | 1228936 | 3.73E−02 | 1183681 | - | - | - | - |
| 3701 | 3800 | MT-ND1 | - | - | - | - | 2.16E−02 | 20818 | - | - | - | - |
| 3801 | 3900 | MT-ND1 | - | - | - | - | - | - | - | - | - | - |
| 3901 | 4000 | MT-ND1 | - | - | - | - | - | - | - | - | - | - |
| 4001 | 4100 | MT-ND1 | 2.41E−02 | −39498 | 1.55E−02 | −38704 | - | - | 4.68E−02 | −49753 | 1.56E−02 | 243767 |
| 4101 | 4200 | MT-ND1 | ND | ND | ND | ND | ND | ND | ND | ND | ND | ND |
| 4201 | 4300 | MT-ND1/MT-TI | ND | ND | ND | ND | ND | ND | ND | ND | ND | ND |
| 4301 | 4400 | MT-TI/MT-TQ | ND | ND | ND | ND | ND | ND | ND | ND | ND | ND |
| 4401 | 4500 | MT-TM/MT-ND2 | ND | ND | ND | ND | ND | ND | ND | ND | ND | ND |
| 4501 | 4600 | MT-ND2 | ND | ND | ND | ND | ND | ND | ND | ND | ND | ND |
| 4601 | 4700 | MT-ND2 | ND | ND | ND | ND | ND | ND | ND | ND | ND | ND |
| 4701 | 4800 | MT-ND2 | ND | ND | ND | ND | ND | ND | ND | ND | ND | ND |
| 4801 | 4900 | MT-ND2 | ND | ND | ND | ND | ND | ND | ND | ND | ND | ND |
| 4901 | 5000 | MT-ND2 | ND | ND | ND | ND | ND | ND | ND | ND | ND | ND |
| 5001 | 5100 | MT-ND2 | ND | ND | ND | ND | ND | ND | ND | ND | ND | ND |
| 5101 | 5200 | MT-ND2 | ND | ND | ND | ND | ND | ND | ND | ND | ND | ND |
| 5201 | 5300 | MT-ND2 | ND | ND | ND | ND | ND | ND | ND | ND | ND | ND |
| 5301 | 5400 | MT-ND2 | ND | ND | ND | ND | ND | ND | ND | ND | ND | ND |
| 5401 | 5500 | MT-ND2 | ND | ND | ND | ND | ND | ND | ND | ND | ND | ND |
| 5501 | 5600 | MT-ND2/MT-TW/MT-TA | ND | ND | ND | ND | ND | ND | ND | ND | ND | ND |
| 5601 | 5700 | MT-TA/MT-TN | ND | ND | ND | ND | ND | ND | ND | ND | ND | ND |
| 5701 | 5800 | MT-TN/MT-TC | ND | ND | ND | ND | ND | ND | ND | ND | ND | ND |
| 5801 | 5900 | MT-TC/MT-TY | ND | ND | ND | ND | ND | ND | ND | ND | ND | ND |
| 5901 | 6000 | MT-CO1 | ND | ND | ND | ND | ND | ND | ND | ND | ND | ND |
| 6001 | 6100 | MT-CO1 | ND | ND | ND | ND | ND | ND | ND | ND | ND | ND |
| 6101 | 6200 | MT-CO1 | ND | ND | ND | ND | ND | ND | ND | ND | ND | ND |
| 6201 | 6300 | MT-CO1 | ND | ND | ND | ND | ND | ND | ND | ND | ND | ND |
| 6301 | 6400 | MT-CO1 | ND | ND | ND | ND | ND | ND | ND | ND | ND | ND |
| 6401 | 6500 | MT-CO1 | ND | ND | ND | ND | ND | ND | ND | ND | ND | ND |
| 6501 | 6600 | MT-CO1 | ND | ND | ND | ND | ND | ND | ND | ND | ND | ND |
| 6601 | 6700 | MT-CO1 | ND | ND | ND | ND | ND | ND | ND | ND | ND | ND |
| 6701 | 6800 | MT-CO1 | ND | ND | ND | ND | ND | ND | ND | ND | ND | ND |
| 6801 | 6900 | MT-CO1 | ND | ND | ND | ND | ND | ND | ND | ND | ND | ND |
| 6901 | 7000 | MT-CO1 | ND | ND | ND | ND | ND | ND | ND | ND | ND | ND |
| 7001 | 7100 | MT-CO1 | ND | ND | ND | ND | ND | ND | ND | ND | ND | ND |
| 7101 | 7200 | MT-CO1 | ND | ND | ND | ND | ND | ND | ND | ND | ND | ND |
| 7201 | 7300 | MT-CO1 | ND | ND | ND | ND | ND | ND | ND | ND | ND | ND |
| 7301 | 7400 | MT-CO1 | ND | ND | ND | ND | ND | ND | ND | ND | ND | ND |
| 7401 | 7500 | MT-CO1/MT-TS1 | ND | ND | ND | ND | ND | ND | ND | ND | ND | ND |
| 7501 | 7600 | MT-TS1/MT-TD/MT-CO2 | ND | ND | ND | ND | ND | ND | ND | ND | ND | ND |
| 7601 | 7700 | MT-CO2 | ND | ND | ND | ND | ND | ND | ND | ND | ND | ND |
| 7701 | 7800 | MT-CO2 | ND | ND | ND | ND | ND | ND | ND | ND | ND | ND |
| 7801 | 7900 | MT-CO2 | ND | ND | ND | ND | ND | ND | ND | ND | ND | ND |
| 7901 | 8000 | MT-CO2 | ND | ND | ND | ND | ND | ND | ND | ND | ND | ND |
| 8001 | 8100 | MT-CO2 | ND | ND | ND | ND | ND | ND | ND | ND | ND | ND |
| 8101 | 8200 | MT-CO2 | ND | ND | ND | ND | ND | ND | ND | ND | ND | ND |
| 8201 | 8300 | MT-CO2/MT-TK | ND | ND | ND | ND | ND | ND | ND | ND | ND | ND |
| 8301 | 8400 | MT-TK/MT-ATP8 | ND | ND | ND | ND | ND | ND | ND | ND | ND | ND |
| 8401 | 8500 | MT-ATP8 | ND | ND | ND | ND | ND | ND | ND | ND | ND | ND |
| 8501 | 8600 | MT-ATP8/MT-ATP6 | ND | ND | ND | ND | ND | ND | ND | ND | ND | ND |
| 8601 | 8700 | MT-ATP6 | ND | ND | ND | ND | ND | ND | ND | ND | ND | ND |
| 8701 | 8800 | MT-ATP6 | ND | ND | ND | ND | ND | ND | ND | ND | ND | ND |
| 8801 | 8900 | MT-ATP6 | ND | ND | ND | ND | ND | ND | ND | ND | ND | ND |
| 8901 | 9000 | MT-ATP6 | ND | ND | ND | ND | ND | ND | ND | ND | ND | ND |
| 9001 | 9100 | MT-ATP6 | ND | ND | ND | ND | ND | ND | ND | ND | ND | ND |
| 9101 | 9200 | MT-ATP6 | ND | ND | ND | ND | ND | ND | ND | ND | ND | ND |
| 9201 | 9300 | MT-ATP6/MT-CO3 | ND | ND | ND | ND | ND | ND | ND | ND | ND | ND |
| 9301 | 9400 | MT-CO3 | ND | ND | ND | ND | ND | ND | ND | ND | ND | ND |
| 9401 | 9500 | MT-CO3 | ND | ND | ND | ND | ND | ND | ND | ND | ND | ND |
| 9501 | 9600 | MT-CO3 | ND | ND | ND | ND | ND | ND | ND | ND | ND | ND |
| 9601 | 9700 | MT-CO3 | ND | ND | ND | ND | ND | ND | ND | ND | ND | ND |
| 9701 | 9800 | MT-CO3 | ND | ND | ND | ND | ND | ND | ND | ND | ND | ND |
| 9801 | 9900 | MT-CO3 | - | - | - | - | - | - | - | - | - | - |
| 9901 | 10000 | MT-CO3/MT-TG | - | - | - | - | - | - | - | - | - | - |
| 10001 | 10100 | MT-TG/MT-ND3 | - | - | - | - | - | - | - | - | - | - |
| 10101 | 10200 | MT-ND3 | - | - | - | - | - | - | - | - | - | - |
| 10201 | 10300 | MT-ND3 | 4.68E−02 | −662126 | - | - | - | - | 3.14E−02 | −591067 | 7.30E−03 | −57012 |
| 10301 | 10400 | MT-ND3/MT-TR/MT-ND4L | 3.61E−02 | −132719 | 3.61E−02 | −135759 | 4.02E−02 | −115364 | 1.40E−02 | −73063 | 3.36E−02 | −105106 |
| 10401 | 10500 | MT-ND4L | - | - | 4.68E−02 | −71246 | - | - | - | - | - | - |
| 10501 | 10600 | MT-ND4L | - | - | - | - | - | - | - | - | - | - |
| 10601 | 10700 | MT-ND4L | ND | ND | ND | ND | ND | ND | ND | ND | ND | ND |
| 10701 | 10800 | MT-ND4L/MT-ND4 | ND | ND | ND | ND | ND | ND | ND | ND | ND | ND |
| 10801 | 10900 | MT-ND4 | ND | ND | ND | ND | ND | ND | ND | ND | ND | ND |
| 10901 | 11000 | MT-ND4 | ND | ND | ND | ND | ND | ND | ND | ND | ND | ND |
| 11001 | 11100 | MT-ND4 | ND | ND | ND | ND | ND | ND | ND | ND | ND | ND |
| 11101 | 11200 | MT-ND4 | ND | ND | ND | ND | ND | ND | ND | ND | ND | ND |
| 11201 | 11300 | MT-ND4 | - | - | 1.94E−02 | −68903 | 1.84E−02 | −79625 | 4.71E−02 | 58742 | - | - |
| 11301 | 11400 | MT-ND4 | - | - | 4.78E−02 | −139847 | - | - | - | - | - | - |
| 11401 | 11500 | MT-ND4 | ND | ND | ND | ND | ND | ND | ND | ND | ND | ND |
| 11501 | 11600 | MT-ND4 | ND | ND | ND | ND | ND | ND | ND | ND | ND | ND |
| 11601 | 11700 | MT-ND4 | ND | ND | ND | ND | ND | ND | ND | ND | ND | ND |
| 11701 | 11800 | MT-ND4 | ND | ND | ND | ND | ND | ND | ND | ND | ND | ND |
| 11801 | 11900 | MT-ND4 | ND | ND | ND | ND | ND | ND | ND | ND | ND | ND |
| 11901 | 12000 | MT-ND4 | ND | ND | ND | ND | ND | ND | ND | ND | ND | ND |
| 12001 | 12100 | MT-ND4 | ND | ND | ND | ND | ND | ND | ND | ND | ND | ND |
| 12101 | 12200 | MT-ND4/MT-TH | ND | ND | ND | ND | ND | ND | ND | ND | ND | ND |
| 12201 | 12300 | MT-TS2/MT-TL2 | ND | ND | ND | ND | ND | ND | ND | ND | ND | ND |
| 12301 | 12400 | MT-TL2/MT-ND5 | 4.71E−02 | 1787 | - | −197592 | - | - | - | - | - | - |
| 12401 | 12500 | MT-ND5 | - | - | - | - | - | - | - | - | - | - |
| 12501 | 12600 | MT-ND5 | - | - | - | - | - | - | - | - | - | - |
| 12601 | 12700 | MT-ND5 | - | - | - | - | - | - | - | - | - | - |
| 12701 | 12800 | MT-ND5 | 2.05E−02 | −5702 | - | - | 4.58E−02 | −388706 | - | - | 4.36E−02 | −394978 |
| 12801 | 12900 | MT-ND5 | 2.26E−02 | −89668 | - | - | - | - | - | - | - | - |
| 12901 | 13000 | MT-ND5 | - | - | 3.10E−02 | −130016 | - | - | - | - | - | - |
| 13001 | 13100 | MT-ND5 | ND | ND | ND | ND | ND | ND | ND | ND | ND | ND |
| 13101 | 13200 | MT-ND5 | ND | ND | ND | ND | ND | ND | ND | ND | ND | ND |
| 13201 | 13300 | MT-ND5 | ND | ND | ND | ND | ND | ND | ND | ND | ND | ND |
| 13301 | 13400 | MT-ND5 | 1.48E−02 | −175917 | - | - | 9.80E−03 | −144949 | 3.40E−02 | −133694 | - | - |
| 13401 | 13500 | MT-ND5 | 3.64E−02 | −104010 | - | - | 3.40E−02 | −81264 | - | - | - | - |
| 13501 | 13600 | MT-ND5 | - | - | - | - | - | - | - | - | - | - |
| 13601 | 13700 | MT-ND5 | - | - | - | - | - | - | - | - | - | - |
| 13701 | 13800 | MT-ND5 | 1.31E−02 | −422610 | - | - | 1.20E−03 | 3714 | - | - | - | - |
| 13801 | 13900 | MT-ND5 | - | - | 3.72E−02 | 708761 | 2.59E−02 | 123249 | - | - | - | - |
| 13901 | 14000 | MT-ND5 | - | - | - | - | 2.17E−02 | −75118 | - | - | - | - |
| 14001 | 14100 | MT-ND5 | - | - | - | - | - | - | - | - | - | - |
| 14101 | 14200 | MT-ND5/MT-ND6 | - | - | - | - | - | - | - | - | 4.18E−02 | −534766 |
| 14201 | 14300 | MT-ND6 | - | - | - | - | - | - | - | - | - | - |
| 14301 | 14400 | MT-ND6 | - | - | - | - | - | - | - | - | - | - |
| 14401 | 14500 | MT-ND6 | - | - | - | - | - | - | - | - | - | - |
| 14501 | 14600 | MT-ND6 | - | - | - | - | - | - | - | - | 4.86E−02 | −82767 |
| 14601 | 14700 | MT-ND6/MT-TE | - | - | - | - | - | - | - | - | - | - |
| 14701 | 14800 | MT-TE/MT-CYB | - | - | - | - | - | - | - | - | - | - |
| 14801 | 14900 | MT-CYB | ND | ND | ND | ND | ND | ND | ND | ND | ND | ND |
| 14901 | 15000 | MT-CYB | ND | ND | ND | ND | ND | ND | ND | ND | ND | ND |
| 15001 | 15100 | MT-CYB | ND | ND | ND | ND | ND | ND | ND | ND | ND | ND |
| 15101 | 15200 | MT-CYB | - | - | - | - | - | - | - | - | - | - |
| 15201 | 15300 | MT-CYB | - | - | - | - | - | - | 1.20E−02 | 254183 | - | - |
| 15301 | 15400 | MT-CYB | - | - | - | - | - | - | - | - | - | - |
| 15401 | 15500 | MT-CYB | 4.38E−02 | 10628 | - | - | 2.10E−02 | −554527 | - | - | 3.28E−02 | −554225 |
| 15501 | 15600 | MT-CYB | 3.73E−02 | −671707 | - | - | 1.23E−02 | −685630 | 3.82E−02 | 9301 | 3.51E−02 | −695515 |
| 15601 | 15700 | MT-CYB | - | - | - | - | 4.33E−02 | −746270 | - | - | - | - |
| 15701 | 15800 | MT-CYB | - | - | - | - | - | - | - | - | - | - |
| 15801 | 15900 | MT-CYB/MT-TT | - | - | - | - | - | - | - | - | - | - |
| 15901 | 16000 | MT-TT/MT-TP | - | - | - | - | - | - | - | - | - | - |
| 16001 | 16100 | MT-TP | - | - | - | - | - | - | - | - | - | - |
| 16101 | 16200 | D-Loop | - | - | 3.40E−03 | 3014 | - | - | - | - | - | - |
| 16201 | 16300 | D-Loop | 4.64E−02 | 380407 | 2.50E−02 | 1117943 | 3.68E−02 | 296890 | - | - | - | - |
| 16301 | 16400 | D-Loop | 3.65E−02 | −941720 | 1.38E−02 | −112453 | 2.73E−02 | −177146 | - | - | - | - |
| 16401 | 16500 | D-Loop | 4.29E−02 | 444051 | 2.20E−02 | 1151402 | 1.68E−02 | 313156 | - | - | - | - |
| 16501 | 16600 | D-Loop | 3.71E−02 | 784572 | 2.10E−02 | 764994 | 2.46E−02 | 836662 | - | - | - | - |
Shown is the location of the DMR within the mitochondrial genome (ChrM) (based on GENCODE), the gene(s) residing within the 100 bp window, and p value from paired t tests between each of the five cortical regions: Brodmann areas 8, 9 and 10 (BA8, BA9, BA10), entorhinal cortex (ECX) and superior temporal gyrus (STG) compared to the cerebellum (CER). Results are displayed in order of genomic position. RPKM and corresponding p values are shown for windows if p < 0.05. Key: - denotes data not significant (p > 0.05); ND denotes not determined as the window was not included in analysis due to removal in NUMT pipeline. Results shown in bold represent those found to be present across all prefrontal cortex areas (BA8, BA9, BA10)
Fig. 3.
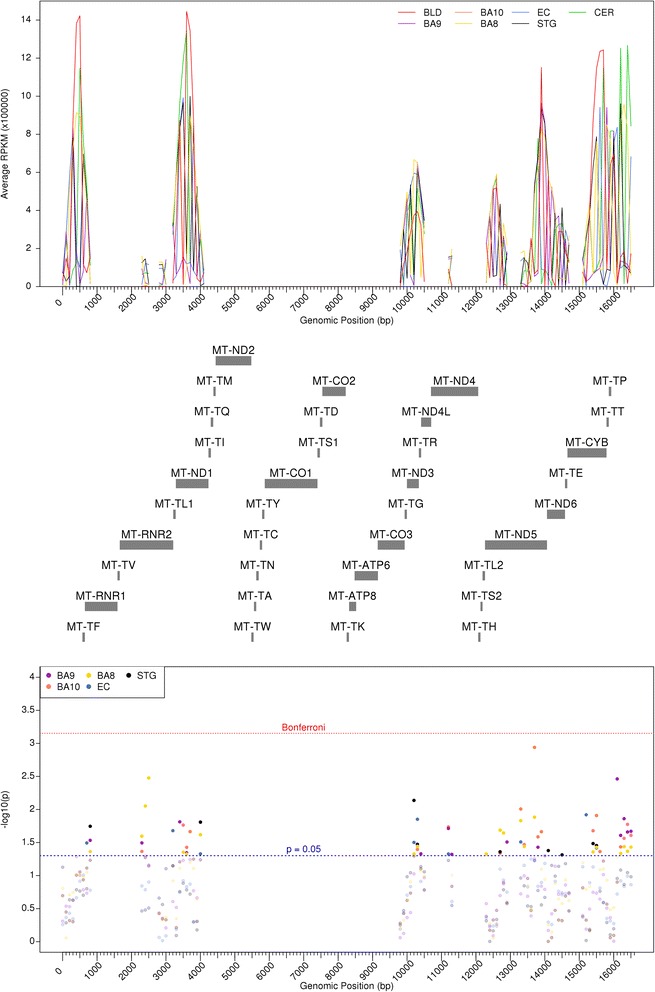
DNA methylation differences are seen in the mitochondrial genome between brain regions and blood. Average raw RPKM values across the mitochondrial genome for each individual cortical brain region alongside matched blood and cerebellum samples are shown in the top panel, with gene positions downloaded from GENCODE shown in the middle panel. For each 100 bp window, paired t tests were performed to compare each cortical brain region and the cerebellum, with -log10 (p) shown in the bottom panel. BLD blood, BA8 Brodmann area 8, BA9 Brodmann area 9, BA10 Brodmann area 10, CER cerebellum, CTX cortex, ECX entorhinal cortex, RPKM reads per kilobase of transcript per million mapped reads, STG superior temporal gyrus. Red dashed line denotes the Bonferroni significance, whilst blue dashed line denotes p < 0.05 in the lower panel
A number of differentially methylated regions in mtDNA can be observed between the cortex and cerebellum
We were also interested to see whether total cortical tissue was significantly different to matched cerebellum samples. Given the paired nature of the different anatomical regions of the cortex, we used a multilevel mixed effects model to compare total cortex to cerebellum (see the Methods section). This analysis revealed 48 nominally significant (p < 0.05) windows (Table 3; Fig. 4), of which eight passed the Bonferroni correction (Table 3, bold face). Interestingly, three of these eight were adjacent to each other, lying between 10301 and 10600 bp and covering MT-ND3/MT-ND4L and MT-TR. We also saw a Bonferroni significant difference in DNA methylation in the D-Loop, where we earlier noted DNA methylation changes across all three Brodmann area regions.
Table 3.
List of DMRs identified between total cortex and cerebellum
| Start (bp) | Stop (bp) | Gene(s) | p value |
|---|---|---|---|
| 1 | 100 | D-Loop | - |
| 101 | 200 | D-Loop | - |
| 201 | 300 | D-Loop | - |
| 301 | 400 | D-Loop | - |
| 401 | 500 | D-Loop | 7.99E−03 |
| 501 | 600 | MT-TF | 4.49E−03 |
| 601 | 700 | MT-TF/MT-RNR1 | 1.16E−02 |
| 701 | 800 | MT-RNR1 | 3.22E−03 |
| 801 | 900 | MT-RNR1 | 1.91E−04 |
| 901 | 1000 | MT-RNR1 | ND |
| 1001 | 1100 | MT-RNR1 | ND |
| 1101 | 1200 | MT-RNR1 | ND |
| 1201 | 1300 | MT-RNR1 | ND |
| 1301 | 1400 | MT-RNR1 | ND |
| 1401 | 1500 | MT-RNR1 | ND |
| 1501 | 1600 | MT-RNR1 | ND |
| 1601 | 1700 | MT-RNR1/MT-TV/MT-RNR2 | ND |
| 1701 | 1800 | MT-RNR2 | ND |
| 1801 | 1900 | MT-RNR2 | ND |
| 1901 | 2000 | MT-RNR2 | ND |
| 2001 | 2100 | MT-RNR2 | ND |
| 2101 | 2200 | MT-RNR2 | ND |
| 2201 | 2300 | MT-RNR2 | ND |
| 2301 | 2400 | MT-RNR2 | 8.10E−03 |
| 2401 | 2500 | MT-RNR2 | 7.50E−03 |
| 2501 | 2600 | MT-RNR2 | 5.14E−03 |
| 2601 | 2700 | MT-RNR2 | ND |
| 2701 | 2800 | MT-RNR2 | ND |
| 2801 | 2900 | MT-RNR2 | - |
| 2901 | 3000 | MT-RNR2 | - |
| 3001 | 3100 | MT-RNR2 | - |
| 3101 | 3200 | MT-RNR2 | - |
| 3201 | 3300 | MT-RNR2/MT-TL | 1.51E−03 |
| 3301 | 3400 | MT-TL1/MT-ND1 | - |
| 3401 | 3500 | MT-ND1 | 1.37E−02 |
| 3501 | 3600 | MT-ND1 | 4.27E−03 |
| 3601 | 3700 | MT-ND1 | 5.56E−03 |
| 3701 | 3800 | MT-ND1 | 8.21E−03 |
| 3801 | 3900 | MT-ND1 | - |
| 3901 | 4000 | MT-ND1 | - |
| 4001 | 4100 | MT-ND1 | 3.07E−06 |
| 4101 | 4200 | MT-ND1 | - |
| 4201 | 4300 | MT-ND1/MT-TI | ND |
| 4301 | 4400 | MT-TI/MT-TQ | ND |
| 4401 | 4500 | MT-TM/MT-ND2 | ND |
| 4501 | 4600 | MT-ND2 | ND |
| 4601 | 4700 | MT-ND2 | ND |
| 4701 | 4800 | MT-ND2 | ND |
| 4801 | 4900 | MT-ND2 | ND |
| 4901 | 5000 | MT-ND2 | ND |
| 5001 | 5100 | MT-ND2 | ND |
| 5101 | 5200 | MT-ND2 | ND |
| 5201 | 5300 | MT-ND2 | ND |
| 5301 | 5400 | MT-ND2 | ND |
| 5401 | 5500 | MT-ND2 | ND |
| 5501 | 5600 | MT-ND2/MT-TW/MT-TA | ND |
| 5601 | 5700 | MT-TA/MT-TN | ND |
| 5701 | 5800 | MT-TN/MT-TC | ND |
| 5801 | 5900 | MT-TC/MT-TY | ND |
| 5901 | 6000 | MT-CO1 | ND |
| 6001 | 6100 | MT-CO1 | ND |
| 6101 | 6200 | MT-CO1 | ND |
| 6201 | 6300 | MT-CO1 | ND |
| 6301 | 6400 | MT-CO1 | ND |
| 6401 | 6500 | MT-CO1 | ND |
| 6501 | 6600 | MT-CO1 | ND |
| 6601 | 6700 | MT-CO1 | ND |
| 6701 | 6800 | MT-CO1 | ND |
| 6801 | 6900 | MT-CO1 | ND |
| 6901 | 7000 | MT-CO1 | ND |
| 7001 | 7100 | MT-CO1 | ND |
| 7101 | 7200 | MT-CO1 | ND |
| 7201 | 7300 | MT-CO1 | ND |
| 7301 | 7400 | MT-CO1 | ND |
| 7401 | 7500 | MT-CO1/MT-TS1 | ND |
| 7501 | 7600 | MT-TS1/MT-TD/MT-CO2 | ND |
| 7601 | 7700 | MT-CO2 | ND |
| 7701 | 7800 | MT-CO2 | ND |
| 7801 | 7900 | MT-CO2 | ND |
| 7901 | 8000 | MT-CO2 | ND |
| 8001 | 8100 | MT-CO2 | ND |
| 8101 | 8200 | MT-CO2 | ND |
| 8201 | 8300 | MT-CO2/MT-TK | ND |
| 8301 | 8400 | MT-TK/MT-ATP8 | ND |
| 8401 | 8500 | MT-ATP8 | ND |
| 8501 | 8600 | MT-ATP8/MT-ATP6 | ND |
| 8601 | 8700 | MT-ATP6 | ND |
| 8701 | 8800 | MT-ATP6 | ND |
| 8801 | 8900 | MT-ATP6 | ND |
| 8901 | 9000 | MT-ATP6 | ND |
| 9001 | 9100 | MT-ATP6 | ND |
| 9101 | 9200 | MT-ATP6 | ND |
| 9201 | 9300 | MT-ATP6/MT-CO3 | ND |
| 9301 | 9400 | MT-CO3 | ND |
| 9401 | 9500 | MT-CO3 | ND |
| 9501 | 9600 | MT-CO3 | ND |
| 9601 | 9700 | MT-CO3 | ND |
| 9701 | 9800 | MT-CO3 | ND |
| 9801 | 9900 | MT-CO3 | - |
| 9901 | 10000 | MT-CO3/MT-TG | - |
| 10001 | 10100 | MT-TG/MT-ND3 | 1.81E−02 |
| 10101 | 10200 | MT-ND3 | 1.39E−02 |
| 10201 | 10300 | MT-ND3 | 3.53E−04 |
| 10301 | 10400 | MT-ND3/MT-TR/MT-ND4L | 1.19E−05 |
| 10401 | 10500 | MT-ND4L | 2.61E−04 |
| 10501 | 10600 | MT-ND4L | 9.05E−04 |
| 10601 | 10700 | MT-ND4L | ND |
| 10701 | 10800 | MT-ND4L/MT-ND4 | ND |
| 10801 | 10900 | MT-ND4 | ND |
| 10901 | 11000 | MT-ND4 | ND |
| 11001 | 11100 | MT-ND4 | ND |
| 11101 | 11200 | MT-ND4 | ND |
| 11201 | 11300 | MT-ND4 | 8.86E−05 |
| 11301 | 11400 | MT-ND4 | 1.65E−03 |
| 11401 | 11500 | MT-ND4 | ND |
| 11501 | 11600 | MT-ND4 | ND |
| 11601 | 11700 | MT-ND4 | ND |
| 11701 | 11800 | MT-ND4 | ND |
| 11801 | 11900 | MT-ND4 | ND |
| 11901 | 12000 | MT-ND4 | ND |
| 12001 | 12100 | MT-ND4 | ND |
| 12101 | 12200 | MT-ND4/MT-TH | ND |
| 12201 | 12300 | MT-TS2/MT-TL2 | ND |
| 12301 | 12400 | MT-TL2/MT-ND5 | - |
| 12401 | 12500 | MT-ND5 | - |
| 12501 | 12600 | MT-ND5 | - |
| 12601 | 12700 | MT-ND5 | - |
| 12701 | 12800 | MT-ND5 | 1.81E−03 |
| 12801 | 12900 | MT-ND5 | 1.05E−02 |
| 12901 | 13000 | MT-ND5 | 8.23E−03 |
| 13001 | 13100 | MT-ND5 | ND |
| 13101 | 13200 | MT-ND5 | ND |
| 13201 | 13300 | MT-ND5 | ND |
| 13301 | 13400 | MT-ND5 | 1.44E−03 |
| 13401 | 13500 | MT-ND5 | 9.13E−04 |
| 13501 | 13600 | MT-ND5 | 1.61E−02 |
| 13601 | 13700 | MT-ND5 | 3.89E−02 |
| 13701 | 13800 | MT-ND5 | 2.77E−04 |
| 13801 | 13900 | MT-ND5 | 2.80E−03 |
| 13901 | 14000 | MT-ND5 | 1.88E−02 |
| 14001 | 14100 | MT-ND5 | 9.31E−03 |
| 14101 | 14200 | MT-ND5/MT-ND6 | - |
| 14201 | 14300 | MT-ND6 | - |
| 14301 | 14400 | MT-ND6 | 1.04E−02 |
| 14401 | 14500 | MT-ND6 | 1.99E−02 |
| 14501 | 14600 | MT-ND6 | 2.26E−02 |
| 14601 | 14700 | MT-ND6/MT-TE | 3.82E−03 |
| 14701 | 14800 | MT-TE/MT-CYB | 1.92E−02 |
| 14801 | 14900 | MT-CYB | ND |
| 14901 | 15000 | MT-CYB | ND |
| 15001 | 15100 | MT-CYB | ND |
| 15101 | 15200 | MT-CYB | 3.30E−02 |
| 15201 | 15300 | MT-CYB | - |
| 15301 | 15400 | MT-CYB | - |
| 15401 | 15500 | MT-CYB | 8.52E−04 |
| 15501 | 15600 | MT-CYB | 7.43E−04 |
| 15601 | 15700 | MT-CYB | 1.16E−02 |
| 15701 | 15800 | MT-CYB | 2.24E−02 |
| 15801 | 15900 | MT-CYB/MT-TT | - |
| 15901 | 16000 | MT-TT/MT-TP | - |
| 16001 | 16100 | MT-TP | - |
| 16101 | 16200 | D-Loop | 2.23E−03 |
| 16201 | 16300 | D-Loop | 5.02E−04 |
| 16301 | 16400 | D-Loop | 1.84E−03 |
| 16401 | 16500 | D-Loop | 1.12E−03 |
| 16501 | 16600 | D-Loop | 2.20E−03 |
Shown is the location of the DMR within ChrM (based on GENCODE), the gene(s) residing within the 100 bp window, and p value from a multilevel mixed effects model. Results are displayed in order of genomic position. RPKM and corresponding p values are shown for windows if p < 0.05. Key: - denotes data not significant (p > 0.05); ND denotes not determined as the window was not included in analysis due to removal in NUMT pipeline; bold denotes windows that reached our Bonferroni significant threshold of p < 7.04E−04
Fig. 4.
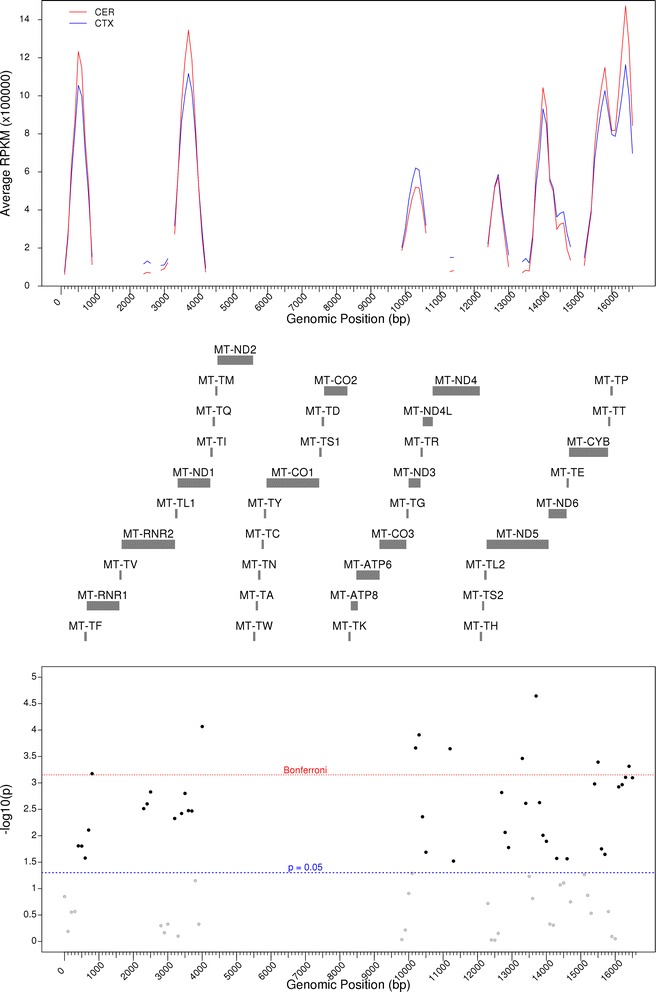
DNA methylation differences are seen in the mitochondrial genome between the cerebellum and cortex. RPKM values in the total cortex and cerebellum across the mitochondrial genome are shown in the top panel, with gene positions downloaded from GENCODE shown in the middle panel. For each 100 bp window, paired t tests were performed to compare the cortex to the cerebellum, with -log10 (p) shown in the bottom panel. BLD blood, BA8 Brodmann area 8, BA9 Brodmann area 9, BA10 Brodmann area 10, CER cerebellum, CTX cortex, ECX entorhinal cortex, RPKM reads per kilobase of transcript per million mapped reads, STG superior temporal gyrus. Red dashed line denotes the Bonferroni significance, whilst blue dashed line denotes p < 0.05 in the lower panel
MtDNA methylation patterns can distinguish between tissue types
Although we have shown that mtDNA methylation patterns are highly similar between distinct anatomical regions of the human brain and blood, we were also interested to identify whether mtDNA methylation patterns could distinguish between these tissue types. Through unsupervised hierarchical clustering, we showed that average mtDNA methylation patterns can segregate these tissues (Fig. 5a). Importantly, ncDNA methylation profiles in the same samples have also been previously shown to separate the cortex, cerebellum and blood [35]. Interestingly, when we performed unsupervised hierarchical clustering on the individual samples, we found that, in most cases, intra-individual differences across tissue types are greater than inter-individual differences within each tissue type, as the cortex, cerebellum and blood samples clustered with their own tissue type, respectively (Fig. 5b).
Fig. 5.
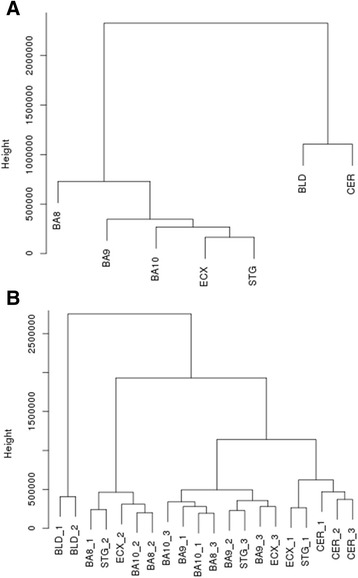
MtDNA methylation patterns can distinguish between tissue types. a Average RPKM values for each cortical brain region, cerebellum and blood samples were clustered based upon the Euclidean distance, identifying two major clusters; the cortex and blood-cerebellum. b When clustering RPKM values in the individual samples from the cortex, cerebellum and blood, we observed that individual cortex samples clustered together, whilst cerebellum and blood samples formed separate clusters. This highlights that tissue-specific differences between the cortex, cerebellum and blood are greater than intra-individual variability within a tissue. BLD blood, BA8 Brodmann area 8, BA9 Brodmann area 9, BA10 Brodmann area 10, CER cerebellum, CTX cortex, ECX entorhinal cortex, RPKM reads per kilobase of transcript per million mapped reads, STG superior temporal gyrus
Discussion
The availability of publicly available epigenomic data provides a great resource for mitochondrial epigenetics, a field that is relatively nascent and has yet to be thoroughly investigated in a range of complex diseases. Here, we present evidence that mtDNA methylation patterns across mtDNA are brain region specific. However, data such as that presented here is confounded by a lack of isolation of mtDNA prior to antibody enrichment and sequencing. As such, the potential of including NUMTs in datasets derived from data generated using total genomic DNA could lead to misleading results. Here, we controlled for regions of high sequence homology between the nuclear and mitochondrial genomes. However, this approach is likely over-conservative and does lead to the generation of a somewhat truncated consensus sequence. PCA of the mitochondrial epigenome after corrections for nuclear homology was able to separate individuals belonging to the three main tissue types, the blood, cortex and cerebellum based on mtDNA methylation variation among tissue types. This tissue specificity is further highlighted by the identification of eight DMRs that pass the Bonferroni correction for multiple testing between total cortex and cerebellum. MtDNA methylation has been shown to be cell line dependent in the past. [31] Although overall DNA methylation levels were low in all tissues, it is worth noting that the study was performed on non bisulfite-treated DNA. As such, the low percentage of mtDNA methylation is not a pitfall due to a lack of a total bisulfite treatment efficiency. One limitation of the current study is the unavailability of publicly available MeDIP-seq datasets of matched cortical and cerebellum tissue from other cohorts for validation purposes. Future work would aim to replicate our findings in additional study cohorts and also to investigate the relationship between mitochondrial DNA methylation and gene expression.
Despite a number of nominally significant windows being identified between each individual cortical region and the cerebellum, these did not pass the Bonferroni correction, although it is likely this method is too stringent. Nevertheless, the conservation of seven nominally significant windows across each Brodmann area is interesting to note. Four of these windows lie adjacent to each other and correspond to the mitochondrial D-Loop, a region containing the only two mitochondrial promoters which is typically associated with gene transcription and DNA replication. However, one limitation of this study is owed to the use of antibody-based enrichment, resulting in the analysis being limited to a window-based approach. Despite this, studies of the nuclear genome have shown high correlation between window-based approaches and, more sensitive, single-site assays such as the Illumina 450K beadarray [32]. However, given the small size of the mitochondrial genome and that 23 of the 37 genes present in the genome are below 100 bp in size, this window-based approach may not be the most appropriate for future studies designed to specifically assess mtDNA methylation as it can result in a window intersecting two genes in the polycistronic transcript.
Conclusions
This method provides a conservative approach to determine mtDNA methylation across the genome for data previously generated using next-generation sequencing approaches such as MeDIP-seq. Its conservative nature reduces the risk of the inclusion of NUMTs in the final analysis of whole genome data but may also lead to the inclusion of false negatives as well as potential gaps in the reference sequence. As such, it is best suited to analyzing previously generated whole genome data and is not a replacement for the isolation of mitochondrial DNA [36] prior to targeted methylation studies, which would be the optimal approach for investigating mitochondrial epigenomics. However, our method has allowed the identification of novel brain-region-specific DMRs in a previously generated publicly available dataset. Furthermore, the identification of brain region-specific mtDNA methylation patterns across the mitochondrial epigenome suggests the importance of a focussed, tissue-specific study design when investigating mtDNA methylation. As previously discussed, one caveat when utilizing MeDIP-seq data is the segregation of data into neighbouring windows, meaning that determining the exact corresponding gene of a DMR is difficult and, as such, future studies should aim to sequence the mitochondrial DNA methylome at single-base resolution to address this.
Methods
Data collection
We utilized publicly available MeDIP-seq data from Davies et al. [35]. In brief, this data was generated using 5 μg fragmented gDNA, which, following end repair <A> base addition and adaptor ligation, was immunoprecipitated using an anti-5-mC antibody (Diagenode, Liège, Belgium). MeDIP DNA was purified and then amplified using adaptor-mediated PCR, with DNA fragments between 220 and 320 bp subjected to highly parallel 50 bp paired-end sequencing on the Illumina Hi-Seq platform. The paired-end, raw fasta files were provided by the authors and quality checked using FastQC. Sample information is provided in Table 1.
Quality control and NUMT exclusion
Fasta files were subjected to adaptor and Phred score (q < 20) trimming. In an attempt to remove any potential contamination of possible NUMTs, multiple alignments to the reference genome were undertaken. Paired fasta files were aligned to GRCH37 using BWA. Unique and mapped reads aligning to the mitochondria were then re-mapped to a custom GRCH37 reference without the mitochondrial chromosome. Reads not mapping to the custom reference were then taken forward and realigned to the full GRCH37 reference to eliminate the possibility of homologous regions mapping falsely to the mitochondrial genome (Fig. 1). All alignments were carried out using BWA mem and default settings. Reads per kilobase of transcript per million mapped reads (RPKM) values for each sample were calculated using the MEDIPS package [37]. Methylation was averaged across 100 bp non-overlapping windows (default parameter setting in MEDIPS), and only windows with read counts >10 were considered for analysis. Due to the non-normal distribution of all cohorts, RPKM values were log2 transformed before statistical analysis.
Statistical analyses
All analyses were performed in the R statistical environment version 3.2.1 [38]. For all analyses, a nominally significant threshold of p < 0.05 and a Bonferroni significant threshold of p < 7.04E−04 were used. Given the matched sample nature of this cohort, two-tailed, paired t tests were performed at each window along the mitochondrial genome to identify DMRs between the individual cortical regions and cerebellum. To compare the total cortex to cerebellum, we performed a multilevel mixed effects model in the Lme4 package in R [39], using the brain region as the random effect and individual as the fixed effect. To assess the similarity of the brain regions, we used the R function “hclust” to cluster average RPKM values for the brain regions using the Euclidean distance. We used the R function “corrgram” within the corrgram package [40] to order samples based upon the similarity of their principal components.
Acknowledgements
Not applicable.
Funding
This work was funded by an Alzheimer’s Society project grant to KL (grant number AS-PG-14-038), an Alzheimer’s Research UK pilot grant to KL (grant number ARUK-PPG2013A-5) and an Alzheimer’s Association New Investigator Research Grant to KL (grant number NIRG-14-320878).
Availability of data and materials
Paired-end, raw fastq files from Davies et al. were provided by the authors [35].
Authors’ contributions
MD, MW, RS, AJ and EH undertook the data analysis and bioinformatics. MD and MW developed the pipeline for the analysis. MND and JM provided the data for the analysis. KL conceived and supervised the project. MD and KL drafted the manuscript. All authors read and approved the final submission.
Competing interests
The authors declare that they have no competing interests.
Consent for publication
Not applicable.
Ethics approval and consent to participate
Not applicable.
Publisher’s Note
Springer Nature remains neutral with regard to jurisdictional claims in published maps and institutional affiliations.
Abbreviations
- 5-mC
5-methylcytosine
- BA
Brodmann area
- DMR
Differentially methylated region
- MeDIP-seq
Methylated DNA Immunoprecipitation Sequencing
- mtDNA
Mitochondrial DNA
- ncDNA
Nuclear DNA
- NUMTs
Nuclear-mitochondrial DNA
- PCA
Principal component analysis
- rRNA
Ribosomal ribonucleic acid
- tRNA
Transfer ribonucleic acid
References
- 1.Anderson S, Bankier AT, Barrell BG, de Bruijn MH, Coulson AR, Drouin J, Eperon IC, Nierlich DP, Roe BA, Sanger F, et al. Sequence and organization of the human mitochondrial genome. Nature. 1981;290:457–65. doi: 10.1038/290457a0. [DOI] [PubMed] [Google Scholar]
- 2.Murgia M, Rizzuto R. Molecular diversity and pleiotropic role of the mitochondrial calcium uniporter. Cell Calcium. 2015;58:11–7. doi: 10.1016/j.ceca.2014.11.001. [DOI] [PubMed] [Google Scholar]
- 3.Wang W, Esbensen Y, Kunke D, Suganthan R, Rachek L, Bjoras M, Eide L. Mitochondrial DNA damage level determines neural stem cell differentiation fate. J Neurosci. 2011;31:9746–51. doi: 10.1523/JNEUROSCI.0852-11.2011. [DOI] [PMC free article] [PubMed] [Google Scholar]
- 4.Lunnon K, Ibrahim Z, Proitsi P, Lourdusamy A, Newhouse S, Sattlecker M, Furney S, Saleem M, Soininen H, Kloszewska I, et al. Mitochondrial dysfunction and immune activation are detectable in early Alzheimer’s disease blood. J Alzheimers Dis. 2012;30:685–710. doi: 10.3233/JAD-2012-111592. [DOI] [PubMed] [Google Scholar]
- 5.Lunnon K, Keohane A, Pidsley R, Newhouse S, Riddoch-Contreras J, Thubron EB, Devall M, Soininen H, Kloszewska I, Mecocci P, et al. Mitochondrial genes are altered in blood early in Alzheimer’s disease. Neurobiol Aging. 2017;53:36–47. doi: 10.1016/j.neurobiolaging.2016.12.029. [DOI] [PubMed] [Google Scholar]
- 6.Prabakaran S, Swatton JE, Ryan MM, Huffaker SJ, Huang JT, Griffin JL, Wayland M, Freeman T, Dudbridge F, Lilley KS, et al. Mitochondrial dysfunction in schizophrenia: evidence for compromised brain metabolism and oxidative stress. Mol Psychiatry. 2004;9:684–97. doi: 10.1038/sj.mp.4001532. [DOI] [PubMed] [Google Scholar]
- 7.Clay HB, Sillivan S, Konradi C. Mitochondrial dysfunction and pathology in bipolar disorder and schizophrenia. Int J Dev Neurosci. 2011;29:311–24. doi: 10.1016/j.ijdevneu.2010.08.007. [DOI] [PMC free article] [PubMed] [Google Scholar]
- 8.Chang CC, Jou SH, Lin TT, Lai TJ, Liu CS. Mitochondria DNA change and oxidative damage in clinically stable patients with major depressive disorder. PLoS One. 2015;10:e0125855. doi: 10.1371/journal.pone.0125855. [DOI] [PMC free article] [PubMed] [Google Scholar]
- 9.Lunnon K, Mill J. Epigenetic studies in Alzheimer’s disease: current findings, caveats, and considerations for future studies. Am J Med Genet B Neuropsychiatr Genet. 2013;162B:789–99. doi: 10.1002/ajmg.b.32201. [DOI] [PMC free article] [PubMed] [Google Scholar]
- 10.Lunnon K, Hannon E, Smith RG, Dempster E, Wong C, Burrage J, Troakes C, Al-Sarraj S, Kepa A, Schalkwyk L, Mill J. Variation in 5-hydroxymethylcytosine across human cortex and cerebellum. Genome Biol. 2016;17:27. doi: 10.1186/s13059-016-0871-x. [DOI] [PMC free article] [PubMed] [Google Scholar]
- 11.Lowe R, Slodkowicz G, Goldman N, Rakyan VK. The human blood DNA methylome displays a highly distinctive profile compared with other somatic tissues. Epigenetics. 2015;10:274–81. doi: 10.1080/15592294.2014.1003744. [DOI] [PMC free article] [PubMed] [Google Scholar]
- 12.Lokk K, Modhukur V, Rajashekar B, Martens K, Magi R, Kolde R, Koltsina M, Nilsson TK, Vilo J, Salumets A, Tonisson N. DNA methylome profiling of human tissues identifies global and tissue-specific methylation patterns. Genome Biol. 2014;15:r54. doi: 10.1186/gb-2014-15-4-r54. [DOI] [PMC free article] [PubMed] [Google Scholar]
- 13.Lunnon K, Smith R, Hannon EJ, De Jager PL, Srivastava G, Volta M, Troakes C, Al-Sarraj S, Burrage J, Macdonald R, et al. Methylomic profiling implicates cortical deregulation of ANK1 in Alzheimer’s disease. Nat Neurosci. 2014;17:1164–70. doi: 10.1038/nn.3782. [DOI] [PMC free article] [PubMed] [Google Scholar]
- 14.De Jager PL, Srivastava G, Lunnon K, Burgess J, Schalkwyk LC, Yu L, Eaton ML, Keenan BT, Ernst J, McCabe C, et al. Alzheimer’s disease: early alterations in brain DNA methylation at ANK1, BIN1, RHBDF2 and other loci. Nat Neurosci. 2014;17:1156–63. doi: 10.1038/nn.3786. [DOI] [PMC free article] [PubMed] [Google Scholar]
- 15.Smith AR, Smith RG, Condliffe D, Hannon E, Schalkwyk L, Mill J, Lunnon K. Increased DNA methylation near TREM2 is consistently seen in the superior temporal gyrus in Alzheimer’s disease brain. Neurobiol Aging. 2016;47:35–40. doi: 10.1016/j.neurobiolaging.2016.07.008. [DOI] [PMC free article] [PubMed] [Google Scholar]
- 16.Pidsley R, Viana J, Hannon E, Spiers HH, Troakes C, Al-Saraj S, Mechawar N, Turecki G, Schalkwyk LC, Bray NJ, Mill J. Methylomic profiling of human brain tissue supports a neurodevelopmental origin for schizophrenia. Genome Biol. 2014;15:483. doi: 10.1186/s13059-014-0483-2. [DOI] [PMC free article] [PubMed] [Google Scholar]
- 17.Hannon E, Spiers H, Viana J, Pidsley R, Burrage J, Murphy TM, Troakes C, Turecki G, O’Donovan MC, Schalkwyk LC, et al. Methylation QTLs in the developing brain and their enrichment in schizophrenia risk loci. Nat Neurosci. 2016;19:48−+. doi: 10.1038/nn.4182. [DOI] [PMC free article] [PubMed] [Google Scholar]
- 18.Florath I, Butterbach K, Heiss J, Bewerunge-Hudler M, Zhang Y, Schottker B, Brenner H. Type 2 diabetes and leucocyte DNA methylation: an epigenome-wide association study in over 1,500 older adults. Diabetologia. 2016;59:130–8. doi: 10.1007/s00125-015-3773-7. [DOI] [PubMed] [Google Scholar]
- 19.Adams AT, Kennedy NA, Hansen R, Ventham NT, O’Leary KR, Drummond HE, Noble CL, El-Omar E, Russell RK, Wilson DC, et al. Two-stage genome-wide methylation profiling in childhood-onset Crohn’s Disease implicates epigenetic alterations at the VMP1/MIR21 and HLA loci. Inflamm Bowel Dis. 2014;20:1784–93. doi: 10.1097/MIB.0000000000000179. [DOI] [PMC free article] [PubMed] [Google Scholar]
- 20.Devall M, Mill J, Lunnon K. The mitochondrial epigenome: a role in Alzheimer’s disease? Epigenomics. 2014;6:665–75. doi: 10.2217/epi.14.50. [DOI] [PMC free article] [PubMed] [Google Scholar]
- 21.Devall M, Roubroeks J, Mill J, Weedon M, Lunnon K. Epigenetic regulation of mitochondrial function in neurodegenerative disease: New insights from advances in genomic technologies. Neurosci Lett. 2016;625:47–55. doi: 10.1016/j.neulet.2016.02.013. [DOI] [PMC free article] [PubMed] [Google Scholar]
- 22.Shock LS, Thakkar PV, Peterson EJ, Moran RG, Taylor SM. DNA methyltransferase 1, cytosine methylation, and cytosine hydroxymethylation in mammalian mitochondria. Proc Natl Acad Sci U S A. 2011;108:3630–5. doi: 10.1073/pnas.1012311108. [DOI] [PMC free article] [PubMed] [Google Scholar]
- 23.Chestnut BA, Chang Q, Price A, Lesuisse C, Wong M, Martin LJ. Epigenetic regulation of motor neuron cell death through DNA methylation. J Neurosci. 2011;31:16619–36. doi: 10.1523/JNEUROSCI.1639-11.2011. [DOI] [PMC free article] [PubMed] [Google Scholar]
- 24.Feng S, Xiong L, Ji Z, Cheng W, Yang H. Correlation between increased ND2 expression and demethylated displacement loop of mtDNA in colorectal cancer. Mol Med Rep. 2012;6:125–30. doi: 10.3892/mmr.2012.870. [DOI] [PubMed] [Google Scholar]
- 25.Pirola CJ, Gianotti TF, Burgueno AL, Rey-Funes M, Loidl CF, Mallardi P, Martino JS, Castano GO, Sookoian S. Epigenetic modification of liver mitochondrial DNA is associated with histological severity of nonalcoholic fatty liver disease. Gut. 2013;62:1356–63. doi: 10.1136/gutjnl-2012-302962. [DOI] [PubMed] [Google Scholar]
- 26.Infantino V, Castegna A, Iacobazzi F, Spera I, Scala I, Andria G, Iacobazzi V. Impairment of methyl cycle affects mitochondrial methyl availability and glutathione level in Down’s syndrome. Mol Genet Metab. 2011;102:378–82. doi: 10.1016/j.ymgme.2010.11.166. [DOI] [PubMed] [Google Scholar]
- 27.Wong M, Gertz B, Chestnut BA, Martin LJ. Mitochondrial DNMT3A and DNA methylation in skeletal muscle and CNS of transgenic mouse models of ALS. Front Cell Neurosci. 2013;7:279. doi: 10.3389/fncel.2013.00279. [DOI] [PMC free article] [PubMed] [Google Scholar]
- 28.Wen SL, Zhang F, Feng S. Decreased copy number of mitochondrial DNA: a potential diagnostic criterion for gastric cancer. Oncol Lett. 2013;6:1098–102. doi: 10.3892/ol.2013.1492. [DOI] [PMC free article] [PubMed] [Google Scholar]
- 29.Blanch M, Mosquera JL, Ansoleaga B, Ferrer I, Barrachina M. Altered mitochondrial DNA methylation pattern in Alzheimer disease-related pathology and in Parkinson disease. Am J Pathol. 2016;186:385–97. doi: 10.1016/j.ajpath.2015.10.004. [DOI] [PubMed] [Google Scholar]
- 30.Iacobazzi V, Castegna A, Infantino V, Andria G. Mitochondrial DNA methylation as a next-generation biomarker and diagnostic tool. Mol Genet Metab. 2013;110:25–34. doi: 10.1016/j.ymgme.2013.07.012. [DOI] [PubMed] [Google Scholar]
- 31.Ghosh S, Sengupta S, Scaria V. Comparative analysis of human mitochondrial methylomes shows distinct patterns of epigenetic regulation in mitochondria. Mitochondrion. 2014;18:58–62. doi: 10.1016/j.mito.2014.07.007. [DOI] [PubMed] [Google Scholar]
- 32.Clark C, Palta P, Joyce CJ, Scott C, Grundberg E, Deloukas P, Palotie A, Coffey AJ. A comparison of the whole genome approach of MeDIP-seq to the targeted approach of the Infinium HumanMethylation450 BeadChip® for methylome profiling. PLoS One. 2012;7:e50233. doi: 10.1371/journal.pone.0050233. [DOI] [PMC free article] [PubMed] [Google Scholar]
- 33.Thangaraj K, Joshi MB, Reddy AG, Rasalkar AA, Singh L. Sperm mitochondrial mutations as a cause of low sperm motility. J Androl. 2003;24:388–92. doi: 10.1002/j.1939-4640.2003.tb02687.x. [DOI] [PubMed] [Google Scholar]
- 34.Yao YG, Kong QP, Salas A, Bandelt HJ. Pseudomitochondrial genome haunts disease studies. J Med Genet. 2008;45:769–72. doi: 10.1136/jmg.2008.059782. [DOI] [PubMed] [Google Scholar]
- 35.Davies MN, Volta M, Pidsley R, Lunnon K, Dixit A, Lovestone S, Coarfa C, Harris RA, Milosavljevic A, Troakes C, et al. Functional annotation of the human brain methylome identifies tissue-specific epigenetic variation across brain and blood. Genome Biol. 2012;13:R43. doi: 10.1186/gb-2012-13-6-r43. [DOI] [PMC free article] [PubMed] [Google Scholar]
- 36.Devall M, Burrage J, Caswell R, Johnson M, Troakes C, Al-Sarraj S, Jeffries AR, Mill J, Lunnon K. A comparison of mitochondrial DNA isolation methods in frozen post-mortem human brain tissue-applications for studies of mitochondrial genetics in brain disorders. Biotechniques. 2015;59:241–6. doi: 10.2144/000114343. [DOI] [PubMed] [Google Scholar]
- 37.Lienhard MGC, Morkel M, Herwig R, Chavez L. MEDIPS: genome-wide differential coverage analysis of sequencing data derived from DNA enrichment experiments. Bioinformatics. 2014;30:284–6. doi: 10.1093/bioinformatics/btt650. [DOI] [PMC free article] [PubMed] [Google Scholar]
- 38.R Development Core Team . R: a language and environment for statistical computing. Vienna: R Foundation for Statistical Computing; 2012. p. 2012. [Google Scholar]
- 39.Vazquez AI, Bates DM, Rosa GJ, Gianola D, Weigel KA. Technical note: an R package for fitting generalized linear mixed models in animal breeding. J Anim Sci. 2010;88:497–504. doi: 10.2527/jas.2009-1952. [DOI] [PubMed] [Google Scholar]
- 40.Wright K. Package corrgram. R package version 1.9. 2016. Available from: https://cran.r-project.org/web/packages/corrgram/index.html. Accessed 30 Sept 2016.
Associated Data
This section collects any data citations, data availability statements, or supplementary materials included in this article.
Data Availability Statement
Paired-end, raw fastq files from Davies et al. were provided by the authors [35].