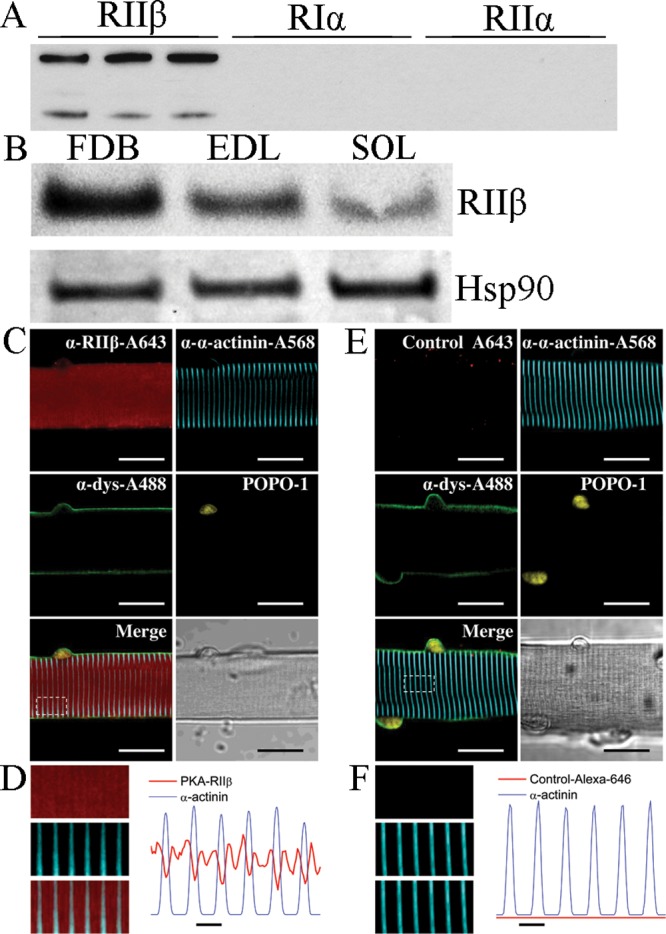
Figure 1.

Western blot and immunofluorescence analysis of PKA. (A) Western blot for RIIβ showing antibody specificity. Lanes are 1000-, 2000-, and 5000-fold dilutions for RIIβ (lanes 1–3, respectively), RIα,4−6 and RIIα.7−9 (B) Western blot showing the presence of RIIβ in FDB, EDB, and soleus muscle tissue. (C) Representative confocal images of a segment of FDB fiber indirectly immunolabeled with antibodies against RIIβ (red), α-actinin (cyan), dystrophin (green), and POPO-1, to define the nuclei. (D) Close-ups (left) of the boxed region indicated in panel C for RIIβ (top), α-actinin (middle), and merged images (bottom) and averaged fluorescence profiles (right) of RIIβ (red trace) and α-actinin (blue trace) signals across the box. (E and F) Same labeling as in panels C and D, respectively, except that anti-RIIβ was not included. Scale bars in panels C and E are 20 μm and in panels D and F are 2 μm.
