

Abstract
The inherent difficulty of discovering new and effective antibacterials and the rapid development of resistance particularly in Gram-negative bacteria, illustrates the urgent need for new methods that enable rational drug design. Here we report the development of 3D imaging cluster Time-of-Flight secondary ion mass spectrometry (ToF-SIMS) as a label-free approach to chemically map small molecules in aggregated and single Escherichia coli cells, with ∼300 nm spatial resolution and high chemical sensitivity. The feasibility of quantitative analysis was explored, and a nonlinear relationship between treatment dose and signal for tetracycline and ampicillin, two clinically used antibacterials, was observed. The methodology was further validated by the observation of reduction in tetracycline accumulation in an E. coli strain expressing the tetracycline-specific efflux pump (TetA) compared to the isogenic control. This study serves as a proof-of-concept for a new strategy for chemical imaging at the nanoscale and has the potential to aid discovery of new antibacterials.
Gram-negative bacterial pathogens are increasingly resistant to the approved treatments,1,2 which has led to the use of drugs of last resort (e.g., colistin) that are less safe and are also losing efficacy.3−5 These problems are exacerbated by the slow rate of discovery and approval of new effective treatments for antibiotic-resistant Gram-negative bacterial infections.4,6,7 Gram-negative pathogens are challenging targets for drug discovery largely because promising antibiotics fail to accumulate to effective levels within the intracellular compartment(s) of the cell.8−10 The accumulation problem arises initially from an outer membrane permeability barrier that restricts influx of large and/or hydrophobic molecules. Many of the smaller, polar compounds that can penetrate this outer membrane barrier through aqueous porins to the periplasm can then be ejected from the cells by one or more tripartite resistance-nodulation-cell division (RND) efflux pumps.8 The chemical property space that is enriched for molecules that can traverse the Gram-negative outer membrane through the aqueous porins is poorly represented in typical high-throughput screening compound collections.11,12 The practical result of these problems is illustrated by the fact that several classes of antibiotics in use for Gram-positive infections (e.g., vancomycin and linezolid) have clinically relevant antibacterial activity only against Gram-negative bacteria with compromised permeability barriers and/or efflux systems.10,13
The ability to measure compound uptake and accumulation into Gram-negative bacteria is an essential step toward generating structure–activity relationship models to guide rational drug design and optimization.9 There have been many approaches to this problem, including monitoring of compounds via (1) enzymatic modification,14−16 (2) intrinsic fluorescence,17−20 and (3) radiolabels.21−24 Enzymatic modification is limited to a few specific scaffolds. Radiolabeled assays are sensitive but low-throughput and expensive because each compound must have a radiolabel incorporated. There are many disadvantages to using fluorescence assays, including the limited or complete absence of autofluorescence with most compounds, low sensitivity, and difficulties with quantitation. In the complex cellular environment, quenching of fluorescence emission and bacterial autofluorescence can also interfere with fluorescent compound detection. In addition, antibiotic treatment can alter bacterial autofluorescence, which could further complicate analysis.25 Finally, attaching fluorophores to nonfluorescent antibiotics could alter the accumulation parameters of the antibiotic under study. There has been a recent interest in utilizing mass spectrometric methods to provide insight into the drug localization challenge.26−28 When combined with liquid chromatography, sensitive assays of unlabeled drug concentrations have been reported for cell populations, although sample preparation strategies are quite involved and cannot provide subcellular localizations, which would be relevant to target engagement.
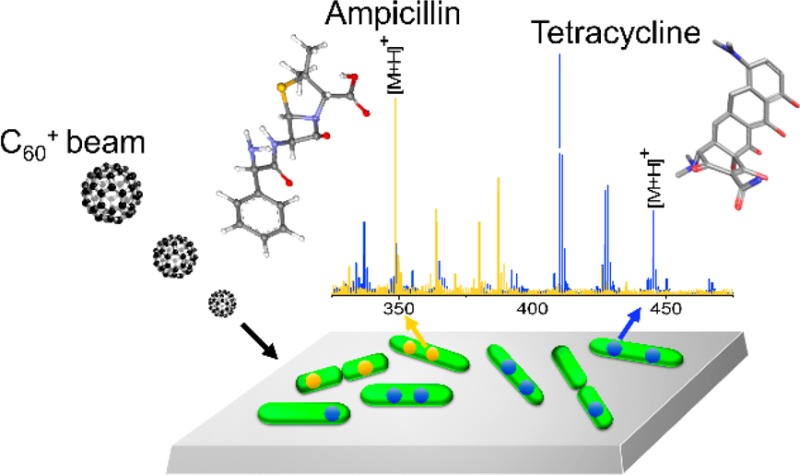
Here we examine the application of imaging Time-of-Flight secondary ion mass spectrometry (ToF-SIMS) as a label-free approach to tracking endogenous and exogenous chemicals in a complex biological system, a well-studied, rod-shaped Gram-negative pathogen, Escherichia coli. An E. coli cell is approximately 3.9 μm long and 1.3 μm in diameter when grown in rich medium, comparable in size to a mitochondrion.29 The size of E. coli cells presents a serious challenge to acquiring the necessary spatial resolution and sensitivity for imaging experiments. With imaging ToF-SIMS, an energetic primary ion beam is focused to a submicron spot on the target and ablates ionized material into a mass spectrometer. Two types of ion beam systems are widely used in the field, atomic ion beams and cluster ion beams. With atomic ion beams, an energetic beam of monatomic ions is incident upon the target, with a spot diameter as small as 30 nm. This beam destroys molecules in the near surface region, resulting in detection of chemically nonspecific small fragment ions. Chemical specificity is achieved using either isotope labeling or metal ion incorporation.30 Several attempts to chemically image metals, isotopes, and fragment ion signatures for single E. coli cells have been reported.31−34 With cluster ion beam, the primary ion beam consists of a molecular cluster ion, which is capable of desorbing intact molecules with high efficiency. These beams have three specific advantages over other MS technologies used for molecular imaging. First, the ion beams can be focused to a spot diameter of <300 nm.35,36 Second, as the sample is bombarded by the cluster, erosion occurs at a rate of a few microns per hour.37 During the erosion process, there is some chemical damage buildup, but mass spectra characteristic of the composition of target can still be acquired.37,38 This mode of operation is referred to as molecular depth profiling.38 With model systems, a depth resolution of 30 nm has been achieved using C60+ projectiles.39 Third, by combining 2-dimensional imaging with molecular depth profiling, a 3-dimensional molecular rendering is feasible.40−43 This data cube contains a massive amount of information, including mass spectra for all three coordinates of the image.
Here, we apply cluster ToF-SIMS imaging to E. coli treated with ampicillin (AMP) and tetracycline (TET). These two antibiotics target different subcellular compartments: the penicillin-binding proteins in the periplasm of the bacterial cell envelope (AMP) and the ribosomes in the bacterial cytoplasm (TET). The results show that, for aggregates of cells, it is possible to obtain information about the degree of drug localization through direct detection of the drug molecular ion. Moreover, for single cells, we show that it is not only possible to detect the presence of both AMP and TET, but with a depth resolution of ∼200 nm, the differential localization of the compounds can be observed. Finally, we compare the difference in TET concentration in an E. coli strain expressing the tetracycline-specific efflux pump (TetA) compared to the isogenic control. The approach described here offers a powerful new strategy for submicron chemical imaging of bacteria and demonstrates its potential utility for measuring the intracellular accumulation of exogenous compounds inside bacteria.
Materials and Methods
1. SIMS Characterization of Ampicillin and Tetracycline
Protocols for SIMS analysis of antibiotic standards is detailed in Supporting Information, Section 1.
2. ToF-SIMS Imaging of AMP and TET-Dosed E. coli
E. coli Strains
E. coli K-12 BW251103 and isogenic strain (JW5503–1, ΔtolC732::kan) were purchased from the Coli Genetic Stock Center at Yale University (New Haven, CT). The plasmid containing the tetracycline resistance gene tetA, encoding a TET-specific efflux pump, and the vector control include the origin of replication from pUC, a chloramphenicol acetyltransferase gene, and a β-lactamase operon promoter for expression of an inserted gene. The vector control contained the gene coding for a truncated green fluorescent protein, and the TetA plasmid contained tetA from pEX19Tc (accession number AF047519). The plasmids were transformed into E. coli K-12 BW251103. Antibiotic susceptibility was determined by broth microdilution assays according to standard guidelines using cation-adjusted Mueller-Hinton broth44 as well as in lysogeny broth (LB, 10 g tryptone, 5 g yeast extract, and 10 g NaCl) to match the medium used in ToF-SIMS experiments. For E. coli K-12 BW251103, the minimum inhibitory concentration of TET in LB shifted from 2 μg/mL for the vector control strain up to 64 μg/mL for the TetA strain, as expected.45
Sample Preparation of Aggregated and Isolated E. coli Cells on Si
The first goal was to examine a single-layer aggregate of E. coli cells to evaluate drug detectability. E. coli was cultured on an LB agar plate (100 mm, TEKnova, Hollister, CA) overnight in an incubator at 37 °C. Subsequently, a single colony was cultured overnight in LB at 37 °C (250 mL package, TEKnova, Hollister, CA) with agitation. The culture medium was diluted 1:5 with fresh medium and then incubated for 1 h at 37 °C. Antibiotics were then dosed at 7, 20, and 60 μg/mL in the culture medium for 20 min at 37 °C. The cells were harvested by centrifugation at 834 × g for 3 min, and then washed with deionized water and centrifuged at 834 × g for 3 min. The wash step was performed a total of four times at room temperature. A 10 μL aliquot of resuspended, washed cells was directly spin-coated onto a clean silicon wafer.46 Alternatively, a 10 μL aliquot of resuspended, washed cells was then mixed with 0.1 M trehalose (1:1 v/v) and spin-coated onto a clean Si wafer. The samples were then plunge frozen into liquid ethane and then swiftly transferred to liquid nitrogen (LN2). Under the LN2, the samples were loaded onto a precooled sample holder at 153 K in the vacuum followed by freeze-drying for 4 h.
The second set of experiments was developed to prepare isolated E. coli cells to evaluate the possibility of drug detection at the single cell level. E. coli was cultured on LB agar overnight as above. A single colony of E. coli was then selected and cultured in LB with a precleaned Si wafer submerged for 4 h with agitation in an incubator at 37 °C, resulting in a monolayer of bacteria with 20–30% coverage on Si as determined by scanning electron microscopy (Figure S11). The LB was removed and replaced with fresh LB before compound was added. The final concentrations of each compound were 7, 20, 60, and 180 μg/mL in the culture medium. After 20 min of compound treatment, the sample was washed quickly with deionized water four times and gently blown dry using a stream of nitrogen gas for 3 s. The samples were plunge frozen into liquid ethane and then swiftly transferred to LN2. Under LN2, the samples were loaded onto a precooled sample holder at 153 K followed by freeze-drying for 4 h under a vacuum.
Cryo-SEM Characterization
To verify cell morphology and integrity, cells resulting from the various preparations were subjected to cryo-scanning variable pressure, field emission scanning electron microscopy (SEM) (Zeiss SIGMA VP-FESEM), with a beam energy of 5 keV. The isolated E. coli on Si was prepared as above and then dosed with 20 μg/mL TET or AMP for time periods of 1, 5, 20, 40, and 60 min, or with 180 μg/mL TET or AMP for 20 min, followed by plunge-freezing into liquid ethane, and then transferred to LN2. The samples were transferred to a precooled stage at 100 K and sputter-coated with ∼1 nm of gold for SEM characterization. Each sample was examined at different magnifications to reveal cell morphology changes induced by different doses or times. The images are presented as Supporting Information in Figure S11.
ToF-SIMS Imaging
Imaging was performed using the J105 chemical imager. The C60+ primary ion beam was restricted to a spot size of ∼300 nm in diameter using a 20 μm aperture inserted into the beam path before final focusing. In this configuration, the maximum possible beam current is 0.5 pA. A mass spectral image consisting of 65536 individual mass spectra was created by scanning the beam over a field of view of 50 × 50 μm2 with a 256 × 256 pixel density; correspondingly, each pixel covers an area of 200 × 200 nm2. The dwell time on each pixel was typically 50 ms, resulting in an image acquisition time of ∼1 h and a total ion dose of ∼3 × 10¹⁴ ions/cm2, named one analysis cycle. Approximately three analysis cycles were required to fully ablate the E. coli cells. Using the reported diameter of E. coli in similar growth conditions,29 this suggests that the each cycle corresponds to an erosion depth of ∼400 nm.47 To display chemical images associated with a specific mass or masses, two approaches are utilized. If the measured intensity of the secondary ion of interest is low, so that many of the pixels exhibit no intensity, it is assigned a specific color to indicate absence of the species. When more than one molecule is involved, different colors are assigned to the different species, and the resulting images are overlaid. If the measured intensity of the secondary ion of interest extends over a range of values, the pixel is assigned a color based on that intensity.
Data Analysis
All images were created using the Analyze software (version 1.0.08.14) developed by Ionoptika, U.K. A mass window of 0.1 mass units wide centered at the known exact mass of the target molecular ion was employed to select the desired secondary ions and reduce interference from nearby peaks.
Secondary ion statistical analyses were performed using ImagingSIMS, Version 3.6, a software package developed in-house and made freely available.48 The procedure involved selecting an area associated only with E. coli cell(s), summing up the measured signals originating from the analyte, and calculating a weighted standard deviation of variance from area to area. Values were calculated for both aggregated and isolated cells using specific concentrations of drug and different strains of E. coli. The detailed procedure is described in the Supporting Information, Section 6.
Results and Discussion
AMP and TET Detected in E. coli Lysate
The first step in establishing the feasibility of imaging the TET and AMP distributions within E. coli was to acquire mass spectra of these molecules in their intrinsic biological matrix. This step was necessary to estimate the limits of detection in the actual cell, to determine whether the presence of the complex environment of the cell creates inherent chemical interferences, and to assess any ion suppression phenomenon that could impact quantitation.
To establish a reference point, each drug was dissolved into the lysate of E. coli. The ToF-SIMS spectra of 10 mg/mL TET-dosed and AMP-dosed E. coli lysates are shown in Figures S1 and S3, and the corresponding intensities as a function of drug concentration are plotted in Figures S2 and S4. The characteristic ions of TET (m/z 445.2 [M + H]+, 427.2 [M + H – H2O]+, and 410.1 [M – (OH)2]+; Figure S1) and AMP (m/z 350.1 [M + H]+ and 192.1 [M – C7H10O2S]+; Figure S3) were clearly seen in this complex matrix. Hence, there are multiple MS peaks assigned to the two antibiotics that could be used for detection. The fragment ions were likely from the insource fragmentation at this stage, but in intact cells, AMP molecules that were hydrolyzed or covalently bound to protein would be detected only as the fragment ions. The lower detection threshold for TET was 1 μg/mL (Figure S2) and 10 μg/mL for AMP (Figure S4). The characteristic ion counts for TET exhibited a proportional dose–response (R2 = 0.985–0.997) over a concentration range from 1 to 1000 μg/mL (Figure S2). The proportional dose–response range (R2 = 0.776–0.981) for AMP ions was from 10 to 1000 μg/mL (Figure S4). These results demonstrate that the necessary sensitivity, specificity, and range of detection can be obtained with cluster ToF-SIMS, which lays the foundation for the direct detection of antibiotics in bacteria. A variety of other antibiotics of different classes were also detected with ToF-SIMS (Table S1).
Dose response of TET/AMP in Single-Layer Aggregated E. coli Cells
With this confirmation that TET and AMP can be detected with ToF-SIMS in E. coli lysate, we next evaluated whether these compounds could be detected in intact dosed E. coli cells. Antibiotic-treated bacteria were spin-coated onto Si, forming single-layer aggregates to average out stochastic variations and to increase the coverage on the Si surface, the signal density, and the number of cells imaged.49 A series of control experiments evaluating feasibility, determining signal-to-noise, and measuring background are described below.
Because depth profiling using the C60+ primary ion beam induces chemical damage to the target, the stability of targeted antibiotics was investigated (Figure S5). TET signal declined to a steady state after the initial C60+ etching, demonstrating the feasibility of detecting TET with constant C60+ sputtering. The sputter rate for E. coli cells was also measured (Figure S6). Assuming the E. coli cells have an average height of 1.3 μm,29 it is estimated that a 400 nm layer of the cells was etched away with the C60+ ion beam dose and duration used for the depth profiling experiments.
To identify regions of the Si surface containing E. coli cells, the absence of Si signal and the presence of unique E. coli-associated MS peaks were used, as described in the Supporting Information, Section 5. The results show that Si and biological signals of E. coli cells are complementary, and therefore, the absence of Si signal can be used to identify areas containing E. coli cells.
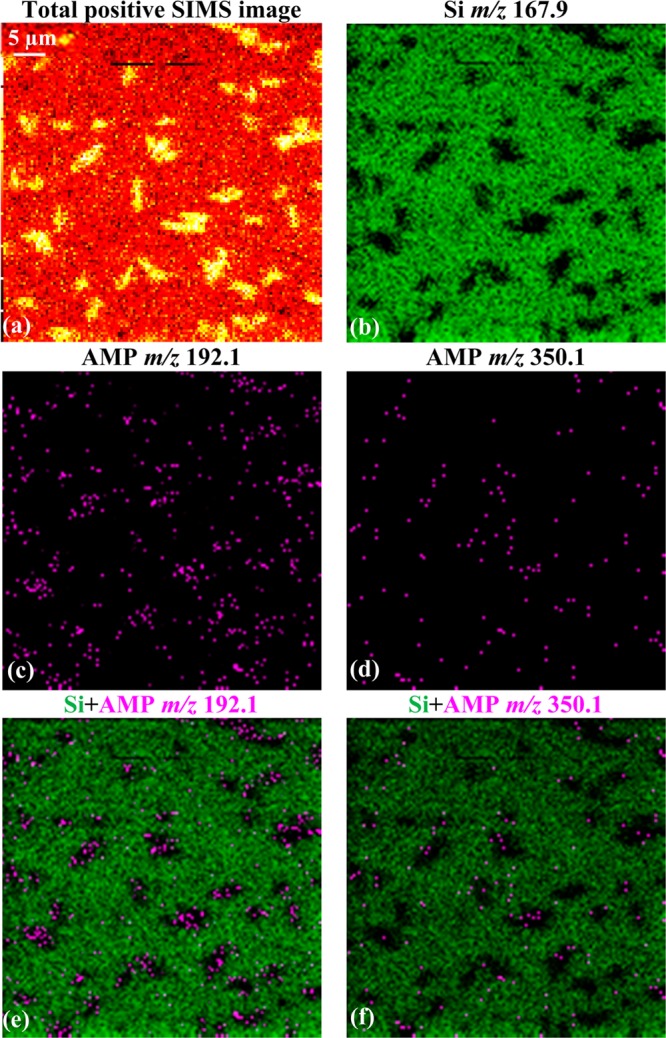
The aggregated cells were then subjected to C60+ ToF-SIMS depth-profiling. The signals for Si and TET or AMP were determined for each pixel at each depth, as shown in the color overlay images (Figure 1). At a TET treatment dose of 20 μg/mL, the yellow TET signal was nonoverlapping with the blue Si signal throughout the different depths of the cell. This indicated that the TET signal was localized to the single-layer E. coli cell aggregates. Likewise, the pink AMP signal showed a similar correlation to the E. coli aggregates. To evaluate the background antibiotic signal from Si regions of the treated and washed surface, the signal level of TET or AMP (both dosed at 20 μg/mL) in E. coli regions was compared to Si regions (Table S2). These results showed 14-fold to 17-fold more antibiotic signal in E. coli cellular regions versus Si regions. At higher doses of antibiotics, a similar or higher ratio was observed. The multiple depths imaged with ToF-SIMS in Figure 1 offer direct evidence that the antibiotics reside inside the E. coli cells and are not merely associated with the outer surface of the cells.
Figure 1.

E. coli aggregates treated with TET (20 μg/mL) and AMP (20 μg/mL), underwent depth profiling using the C60+ ion beam. The color overlay images of Si (mapped by m/z 167.9, blue) and TET (mapped by summing the molecular ion with fragments at m/z 410.1, 427.2, and 445.2, yellow) in (a–c) and Si (mapped by m/z 167.9, blue) and AMP (mapped by summing the molecular ion, m/z 350.1, and fragment ion, m/z 192.1, pink) in (d–f), are shown at the indicated depths from the top surface to 1200 nm below the surface. The AMP and TET signals were clearly localized within the E. coli aggregates at each depth.
The average antibiotic MS signal from each pixel within the E. coli aggregates (as determined by the absence of Si signal) was calculated for all layers of the depth profiling in units of intensity per pixel and listed in Table 1. A nonlinear increase of the TET and AMP signals was observed in the test dose range from 0 to 60 μg/mL. The signal-to-noise level, characterized by the average antibiotic signal per pixel in the antibiotic-dosed E. coli aggregates relative to untreated control E. coli aggregates, was approximately 7 for TET and 50 for AMP at a dose of 7 μg/mL. The ability to detect AMP in cells dosed at 7 μg/mL, at or below the lower threshold of detection of 10 μg/mL, as determined in membrane-free lysate, may reflect enhanced accumulation in living cells, perhaps due to the presence of target penicillin-binding proteins and/or enhanced ionization efficiency in an intact cellular context. The robust signal-to-noise suggests that the ToF-SIMS signal detected was correctly attributed to the antibiotics. It is unclear whether the nonlinear dose-dependent accumulation of antibiotics reflects actual biological distribution or technical limitations. Nevertheless, the results highlight the feasibility of cluster ToF-SIMS imaging for chemical imaging of a complex biological system at the single micron scale with submicron depth resolution.
Table 1. Dose–Response Relationship of SIMS Signal from AMP-Treated and TET-Treated E. coli.
| dose (μg/mL) | avg TET signal (counts/pixel) | avg AMP signal (counts/pixel) |
|---|---|---|
| 0 | 0.9 | 0.1 |
| 7 | 5.9 | 5.2 |
| 20 | 6.8 | 7.0 |
| 60 | 9.4 | 7.3 |
Antibiotics are Located within E. coli at the Single Cell Level
With experience gained from preparing and analyzing the E. coli aggregates, the next step was to grow a monolayer of cells directly on the Si wafer. Other substrates were also tested, such as indium tin oxide-coated glass, polytetrafluoroethylene and copper. Among all surfaces examined, Si yielded the highest degree of reproducibility for E. coli growth and ToF-SIMS detection. The bacteria were distributed as single cells or small groups on the substrate after washing with deionized water. The cell integrity and morphology after sample preparation designed for ToF-SIMS analysis were further examined using Cryo-SEM. The results are shown in Figure S11 and confirm cell integrity with no obvious morphological change after 20 min exposure to 20 μg/mL TET or AMP. Prolonged antibiotic exposure led to cessation of bacterial growth, as expected. In addition, prolonged AMP exposure, followed by the freezing protocol, resulted in collapse of the E. coli cells, presumably due to weakening of the peptidoglycan as part of the AMP mechanism of action.
With this optimized protocol, localization of AMP and TET in single E. coli cells was examined. As shown in Figure 2, AMP-treated (20 μg/mL) E. coli cells were analyzed using a C60+ beam with ∼300 nm diameter. The outlines of individual cells can be clearly seen in the total positive ion image in Figure 2a. The single ion image in Figure 2b shows the Si signal (green) on a black background. Together the total positive ion signal and lack of green Si signal were consistent with the presence of E. coli cells. In Figure 2c,d, the AMP molecular ion at m/z 350.1 and fragment ion at m/z 192.1 exhibited the same distribution pattern. Overlaying colors for the Si signal and AMP signal as in Figure 2e,f, illustrated nonoverlapping distribution and confirmed the colocalization of AMP with E. coli cells. To rule out the interference of noise in the detection of antibiotic, signal counting was utilized to compare the background signal with the antibiotic signal. As shown in Figure S12, five areas with E. coli cells (green boxes) and five areas without E. coli cells (black boxes) were selected to calculate the signal counts from AMP, represented by the molecular ion at m/z 350.1 and the fragment ion at m/z 192.1. As shown in the right panel, the molecular ion at m/z 350.1 was detected from areas 1–5, with an average of 3 ± 1 signal counts/pixel from the green boxes (E. coli regions) compared to 0 signal counts/pixel in the black boxes (Si only regions). The AMP fragment ion at m/z 192.1 showed a more intense signal level in the green boxes, of 14 ± 6 signal counts/pixel compared to 1 signal counts/pixel in the black boxes. This data analysis underestimated the levels of AMP because each green box contained pixels devoid of bacterial signal. Nevertheless, this statistical analysis suggests that AMP is detectable at the single cell level.
Figure 2.
Total and selected SIMS images show the localization of AMP signal to individual E. coli cells. The bacteria were cultured on Si and treated with 20 μg/mL AMP. The total positive ion image in (a) shows the outline of the single bacteria or their small clusters. The AMP molecular ion at m/z 350.1 in (d) and the fragment ion at m/z 192.1 in (c) are nonoverlapping with Si in (b). The signal overlay images in (e) and (f) demonstrate colocalization of AMP to E. coli, represented by the black regions within the green background.
To three-dimensionally localize antibiotics in E. coli, the sample was subjected to a simple form of depth profiling. As shown in Figure 3, a plot of AMP signal intensity as a function of cell depth revealed a decrease in signal level as the C60+ beam probed deeper into the cells. The inset color overlay images of AMP (pink) and Si (blue) at each depth showed that the presence of the AMP signal is nonoverlapping with Si, consistent with the presence of E. coli. The AMP molecular ion signal and the fragment ion signal were combined together to enhance the signal. The AMP signal intensity at each layer indicates that AMP was largely present in the first 400 nm depth from the surface of each E. coli cell. This putative localization is consistent with the periplasmic localization of penicillin-binding proteins, the targets of AMP, and suggests that AMP did not reach the same concentration in the cytoplasm as it did in the periplasmic space. The 3D distribution of TET is also shown in Figure 4. The dosed TET (yellow) was localized inside the individual E. coli cells (devoid of blue Si signal) and was detected not only at the surface, but was found after the first 400 nm of material has been removed. ToF-SIMS therefore holds the promise of being able to detect exogenous compound localization to the periplasm and cytoplasm, raising the possibility that subcellular accumulation can be compared within scaffolds to inform structure–activity relationships.
Figure 3.
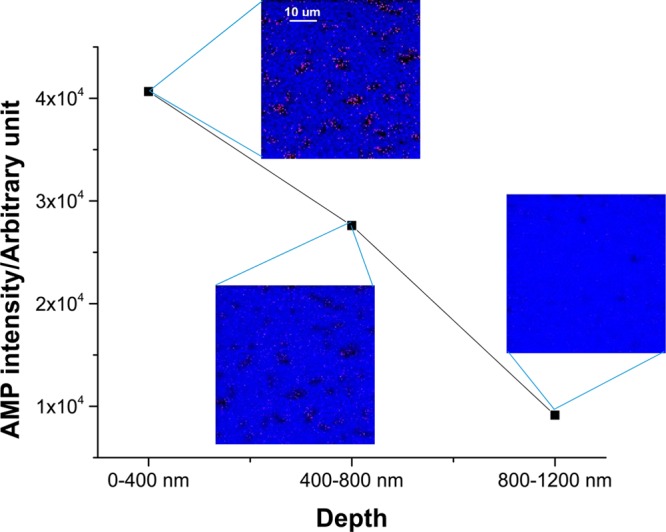
3D depth profiling of AMP signal in single E. coli cells. The insets are color overlay images of AMP (mapped by summing the molecular ion, m/z 350.1, and fragment ion, m/z 192.1, pink) and Si (mapped by m/z 167.9, blue) signal at different depths of AMP-treated (20 μg/mL) E. coli cells. The chemically resolved images at different depths demonstrated AMP was predominantly located in the first 400 nm depth of the E. coli cells.
Figure 4.
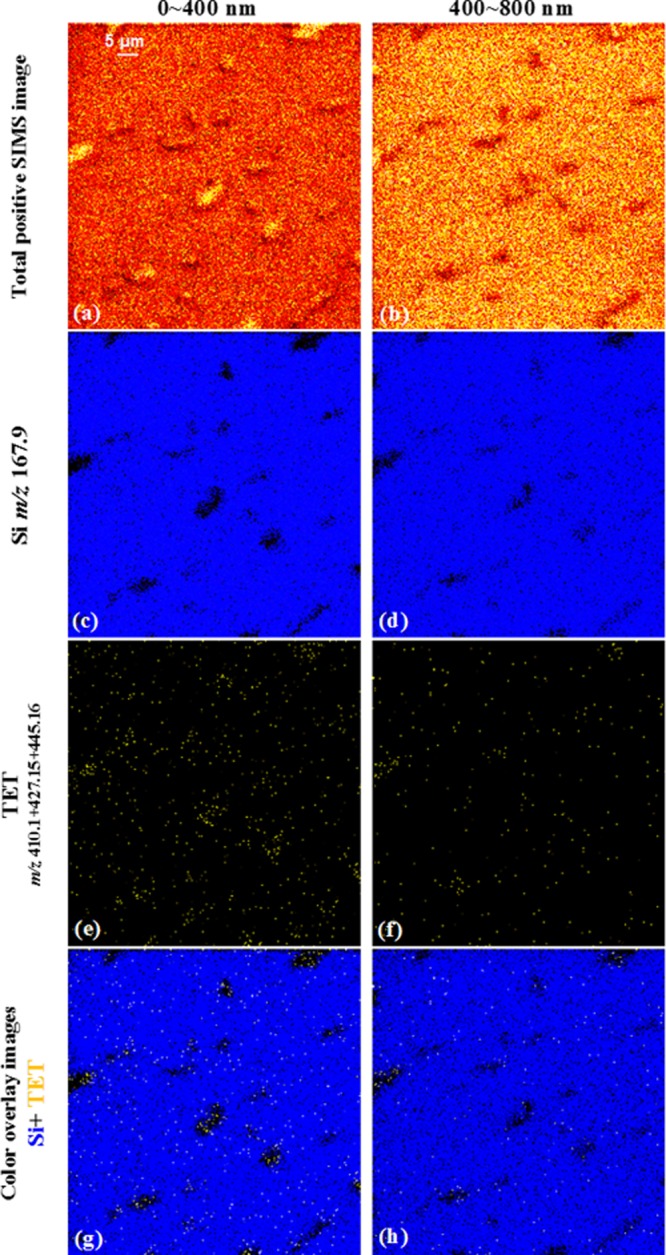
Total and selected SIMS images show the localization of TET signal to individual E. coli. The bacteria were cultured on Si and treated with 20 μg/mL TET. The total positive ion images in (a, b) show the outline of bacteria undergoing beam erosion from top surface to the depth of 800 nm. The distribution of Si (mapped by m/z 167.9) and TET (mapped by summing the molecular ion with fragments at m/z 410.1, 427.2, and 445.2) from top to the depth of 800 nm are in (c)–(f). The signal overlay images in (g) and (h) demonstrate colocalization of TET (yellow) to E. coli, represented by the black regions within the Si (blue) background.
Effect of TetA Efflux Pump on TET Accumulation
To validate the bacterial ToF-SIMS compound detection system, it would be of high value to determine whether or not there is a correlation between subcellular antibiotic accumulation in E. coli strains and susceptibility to the antibiotics. One challenge is to account for variation of individual cells, which may exhibit an inherently different response due to stochastic fluctuations, for example, in TetA efflux pump transcription and translation.
As a preliminary experiment, antibiotics in E. coli were interrogated by ToF-SIMS using an isogenic strain pair: E. coli containing a vector constitutively expressing the TetA efflux pump or the vector control. The TetA efflux pump moves TET from the cytoplasm into the periplasm, where it has no antibacterial activity.45 Periplasmic TET can be further removed from the periplasm by TolC-dependent efflux pumps or by diffusion through porins, depending on the gradient. In E. coli K-12 BW251103, the constitutive expression of the TetA efflux pump results in a 32-fold reduction in TET susceptibility, as measured by a broth microdilution assay for antimicrobial activity.
The E. coli strains (vector control and TetA) were incubated with TET at 20 and 180 μg/mL, washed, frozen, and subjected to depth profiling as described above. The 20 μg/mL concentration was chosen because it was above the lower threshold of detection and showed antimicrobial activity against the vector control strain, but not the TetA expressing strain; 180 μg/mL TET demonstrated activity against both strains. The results showed that TET signal was present at all depths of both strains. A statistical analysis of TET signal levels at each depth for the two strains is shown in Table 2. In both strains, TET signal was higher with higher doses of TET. At both TET doses, the average TET signal per pixel was higher in the E. coli vector control cells than in the cells expressing the TetA efflux pump in the first 400 nm depth of the cells. The trend was the same for the 400–800 nm depth. Although there was a clear bias toward a higher signal in the vector control cells, the values are not statistically different at the 1σ uncertainly level. Whether these data are influenced by stochastic fluctuations associated with the cells themselves, or by simple statistical uncertainty, is not yet clear. At this point, the signal levels are too low to be able to elucidate stochastic effects versus biological differences with statistical certainty, but there may be enough response to suggest that cell-to-cell variations may be eventually examined using this approach.
Table 2. SIMS Signal from Two Doses of TET Incubated with E. coli Vector Control and Vector Expressing the TetA Tetracycline Efflux Pump.
| drug
signal (m/z 410 + 427 + 445) counts/pixel ±
weighted STDEV |
|||
|---|---|---|---|
| dose of TET (μg/mL) | depth (nm) | TetA | vector control |
| 0 | 0–400 | 8.8 ± 2.3 | 8.1 ± 6.0 |
| 400–800 | 7.0 ± 2.5 | 7.9 ± 5.1 | |
| 20 | 0–400 | 9.1 ± 6.8 | 15.2 ± 6.3 |
| 400–800 | 6.2 ± 6.6 | 7.0 ± 4.8 | |
| 180 | 0–400 | 20.1 ± 7.6 | 26.4 ± 12.2 |
| 400–800 | 14.8 ± 10.2 | 23.5 ± 9.8 | |
Conclusion and Outlook
We report the first direct localization of unlabeled antibiotic molecules in single E. coli cells. We show a dose–response of TET and AMP in E. coli cell aggregates using cluster ToF-SIMS imaging. The imaging provided evidence that both antibiotics were localized within the E. coli cells. The data indicated a nonlinear increase of antibiotic signal in response to increased exposure in E. coli cell aggregates. The observation was further validated by comparison of TET accumulation in isogenic E. coli strains differing in TET susceptibility due to the presence or absence of TET-specific efflux by TetA. For this pair of strains, TET accumulation measured with ToF-SIMS was consistent with the function of TetA efflux in reduced susceptibility to TET.
The methodology described here lays the groundwork for the study of compound localization in subcellular compartments using cluster ToF-SIMS imaging, the only label-free technique to track endogenous and exogenous small molecules in complex biological systems with high spatial resolution and high sensitivity. The analysis shown here may be able to guide the structure–activity relationship of compound accumulation and disposition in bacteria, for which no models currently exist.50 The ability of ToF-SIMS to detect compounds in bacteria, the approximate size of mitochondria, represents a significant technological advance beyond applying ToF-SIMS imaging to mammalian cells.51,52 The development of low-damage gas cluster ion beams and further enhancement in ionization capability could expand the opportunities for this technique as a valuable analytical tool for biological and pharmaceutical sciences.
Acknowledgments
The authors acknowledge the infrastructure support by U.S. National Institute of Health (NIH) Grant 5R01GM113746–21. We highly appreciate the efforts of Dr. Jay Tarolli in developing the software for the statistical analysis, acknowledge Meena Sachdeva and Katie Prosen for strain construction and analysis, acknowledge Louis Metzger and Bill Pasutti for preparing the bacterial lysate, and are thankful to Christopher Rath and Jennifer Campbell for critical reading of the manuscript.
Supporting Information Available
The Supporting Information is available free of charge on the ACS Publications website at DOI: 10.1021/acs.analchem.7b00466.
Section 1: Protocol of ToF-SIMS characterization of ampicillin and tetracycline; Section 2: Detection limit of antibiotics standards using ToF-SIMS; Section 3: Stability study of antibiotics during C60+ depth profiling; Section 4: Depth resolution with different C60+ ion doses; Section 5: Biomarker detection from E. coli; Section 6: Software development for the statistical study; Section 7: Time course study of AMP and TET response in E. coli wild-type strain using cryo-SEM; Section 8: Comparison of the average antibiotic signal levels in E. coli aggregates and bare Si surface around E. coli; Section 9: Comparison of the average antibiotic signal levels in single E. coli cells and bare Si surface around E. coli (PDF)
The authors declare the following competing financial interest(s): D.A.S., T.K., and J.A.L. are employees of, receive a salary from, and hold restricted stock units in Novartis. N.W. and H.T. were supported in part by an external collaboration sponsored by Novartis.
Supplementary Material
References
- Vasoo S.; Barreto J. N.; Tosh P. K. Mayo Clin. Proc. 2015, 90, 395–403. 10.1016/j.mayocp.2014.12.002. [DOI] [PubMed] [Google Scholar]
- Nathan C.; Cars O. N. Engl. J. Med. 2014, 371, 1761–1763. 10.1056/NEJMp1408040. [DOI] [PubMed] [Google Scholar]
- Laxminarayan R.; Duse A.; Wattal C.; Zaidi A. K. M.; Wertheim H. F. L.; Sumpradit N.; Vlieghe E.; Levy Hara G.; Gould I. M.; Goossens H.; Greko C.; So A. D.; Bigdeli M.; Tomson G.; Woodhouse W.; Ombaka E.; Peralta A. Q.; Qamar F. N.; Mir F.; Kariuki S.; et al. Lancet Infect. Dis. 2013, 13, 1057–1098. 10.1016/S1473-3099(13)70318-9. [DOI] [PubMed] [Google Scholar]
- Umland T. C.; Schultz L. W.; Russo T. A. Future Microbiol. 2014, 9, 1113–1116. 10.2217/fmb.14.72. [DOI] [PubMed] [Google Scholar]
- Liu Y.-Y.; Wang Y.; Walsh T. R.; Yi L.-X.; Zhang R.; Spencer J.; Doi Y.; Tian G.; Dong B.; Huang X.; Yu L.-F.; Gu D.; Ren H.; Chen X.; Lv L.; He D.; Zhou H.; Liang Z.; Liu J.-H.; Shen J. Lancet Infect. Dis. 2016, 16, 161–168. 10.1016/S1473-3099(15)00424-7. [DOI] [PubMed] [Google Scholar]
- Melander R. J.; Selwood D. L. Chem. Biol. Drug Des. 2015, 85, 1–3. 10.1111/cbdd.12482. [DOI] [PubMed] [Google Scholar]
- Harbarth S.; Theuretzbacher U.; Hackett J.; Consortium D.-A. J. Antimicrob. Chemother. 2015, 70, 1604–1607. 10.1093/jac/dkv020. [DOI] [PubMed] [Google Scholar]
- Li X.-Z.; Plesiat P.; Nikaido H. Clin. Microbiol. Rev. 2015, 28, 337–418. 10.1128/CMR.00117-14. [DOI] [PMC free article] [PubMed] [Google Scholar]
- Stavenger R. A.; Winterhalter M. Sci. Transl. Med. 2014, 6, 228ed7. [DOI] [PubMed] [Google Scholar]
- Nichols W. W. In Antibiotic Discovery and Development; Dougherty T. J., Pucci M. J., Eds.; Springer: New York, 2012; pp 849–879. [Google Scholar]
- O’Shea R.; Moser H. E. J. Med. Chem. 2008, 51, 2871–2878. 10.1021/jm700967e. [DOI] [PubMed] [Google Scholar]
- Macielag M. J. In Antibiotic Discovery and Development; Dougherty T. J., Pucci M. J., Eds.; Springer: New York, 2012; pp 793–820. [Google Scholar]
- Six D. A.; Yuan Y.; Leeds J. A.; Meredith T. C. Antimicrob. Agents Chemother. 2014, 58, 153–161. 10.1128/AAC.01804-13. [DOI] [PMC free article] [PubMed] [Google Scholar]
- Zimmermann W.; Rosselet A. Antimicrob. Agents Chemother. 1977, 12, 368–372. 10.1128/AAC.12.3.368. [DOI] [PMC free article] [PubMed] [Google Scholar]
- Plesiat P.; Nikaido H. Mol. Microbiol. 1992, 6, 1323–1333. 10.1111/j.1365-2958.1992.tb00853.x. [DOI] [PubMed] [Google Scholar]
- Kojima S.; Nikaido H. Proc. Natl. Acad. Sci. U. S. A. 2013, 110, E2629–2634. 10.1073/pnas.1310333110. [DOI] [PMC free article] [PubMed] [Google Scholar]
- Smith M. C.; Chopra I. Antimicrob. Agents Chemother. 1983, 23, 175–178. 10.1128/AAC.23.1.175. [DOI] [PMC free article] [PubMed] [Google Scholar]
- Bazile S.; Moreau N.; Bouzard D.; Essiz M. Antimicrob. Agents Chemother. 1992, 36, 2622–2627. 10.1128/AAC.36.12.2622. [DOI] [PMC free article] [PubMed] [Google Scholar]
- Ito T.; Kojima K.; Koizumi K.; Nagano H.; Nishino T. Biol. Pharm. Bull. 1994, 17, 927–930. 10.1248/bpb.17.927. [DOI] [PubMed] [Google Scholar]
- de Cristobal R. E.; Vincent P. A.; Salomon R. A. J. Antimicrob. Chemother. 2006, 58, 31–36. 10.1093/jac/dkl172. [DOI] [PubMed] [Google Scholar]
- Thanassi D. G.; Suh G. S.; Nikaido H. J. Bacteriol. 1995, 177, 998–1007. 10.1128/jb.177.4.998-1007.1995. [DOI] [PMC free article] [PubMed] [Google Scholar]
- Li X. Z.; Nikaido H.; Poole K. Antimicrob. Agents Chemother. 1995, 39, 1948–1953. 10.1128/AAC.39.9.1948. [DOI] [PMC free article] [PubMed] [Google Scholar]
- Williams K. J.; Piddock L. J. J. Antimicrob. Chemother. 1998, 42, 597–603. 10.1093/jac/42.5.597. [DOI] [PubMed] [Google Scholar]
- Buyck J. M.; Plesiat P.; Traore H.; Vanderbist F.; Tulkens P. M.; Van Bambeke F. Clin. Infect. Dis. 2012, 55, 534–542. 10.1093/cid/cis473. [DOI] [PubMed] [Google Scholar]
- Renggli S.; Keck W.; Jenal U.; Ritz D. J. Bacteriol. 2013, 195, 4067–4073. 10.1128/JB.00393-13. [DOI] [PMC free article] [PubMed] [Google Scholar]
- Zhou Y.; Joubran C.; Miller-Vedam L.; Isabella V.; Nayar A.; Tentarelli S.; Miller A. Anal. Chem. 2015, 87, 3579–3584. 10.1021/ac504880r. [DOI] [PubMed] [Google Scholar]
- Cai H.; Rose K.; Liang L.-H.; Dunham S.; Stover C. Anal. Biochem. 2009, 385, 321–325. 10.1016/j.ab.2008.10.041. [DOI] [PubMed] [Google Scholar]
- Bhat J.; Narayan A.; Venkatraman J.; Chatterji M. J. Microbiol. Methods 2013, 94, 152–158. 10.1016/j.mimet.2013.05.010. [DOI] [PubMed] [Google Scholar]
- Volkmer B.; Heinemann M. PLoS One 2011, 6, e23126. 10.1371/journal.pone.0023126. [DOI] [PMC free article] [PubMed] [Google Scholar]
- Lechene C. P.; Luyten Y.; McMahon G.; Distel D. L. Science 2007, 317, 1563–1566. 10.1126/science.1145557. [DOI] [PubMed] [Google Scholar]
- Li T.; Wu T.-D.; Mazeas L.; Toffin L.; Guerquin-Kern J.-L.; Leblon G.; Bouchez T. Environ. Microbiol. 2008, 10, 580–588. 10.1111/j.1462-2920.2007.01478.x. [DOI] [PMC free article] [PubMed] [Google Scholar]
- Doughty D. M.; Dieterle M.; Sessions A. L.; Fischer W. W.; Newman D. K. PLoS One 2014, 9, e84455. 10.1371/journal.pone.0084455. [DOI] [PMC free article] [PubMed] [Google Scholar]
- Berry D.; Mader E.; Lee T. K.; Woebken D.; Wang Y.; Zhu D.; Palatinszky M.; Schintimeister A.; Schmid M. C.; Hanson B. T.; Shterzer N.; Mizrahi I.; Rauch I.; Decker T.; Bocklitz T.; Popp J.; Gibson C. M.; Fowler P. W.; Huang W. E.; Wagner M. Proc. Natl. Acad. Sci. U. S. A. 2015, 112, E194–E203. 10.1073/pnas.1420406112. [DOI] [PMC free article] [PubMed] [Google Scholar]
- Saulou-Berion C.; Gonzalez I.; Enjalbert B.; Audinot J.-N.; Fourquaux I.; Jamme F.; Cocaign-Bousquet M.; Mercier-Bonin M.; Girbal L. PLoS One 2015, 10, e0145748. 10.1371/journal.pone.0145748. [DOI] [PMC free article] [PubMed] [Google Scholar]
- Fletcher J. S.; Rabbani S.; Henderson A.; Blenkinsopp P.; Thompson S. P.; Lockyer N. P.; Vickerman J. C. Anal. Chem. 2008, 80, 9058–9064. 10.1021/ac8015278. [DOI] [PubMed] [Google Scholar]
- Weibel D. E.; Lockyer N.; Vickerman J. C. Appl. Surf. Sci. 2004, 231, 146–152. 10.1016/j.apsusc.2004.03.098. [DOI] [Google Scholar]
- Mahoney C. M.Cluster Secondary Ion Mass Spectrometry: Principles and Applications; John Wiley and Sons, Inc.: NJ, 2013. [Google Scholar]
- Winograd N. Surf. Interface Anal. 2013, 45, 3–8. 10.1002/sia.4913. [DOI] [PMC free article] [PubMed] [Google Scholar]
- Green F. M.; Shard A. G.; Gilmore I. S.; Seah M. P. Anal. Chem. 2009, 81, 75–79. 10.1021/ac801352r. [DOI] [PubMed] [Google Scholar]
- Winograd N. Anal. Chem. 2005, 77, 142A–149A. 10.1021/ac053355f. [DOI] [PubMed] [Google Scholar]
- Winograd N. Anal. Chem. 2015, 87, 328–333. 10.1021/ac503650p. [DOI] [PMC free article] [PubMed] [Google Scholar]
- Fletcher J. S.; Rabbani S.; Henderson A.; Lockyer N. P.; Vickerman J. C. Rapid Commun. Mass Spectrom. 2011, 25, 925–932. 10.1002/rcm.4944. [DOI] [PubMed] [Google Scholar]
- Fletcher J. S.; Vickerman J. C.; Winograd N. Curr. Opin. Chem. Biol. 2011, 15, 733–740. 10.1016/j.cbpa.2011.05.016. [DOI] [PMC free article] [PubMed] [Google Scholar]
- Wikler M. A.; Cockerill F. R.; Bush K.. CLSI M100-S19 2009, 29.
- Roberts M. C. FEMS Microbiol. Rev. 1996, 19, 1–24. 10.1111/j.1574-6976.1996.tb00251.x. [DOI] [PubMed] [Google Scholar]
- Wucher A.; Tian H.; Winograd N. Rapid Commun. Mass Spectrom. 2014, 28, 396–400. 10.1002/rcm.6793. [DOI] [PMC free article] [PubMed] [Google Scholar]
- Shen K.; Wucher A.; Winograd N. J. Phys. Chem. C 2015, 119, 15316–15324. 10.1021/acs.jpcc.5b03482. [DOI] [Google Scholar]
- Toralli J. ImagingSIMS; https://github.com/ImagingSIMS/ImagingSIMS (accessed April 7th).
- Koutsoumanis K. P.; Lianou A. Appl. Environ. Microbiol. 2013, 79, 2294–2301. 10.1128/AEM.03629-12. [DOI] [PMC free article] [PubMed] [Google Scholar]
- Silver L. L. Bioorg. Med. Chem. 2016, 24, 6379–6389. 10.1016/j.bmc.2016.06.044. [DOI] [PubMed] [Google Scholar]
- Bloom A. N.; Tian H.; Winograd N. Biointerphases 2016, 11, 02A306. 10.1116/1.4939463. [DOI] [PMC free article] [PubMed] [Google Scholar]
- Passarelli M. K.; Newman C. F.; Marshall P. S.; West A.; Gilmore I. S.; Bunch J.; Alexander M. R.; Dollery C. T. Anal. Chem. 2015, 87, 6696–6702. 10.1021/acs.analchem.5b00842. [DOI] [PubMed] [Google Scholar]
Associated Data
This section collects any data citations, data availability statements, or supplementary materials included in this article.