


Abstract
Intermolecular interactions of ncRNAs are at the core of gene regulation events, and identifying the full map of these interactions bears crucial importance for ncRNA functional studies. It is known that RNA–RNA interactions are built up by complementary base pairings between interacting RNAs and high level of complementarity between two RNA sequences is a powerful predictor of such interactions. Here, we present RIsearch2, a large-scale RNA–RNA interaction prediction tool that enables quick localization of potential near-complementary RNA–RNA interactions between given query and target sequences. In contrast to previous heuristics which either search for exact matches while including G−U wobble pairs or employ simplified energy models, we present a novel approach using a single integrated seed-and-extend framework based on suffix arrays. RIsearch2 enables fast discovery of candidate RNA–RNA interactions on genome/transcriptome-wide scale. We furthermore present an siRNA off-target discovery pipeline that not only predicts the off-target transcripts but also computes the off-targeting potential of a given siRNA. This is achieved by combining genome-wide RIsearch2 predictions with target site accessibilities and transcript abundance estimates. We show that this pipeline accurately predicts siRNA off-target interactions and enables off-targeting potential comparisons between different siRNA designs. RIsearch2 and the siRNA off-target discovery pipeline are available as stand-alone software packages from http://rth.dk/resources/risearch.
INTRODUCTION
Non-coding RNAs (ncRNAs) have received increasing attention over the past decades. It has become clear that RNAs play a multitude of roles in cellular processes through their interactions with other RNAs, including the discovery of the catalytic abilities of RNAs (1) and the identification of wide-spread riboregulators, such as microRNAs (miRNAs) (2).
Different classes of RNAs have their specific type of RNA–RNA interactions. For example, in mammalian transcriptomes tRNA anticodons bind to codons on mRNAs (3); small nucleolar RNAs guide the post-transcriptional modification of rRNAs, tRNAs, snRNAs and mRNAs (4–6); snRNAs bind pre-mRNAs at splice sites, enabling the removal of intronic sequences from nascent mRNA transcripts (7); a class of long non-coding RNAs (lncRNAs) can trigger mRNA decay through binding to 3΄ UTRs (8); and miRNAs direct the translational repression or mRNA degradation via binding (predominantly) to 3΄ UTRs of mRNAs (9). Aside from these endogenous RNAs, small interfering RNAs (siRNAs), widely used in gene silencing studies, are loaded into the RNA-induced silencing complex (RISC), same as miRNAs, and guide it in binding and cleaving the transcripts of interest (10). However, these siRNAs also form off-target interactions with transcripts other than the intended target, promoting the so-called siRNA off-target effects, which can involve transcript degradation and transcriptional/translational repression (11).
Given that RNA–RNA interactions play such prominent roles in cells, predicting them on a large scale is of great interest in further understanding gene regulatory networks. This is also highly relevant for accurate interpretation of RNAi data generated by siRNA-mediated knockdown studies. However, generating a complete map of the RNA–RNA interactome in silico is challenging at several levels. RNA–RNA interactions come in many flavors, ranging from a few to several hundred base pairs, involving straightforward stem structures to complex 3D structures, some guided by seed formation and others not. Consequently, no computational method can efficiently model the full range of RNA–RNA interactions.
In addition, the general prediction of the joint secondary structure of two interacting RNAs is computationally expensive. Hence, simplifications and heuristics are required to make large-scale screens for RNA–RNA interactions feasible. A number of computational approaches are currently available for predicting RNA–RNA interactions between single sequences. They can be divided into different classes ranging from methods that neglect intramolecular structure, to those that do consider certain types of intramolecular interactions (see (12) for a thorough discussion). The fastest methods take only intermolecular base pairs into account. By limiting the size of bulges and internal loops to a maximum of  nucleotides, a time complexity of
  can be achieved for interacting sequences of lengths m and n as done in RNAhybrid (13). The prefactor l2 can be dropped when loops are approximated by affine functions as shown in RNAplex (14). Typically the target, e.g. a whole genome or transcriptome, is much larger than the query, thus, these methods are linear in time with respect to the target length. A further simplified energy model which maintains high accuracy for predicting near-complementary duplexes has been introduced by RIsearch (15).
Several other tools were designed specifically for miRNA target prediction, such as DIANA-microT (16), TargetScan (17), miRanda mirSVR (18,19), MIRZA (20) and MIRZA-G (21), some based on estimation of the hybridization free energy and some based on sequence features, often with emphasis on perfect pairing in the canonical seed region. These tools can also perform siRNA off-targets prediction, or more precisely, they can detect putative miRNA-like off-target interactions of siRNAs. One important indicator for functionality of the predicted miRNA target, commonly used by these tools, is information about its evolutionary conservation. However, this feature is not relevant for siRNA off-target predictions due to the synthetic nature of siRNAs. The existing prediction tools are mainly intended for performing predictions along 3΄ UTR regions, therefore, they are infeasible to apply in whole-genome (or transcriptome) screens which can reveal the true off-targeting potential of transfected siRNAs more accurately.
Here, we address the huge challenge of searching full-size genomes and transcriptomes for the type of RNA–RNA interactions requiring a seed (a stretch of complementary base pairs) within the interaction itself. We present a novel method, RIsearch2, using a seed-and-extend strategy. In its first step, indices of query and target sequences (typically a genome) are built and seed matches are located by using suffix arrays. In the second step, these seeds of complementary RNAs are extended with a dynamic programming (DP) approach using our simplified energy model for near-complementary RNA–RNA interactions. Although the basis of the two steps are the algorithmic concepts underlying GUUGle (22) and RIsearch, these are here deeply integrated in a single efficient method. This efficient implementation ensures the energy (and not just the match itself) of each identical seed match is only computed once, and that the DP computation is directly anchored on the seed sequences. To our knowledge, RIsearch2 is the first RNA–RNA interaction prediction tool using a seed-and-extend framework based on suffix arrays.
We furthermore use the RIsearch2 method to address the challenge of discovering siRNA off-targets. Sequence-specific off-target effects of an siRNA are caused by unintended interactions between the transfected siRNA and functional transcripts other than the intended target transcript (23). These off-target interactions can cause cleavage of off-targeted transcripts with near-perfect complementarity or can trigger miRNA-like silencing, often mediated by the presence of specific complementary seed sequences in the 5΄ end of the siRNA (24). Given the multiple possibilities of forming stable interactions, off-target effects cannot be avoided in the choice of the siRNA sequence, but recognizing and minimizing these off-target effects is important for identifying the correct phenotypic outcome in gene knockdown experiments (25) or reducing side-effects in drug therapy (26,27). Typically, most siRNA design and efficiency prediction tools (28,29) focus on satisfying certain thermodynamic and positional criteria regarding the interaction with intended target and employ subsequent BLAST searches to detect siRNAs with potential off-targets (30). However, the recently published specificity-focused siRNA design tool siSPOTR (31) showed that efficient siRNAs can also be designed by avoiding sequences with high off-targeting potential. Here, we provide a pipeline based on RIsearch2, that not only detects individual siRNA off-targets, but also measures the overall genome- or transcriptome-wide off-targeting potential of a given siRNA, making it possible to compare the off-targeting potential of different siRNAs. Within the pipeline, in order to increase the robustness of the method, we combine RIsearch2 RNA–RNA interaction predictions with target site accessibility and target transcript abundance information.
MATERIALS AND METHODS
We first describe the RIsearch2 method and then its application on siRNA off-targets, for which we present the processing pipeline, as well as the siRNA transfection data and how it was used for validation.
RIsearch2 algorithm
While the first version (15) of RIsearch applied a Smith–Waterman–Gotoh-like algorithm (32), a DP approach based on filling the DP matrices along the entire input sequences, RIsearch2 follows the seed-and-extend paradigm. It is a two-stage strategy, that uses suffix arrays in the first step to locate maximal stretches of perfect complementarity (allowing for wobble pairs) and in the second step extends those seed matches on either end using DP with the scoring scheme introduced by RIsearch. The individual steps are described in the following.
Index construction
Prior to the first stage of the algorithm, target sequences (could be a whole genome or transcriptome) are converted into a suffix array index structure using the libdivsufsort 2.0 library (https://github.com/y-256/libdivsufsort). Here, we do not use a generalized suffix array where each sequence is padded with unique terminator symbols, but instead build a regular suffix array of the concatenated sequences, also explicitly storing the reverse complement sequences. Each entry in the suffix array is annotated with a serial number identifying the sequence from which the suffix originated. Additionally, we store the original nucleotides sequentially and independent of the suffix array (see Supplementary Figure S1).
The index is constructed in  time, where N is twice the number of nucleotides in the input sequences (as we explicitly store both strands). This is done once before the actual screen, and the resulting index is stored in a binary format on disk to be reused for any number of future runs. The file size is N ×64 bit plus some header information containing sequence names.
Match implementation
Instead of reversing the query (because two interacting RNA strands run in opposite directions) and finding complementary sequences, we match directly for identity to our target suffix array and consider the resulting hits as matches on the opposite (reverse complementary) strand. Therefore, we in the following consider exact matches as Watson–Crick pairs, and, in order to allow for G−U wobble pairs, we actually consider G−A and U−C matches as valid pairs (see Figure 1).
Figure 1.

Match implementation. A sample query sequence is given on top. (A) How an interaction to the target sense and antisense strand might look (complementary and in anti-parallel direction), and (B) how it is implemented within RIsearch2 (identical and in parallel direction). The highlighted bases correspond to G−U wobble pairs.
Seed requirement and query preparation
We define a seed of length l as a consecutive stretch of l complementary bases, allowing for canonical Watson–Crick pairs as well as the G−U wobble base pair. Seed requirements can be specified by minimum length and position within the query sequence to force a specific portion of the RNA query to base pair, e.g. the seed region of microRNAs. The query sequences are processed sequentially, and in parallel if multiple threads are used (enabled by the OpenMP API). Each query is converted into a partial suffix array where entries that violate the seed criteria are excluded from the matching stage. For example, if a seed is required to be of minimum length six and located within the first eight nucleotides, then only the suffixes starting from the first three positions of the sequence are considered in the next step (see Figure 2A–C).
Figure 2.

Suffix array preparation and matching. (A) The user provides a query (Q = ACUGCUAG of length m = 8) and specifies the seed by either length, position, or both. The command-line parameter -s 2:7/3 requires a seed to be at least 3 nt long and located between positions 2–7 of the query. This allows for only four valid seed start locations, indicated with the blue lines above the query sequence. This corresponds to positions 1–4 in the 0-based index being valid start positions that satisfy the seed requirements, colored blue. Seeds starting in any other position would violate the seed requirements and are colored red. (B) A suffix array of the query ( ) is constructed, containing the starting positions of suffixes of Q in lexicographical order.
  holds a running number; boxes are colored blue if the suffixes satisfy the seed requirements, red otherwise. Q is stored as the original sequence, regardless of the
  order. (C) Suffixes that violate the seed requirement (see A) are set to zero in
  and m in
  , pointing to the null terminator. The array is then re-sorted based on
  . This ensures that all discarded suffixes are moved to the beginning of the array, while all valid suffixes are still sorted in lexicographical order. (D) The target
  is built from the concatenated sequences, as shown in Supplementary Figure 1.
  is sorted according to
  order, while T is stored in order of the original sequence. For both query and target SA, we find the intervals of suffixes starting with each nucleotide. In the example, we show the suffixes starting with C and further traverse both SAs as long as there are corresponding non-empty intervals (between (C) and (D)), until the minimum seed length is reached. We find two positions in the target that match the CUG in the query, highlighted in light green and blue respectively. Note that the query suffix CUAG would also match the target CUA, but not CUG. (E) The match with
  2 (light green) refers to a target site in the reverse complement sequence 3, and likewise
  1 to a target site in 0 (light blue).
Parallel suffix array matching
The matching is performed by traversing the target and query suffix arrays in parallel to locate perfect complementary suffixes with a minimum length specified by the seed criteria. In each step, binary search is used to determine the intervals that contain all suffixes sharing a given prefix. Only intervals that represent valid base pairs are recursively explored in depth-first order (see Figure 2C and D). Matching intervals that span a single target sequence and cannot be extended further with valid base pairing on that target, are converted into actual sequence indices only if they have reached the minimum length. These indices naturally represent the seed locations in query and target sequences. For target sequences, the actual matches are found on the opposite strand as illustrated in Figure 2E and previously described in subsection ‘Match implementation’.
Seed extension
For all identified seeds, the matching region (up to a user-defined distance from the seed match) is extended and the hybridization energy is computed by using the simplified energy model of RIsearch (15). This is done by filling the usual DP matrices for flanking regions up- and downstream of the seed region with the special requirement of having the first (last) base pair of the seed set and thereby anchoring the DP extension. For all hits passing the user-defined hybridization energy threshold, the actual interaction ‘alignment’ is found via backtracking through the DP matrix.
siRNA off-target discovery pipeline
Here, we present the siRNA off-target discovery pipeline, that can predict the off-target effects of a given siRNA and measure its off-targeting potential for RNAi applications in human. Note that this pipeline can easily be tuned for any other organism by simply replacing the input data. We describe the pipeline step by step in the following.
Predicting putative siRNA–RNA interactions
We identify all putative binding sites of a given siRNA with the RIsearch2 algorithm, using the whole repeat-masked human genome (hg19), as provided by the UCSC Genome Browser database (33), as a target sequence. All RIsearch2 parameters are subject to user preferences. In this study, we set the minimum seed length to 6 nt and limit the seed sequence to be located in the first 12 nt of the given siRNA. This seed setting is more relaxed than the widely accepted seed constraint of canonical miRNA interactions (position 2–7), in order to allow for prediction of non-canonical interaction pairs. Besides that, we set the hybridization energy threshold of RIsearch2 to −10 kcal/mol to filter out some of the low-confidence binding sites predicted on the whole genome. It has been shown that this cut-off value includes almost all of the miRNA binding sites as reported in TarBase version 4.0 (34,35). For our siRNA off-target discovery pipeline, we assume that the low-energy and non-seed-based interactions that are discarded do not affect the ranking of our computed off-targeting probabilities (see Equation 1). In the following we denote the set of the included interactions as  .
.
Intersection with transcriptomic data
Putative interaction data of the predicted binding sites is further intersected with transcriptomic data using the bedtools intersect function (36). In this way, we discard the interactions predicted in unexpressed regions, as well as assign position-specific abundance values to each predicted binding site. The motivation behind taking transcript abundances into account is to obtain a more accurate reconstruction of the off-target landscape, based on the following rationale: Given a certain concentration of siRNA in the cell and a particular transcript to which the siRNA can hybridize, the more abundant this transcript is in the cell, the higher the chances are for the siRNA to bind this target. Besides, it is also likely that a higher amount of siRNAs will be ‘wasted’ on it, which may further reduce the efficiency to silence the intended target. The source of transcriptomic data fed into the pipeline could be any of the genome-wide expression profiling techniques (e.g. microarray, RNAseq) as long as it includes genomic coordinates and abundance estimates for transcripts in one of the accepted formats (BED, GTF and GFF currently). For different analyses presented within this paper, we use different transcriptomic data sources that are described together with respective transfection datasets.
Partition function
Given all predicted interactions  of a single siRNA and their binding site abundance estimates, the off-target space of the siRNA is probabilistically modeled using the partition function from statistical mechanics, where each potential interaction between siRNA and expressed transcripts represents a micro-state. In this way, and with the help of the partition function, binding site-specific interaction probabilities are computed and further used to assess off-target effects.
The efficiency of an siRNA does not increase indefinitely with interaction energy but necessarily levels off for sufficiently strong, near-complementary siRNA–target interactions. To model this saturation effect we introduce two phenomenological parameters α and γ. Denoting the lowest possible binding energy of the siRNA under consideration with Emin, which is the hybridization energy of the perfect complementary interaction computed by RIsearch2, α determines the hybridization energy threshold beyond which siRNA efficiency does not increase further. The second parameter γ determines a common interaction energy value that is assigned to all such interactions. Default values for these parameters are set as α = 0.8 and γ = 0.8, and we present our results only under this parameter setting. For any predicted interaction i of a given siRNA, let us denote its hybridization energy with Ei, binding site abundance level with Ai, and binding site opening energy (accessibility) with Oi. Denoting the thermodynamic beta constant with β (=1/RT ≈ 1.62 mol/kcal at 37°C), the partition function Z of the siRNA and interaction probabilities pi are computed as follows.
 |
(1) |
Accessibility of binding sites
In the equations above, hybridization energies of all putative interactions are adjusted with opening energies to obtain the total free energies. The opening energy of an interaction is defined as the energy required to unfold the binding site region within the intramolecular structure of the target transcript. Instead of obtaining these energies from a secondary structure analysis performed on the given transcriptome data, which is computationally expensive, we have, once and for all, approximated them on genome-wide level. For this genome-wide accessibility analysis, we used RNAplfold (37) from the ViennaRNA Package 2.1.9 (38) to compute the approximate local opening energies for every region, up to a length of 30 nt, within the human genome (hg19). RNAplfold uses a sliding window approach, and we set the parameter for this window size to W = 80 and the maximum base pairing distance to L = 40, as recommended for siRNA inhibition efficiency predictions (39). Our siRNA off-target discovery pipeline assigns the opening energies from any given accessibility data. All results presented in this study are based on the genome-wide accessibility analysis as described here. However, any transcriptome-specific data can be provided as input to the pipeline.
Off-targeting probabilities
After computing the probabilities pi of all RIsearch2-predicted putative interactions, we sum up the interaction probabilities targeting the same transcript to obtain the transcript-specific siRNA targeting probability  for each off-target transcript j, and
  for the intended target transcript of the given siRNA. These
  and
and  values represent the probability that the given siRNA silences transcript j in competition with all other potential off- and on-target interactions. To quantify the overall off-targeting potential of a given siRNA, we report the sum of all off-target interaction probabilities
  .
.
siRNA transfection datasets
For the evaluation of our RIsearch2-induced siRNA off-target discovery pipeline, which is also an implicit evaluation of RIsearch2 itself, we focused on validating predicted off-target transcripts and off-targeting potential measures of individual siRNAs. For the former, we used the Burchard siRNA transfection dataset (40) to evaluate our results together with results generated by the state-of-the-art siRNA off-target prediction method MIRZA-G (21). For the latter, we used a compiled microarray dataset, obtained from the supplementary material of a published TargetScan study (41), and compared the performance of our method with another tool available, siSPOTR (31). In addition, we also used the Huesken (42) and DSIR (28) datasets to analyse the relationship between siRNA inhibition efficiency and off-targeting potential.
Dataset for validating individual off-targets
Burchard et al. (40) analyzed the off-target signatures of six different siRNAs, targeting the APOB gene, and one control siRNA, targeting the RAD18 gene, by carrying out the transfection experiments in two human cell lines and one mouse in vivo/cell line. RNA was extracted at 6, 12, 24 and 48 h upon transfection and gene expression was measured using microarrays. From this dataset, we only used the data corresponding to the two human cell lines, HUH7 and PLC/PRF/5, and the six siRNAs targeting the APOB gene. Their sequences (antisense strand) are given in Supplementary Table S1. We obtained the corresponding expression estimates and probeset annotation files from the Gene Expression Omnibus database (43), accession number GSE14073. To obtain the set of transcripts that is downregulated upon siRNA transfection, we performed differential expression analysis using the GEO2R interface (44). Since only one replicate was available per timestamp, we considered the 6 and 12 h samples as technical replicates and ignored the 24 and 48 h data to avoid detecting long-term pathway effects. For each cell line and each siRNA, we obtained the log2 fold changes (log2FC) of transcript expression levels between mock and siRNA transfection.
The initial set of transcripts present in the cell line and their abundances were approximated with expression measurements corresponding to the mock-transfection experiment at the 6 h post-transfection time point. We used the probe annotation files in order to retrieve corresponding transcript identifiers; and for each captured transcript, we obtained the genomic coordinates of the transcript exons with the help of exon coordinate files downloaded from the UCSC Table Browser (45). The set of transcripts is therefore limited to those (∼36 000 in total) that are captured with microarray probesets and can successfully be mapped to RefSeq, Ensembl, GenBank and dbEST identifiers in the UCSC Browser based on the May 2015 annotations.
In the following, we call this dataset the Burchard dataset. It has been used for validating the individual off-target transcripts of six siRNAs predicted by our pipeline and by MIRZA-G (21).
Off-targeting potential evaluation dataset
For the evaluation of off-targeting potential measurements computed with our pipeline and with siSPOTR (31), we used the dataset from supplementary material of the TargetScan context+ study (41), containing differential expression measurement data upon transfection of 175 unique sRNAs in HeLa cell lines. This is the same data used for testing and training purposes in the siSPOTR study (31). We only used a portion from this dataset, corresponding to 63 siRNAs, for two reasons. First, we excluded the siRNAs with no perfect complementary target since they were actually designed to assess positional mutations on the original siRNA design. Second, we only included the siRNAs that met the criteria for strand biasing in order to get loaded into the RISC complex, as well as the criteria of efficiency, regarding on-target silencing (>85%), as reported in the siSPOTR study (31). Sequences (antisense strand), target gene identifiers and array accession IDs of these siRNAs are given in Supplementary Table S2. The processed data made available only contains differential expression data (log2FC) for ∼18 000 transcripts between mock and siRNA transfection, therefore we do not have abundance estimates for the mock transfection study in order to approximate initial abundance levels as described for the previous dataset. Instead, we retrieved the baseline expression data of a HeLa cell line from ENCODE (GSM958735) in exon mapped RNAseq data format and fed this into our pipeline as initial transcript abundance levels when computing the off-targeting potential of these 63 siRNAs.
Evaluating siRNA off-target predictions
The performance of our pipeline and of MIRZA-G on detecting the real off-targets is evaluated by analysing the differential expression level (upon siRNA transfection) of top off-targets predicted for the six siRNAs from the Burchard dataset. For each method, we analyzed the log2FC distributions of top off-targets with the median fold changes approach as previously done for the evaluation of MIRZA-G (21). In this approach, for each off-target prediction method and siRNA, predicted off-target transcripts are sorted by their confidence scores ( in our case) in descending order. The median log2FC value of top n transcripts is obtained from the transfection dataset, for incremental values of n (1 ≤ n ≤ 300). To compare the methods over all siRNAs considered, median fold changes of all considered siRNAs are averaged for each value of n and plotted separately for each method. These functions over n represent the median performance of the siRNA off-target prediction methods. Similarly, we also evaluate the two methods with mean fold changes approach, by simply substituting the median log2FC values with mean log2FC values in order to reveal more information about the nature of the log2FC distributions. Lower median/mean fold changes reflect stronger downregulation of predicted off-targets, indicating a better performance of the prediction method. Lastly, we present another analysis to assess the capability of the two methods to detect critical off-targets within their top predictions. As critical off-targets we consider those transcripts that are strongly downregulated upon siRNA transfection, using varying log2FC thresholds to determine whether an off-target is critical. For each method and log2FC threshold, we plot the ratio of critical off-targets to the number of top predictions considered.
Evaluating siRNA off-targeting potential measurements
In the literature there seems to be no standard method to evaluate the overall off-target effect based on expression estimates before and after siRNA transfection, such as to evaluate the power of prediction methods. In the siSPOTR study, this evaluation is done by Spearman's rank correlation analysis between prediction- and expression-based rank-order of siRNAs. The former is dependent on the computed off-targeting potential measure  and the latter is derived from suppression signatures in large-scale expression data. Within the siSPOTR study, this siRNA-specific suppression signature is quantified as the number of downregulated (log2FC < −0.3, upon siRNA transfection) transcripts that in their 3΄ UTR contain a heptamer with perfect complementarity to the seed region (position 2–8) of the siRNA antisense sequence. Instead of performing the similar analysis with fixed log2FC threshold and perfect seed complementarity, we extend this approach to a broader evaluation. First, unlike siSPOTR, we also allow G−U wobble pairing between those heptamers; simply because G−U pairs are very common for miRNA seed regions (46) and this is very likely the case for siRNA–(off-)target interactions as well. Furthermore, instead of performing the rank correlation analysis with the fixed threshold approach used in the siSPOTR study, where the expression-based off-targeting potential measure is measured once with the given log2FC threshold (−0.03), we present several Pearson correlation analyses under different threshold settings. In the following, we use the term expression-based off-targets when referring to transcripts that contain a complementary heptamer and are differentially expressed with a log2FC value lower than a given threshold.
In addition, we present a similar correlation analysis with another expression-based off-targeting measure, the total differential expression of expression-based off-targets, i.e. the negative sum of their log2FC values. The reasoning behind this is, that an off-target transcript with a higher level of downregulation should contribute more to the expression-based overall off-targeting potential measure. We believe that this reflects the off-target suppression signatures more accurately, and provides additional insight in the reliability of the methods.
For a fair performance comparison between RIsearch2 and siSPOTR based on their off-targeting potential measure, here, we restricted our off-targeting potential computation from transcriptome-wide to 3΄ UTR only. This is due to the  measure being focused only on 3΄ UTRs. To compute our 3΄ UTR-restricted off-targeting potential measure
  for the 63 aforementioned siRNAs, we provided only the abundance of 3΄ UTRs in the initial transcriptome data input file when running the pipeline. Genomic coordinates for 3΄ UTRs were obtained from Ensembl (version 75) (47).
Investigating the relationship between inhibition efficiency and off-targeting potential of siRNAs
Inhibition (repression) efficiency of siRNAs is influenced by numerous siRNA design factors, however its relationship with off-target effects so far has never been investigated in detail. Here, we analyzed if off-targeting potential of an siRNA might be one of the key driving factors that determine its inhibition efficiency.
We performed our analysis on 1967 siRNAs, targeting 25 different genes, where their inhibition efficiencies were measured in H1299 cell lines (Huesken dataset (42)), and on 129 siRNAs, targeting 10 different genes, where inhibition efficiencies were measured in HeLa cell lines (DSIR dataset (28)). It should be noted that both datasets contain low, medium and high efficiency siRNAs designed for each of the targeted transcripts. As initial transcript abundance level estimates to feed into our pipeline, we retrieved the H1299 baseline expression data from the Expression Atlas (48) provided by Cancer Cell Line Encyclopedia (CCLE) and the HeLa baseline expression data from ENCODE, as described previously for the off-targeting potential evaluation dataset. Note that we discarded 464 siRNAs from the original Huesken dataset due to no expression data for the on-target genes that the siRNAs were designed for.
For both datasets, we analyzed the relationship between inhibitory activity and predicted off-targeting potential of siRNAs in two ways: mean efficiency analysis of top siRNAs, where ranking is based on off-targeting potential; and mean off-targeting potential analysis of top siRNAs when siRNAs are ranked by inhibition efficiency.
RESULTS
Predicting siRNA off-targets
For each of the six siRNAs from the Burchard dataset, we ran our RIsearch2-based off-target discovery pipeline separately for HUH7 and PLC/PRF/5 cell lines since these cell lines have different initial transcript abundance estimates, hence, different off-target signatures for the siRNAs when transfected. As discussed before, RNAplfold parameters were set to W = 80 and L = 40, RIsearch2 parameters to seed length of 6 in the first 12 nt of the siRNA (s = 1:12/6), and pipeline parameters α=γ= 0.8. Afterward, in order to perform off-target predictions with MIRZA-G, we obtained the target transcript sequences with the help of exon coordinate files that are priorly used to generate initial transcriptomic data for the two cell lines. For each transcript represented in the array, we obtained the full transcript sequences without any limitations on UTRs or CDS. Before performing MIRZA-G predictions with these transcript sequences, we modified the siRNA antisense sequences from the Burchard dataset by adding two additional As to the 3΄ end to complete them to 21 nt, as it is the procedure followed by the MIRZA-G study itself (21). Then, we ran the MIRZA-G program under default parameter settings and obtained the confidence scores of predicted off-target genes.
We analyzed the off-target prediction results generated by the two methods with median and mean fold changes analyses as described in ‘Materials and Methods’ section's subsection ‘Evaluating siRNA off-target predictions’. As can be seen in Figure 3A and B, the averaged mean and median value of log2FC distributions is consistently negative for either methods, indicating that transcripts top-predicted as off-targets with both methods tend to be downregulated upon siRNA transfection. The general performance of the two methods are quite close in median analysis, MIRZA-G performing better up to top ∼30, however, in the mean analysis the RIsearch2 pipeline clearly performs better due to the lower averaged mean log2FC values for predicted top off-targets. Median and mean analyses reflect different features of the log2FC distributions, and the advantage of RIsearch2 becomes apparent in the mean analysis. This left-skewed log2FC distribution of top off-targets predicted by RIsearch2 shows its capability to detect off-targets that do have stronger experimental support (stronger downregulation). This can also be seen in Supplementary Figure S2, in which results are shown for individual siRNAs. The alternative representation in Figure 3C clearly shows that top off-target predictions of RIsearch2 contain more critical off-targets than MIRZA-G predictions when critical off-targets were determined with the log2FC threshold given in the x-axis. Predicting such highly downregulated off-targets with high confidence scores is desirable, and hence, one can say that our pipeline outperforms the MIRZA-G method, for the dataset under consideration. Due to space limitations, we present the results for siRNA transfections in HUH7 cell line in Supplementary Figures S3 and S4. Nevertheless, it should be noted that all our findings here are also consistent with results for the HUH7 cell line.
Figure 3.

Evaluation of individual off-target predictions performed by RIsearch2 (siRNA off-targets pipeline) and MIRZA-G. All analyses are based on the Burchard dataset where six APOB siRNAs were transfected into PLC/PRF/5 cell lines. Top off-targets are selected from method-specific predictions based on the confidence scores generated by either method ( for RIsearch2). In the mean (A) and the median (B) fold changes analyses, mean/median differential expression level (averaged over all siRNAs) of top off-targets are plotted for different numbers of top off-targets considered. (C) Proportion of critical off-targets within the top (10, 50, 100) predictions generated by either method for six siRNAs, i.e. considering 60 transcripts in total for top 10. Off-targets are considered critical if they are downregulated, upon the transfection of siRNA, with a log2FC value lower than the threshold given in the x-axis.
In addition to this validation approach, we also investigated the correlation between transcript-specific log2FC values and off-targeting confidence scores that are generated by either method for PLC/PRF/5 cell line. Both Pearson's r and Spearman's ρ analyses (Supplementary Figures S5 and S6) show a stronger and more significant correlation for RIsearch2 than for MIRZA-G predictions. Thus, our  measure is a better predictor of the downregulation level of predicted off-target transcripts.
Validating off-targeting potential measures
Using our pipeline, we computed the 3΄ UTR-restricted off-targeting potential  of 63 siRNAs (with the same parameter settings as used for the Burchard dataset). To compare our results with siSPOTR, we retrieved the
  values, off-targeting potential measured by siSPOTR, from its supplementary material (31). We evaluated and compared the two methods with Pearson correlation analysis between expression-based and prediction-based off-targeting potential measures as described in the ‘Materials and Methods’ section's subsection ‘Evaluating siRNA off-targeting potential measurements’. In Figure 4, we plotted the Pearson correlation coefficients (only significant correlations are highlighted) between method-measured off-targeting potentials and threshold-specific expression-based off-targeting potentials. It shows a significant correlation between RIsearch2-based
  measure and number of expression-based off-targets (of the 63 siRNAs) for any log2FC threshold between −1.5 and −0.3. Note that it is the threshold that determines whether a transcript is considered as an expression-based off-target. However, for siSPOTR-based
  scores, correlation with the number of expression-based off-targets is significant only for thresholds larger than −0.5. This suggests that the RIsearch2-based off-targeting potential measure is more stable and promising than the siSPOTR-based measure, since our correlation with expression-based off-targeting potential measure is more resistant to changes in log2FC threshold and also stronger for most of the thresholds lower than −0.3, which is the threshold from the siSPOTR study. On the other hand, siSPOTR-based
  score is very strongly correlated with the number of expression-based off-targets for log2FC thresholds higher than −0.5, whereas
  measure is not. Lack of correlation for such thresholds is actually what should be expected from an off-targeting potential measurement method. Simply because siRNAs are expected to downregulate their off-target transcripts and as we increase the log2FC threshold in the correlation analysis, we start taking transcripts with no significant downregulation into consideration and expression-based off-targeting potential measure loses its rationale. In other words, this proves that siSPOTR-based
  score is only correlated with the siRNA-specific number of transcripts that have 3΄ UTR seed complementarity, regardless whether these transcripts are real off-targets or not. However, our
  measure is significantly correlated with expression-based off-targeting potential measures for several downregulation thresholds. In addition, we present the similar correlation analysis against another expression-based off-targeting potential measure (total differential expression of expression-based off-targets) in Supplementary Figure S7. Note that findings from both analyses are in good agreement with each other.
Figure 4.

Evaluation of predicted off-targeting potential measures with siRNA-specific differential expression data from 63 siRNA transfection experiments. Pearson's r is given for each correlation analysis between method-specific off-targeting potential measure, RIsearch2-based  or siSPOTR-based
  , and threshold-specific expression-based off-targeting potential measure of 63 siRNAs. The expression-based measure corresponds to the number of transcripts that have a complementary heptamer to the siRNA seed region in their 3΄ UTR and are differentially expressed upon siRNA transfection with a log2FC value lower than the threshold given on the x-axis. Only significant correlations (P-value < 0.05) are highlighted and the log2FC threshold −0.3, which is the evaluation threshold employed in the siSPOTR study, is shown with a dashed line.
Over all, our analysis shows that  score promises a more comprehensive and stable off-targeting potential measurement than the siSPOTR-based
  score when they are compared against the overall off-targeting trace left on gene expression levels (by fold change) upon siRNA transfection. However, our pipeline, in contrast to siSPOTR, is actually designed to measure the off-targeting potential of siRNAs in transcriptome-wide level. As described above, this is done by taking all potential binding sites of siRNAs into account whether it is within UTRs, CDSs or non-coding transcripts. Due to insufficient data and a lack of standard validation method, we cannot present any evaluation results on the transcriptome-wide
  measure.
Relationship between inhibition efficiency and off-targeting potential of siRNAs
We computed the  off-targeting potential score of 1967 siRNAs (Huesken dataset) and 129 siRNAs (DSIR dataset) with our pipeline using the same parameter settings as above. For each dataset, we used cell line-specific initial transcript abundance levels as discussed in the ‘Materials and Methods’ section. By using the
  scores and measured inhibition efficiencies of these siRNAs, we carried out four different mean analyses to investigate whether they are related to each other. We sorted the siRNAs based on their
  off-targeting potentials in increasing and decreasing order, and based on these rank-orders, we plotted the mean inhibition efficiency of top n siRNAs, for all values of n. Likewise, we also sorted the siRNAs based on inhibition efficiency and plotted
  scores.
Figure 5 shows these analyses for the Huesken (panels A and B) and DSIR (panels C and D) datasets. We ranked the siRNAs by the off-targeting potential measure  in increasing order from low to high while computing the mean inhibition efficiency of the top siRNAs. We note that this mean goes from high to low (orange curve in Figure 5A and C), indicating lower inhibition efficiencies for siRNAs with high predicted off-targeting potential. This suggests that siRNAs with lower efficiencies tend to have higher potential to repress transcripts other than their intended target and this might be the reason for their on-target deficiency. When we change the order of this ranking and sort the siRNAs from high to low
  , for both datasets, we see a weak increase in the mean inhibition efficiency of top siRNAs (blue curve in Figure 5A and C), which also supports our previous argument. As a reverse analysis, we ranked the siRNAs based on their inhibition efficiencies in increasing order from low to high efficiency, while computing the mean off-targeting potential of top siRNAs. Correspondingly, we note that the mean goes from high to low (orange curve in Figure 5B and D), indicating high off-targeting potential for low inhibition efficiencies, in both datasets. When siRNAs are ranked from high to low inhibition efficiency, we also see that mean
  measure of the top siRNAs goes from low to high (blue curve in Figure 5B and D), clearly indicating lower off-targeting potential for highly efficient siRNAs. Overall, these findings support the inverse relationship between off-targeting potential and inhibition efficiency of siRNAs. This suggests that the off-targeting potential of siRNAs might have impact on their inhibition efficiency.
Figure 5.

Relationship between inhibition efficiency (Inh.Eff.) and off-targeting potential measure  of siRNAs from Huesken (A and B) and DSIR (C and D) datasets. A and C show the mean Inh.Eff. of top n siRNAs when siRNAs are ranked by
  measure in increasing and decreasing order. B and D show the mean
  measure of top n siRNAs when siRNAs are ranked by Inh.Eff. in increasing and decreasing order. Note that y-axes are not in the same scale.
Repeating the same analysis with our 3΄ UTR-restricted off-targeting potential measure  also supports this inverse relationship between off-targeting potential and inhibition efficiency (see Supplementary Figure S8). In that analysis, using
  instead of
  resulted in slightly different off-targeting potential rankings for siRNAs considered. Considering the increasing support in literature for miRNA binding sites in regions other than 3΄ UTRs (49–52) and the fact that siRNAs use the same machinery as miRNAs, we believe that measuring the off-targeting potential over the whole transcriptome still provides a more comprehensive off-targeting assessment when comparing different siRNA designs.
Computational complexity
We implemented the siRNA off-target discovery pipeline as an independent software package, that accepts RIsearch2 interaction predictions and RNAplfold accessibility information as input. We executed the RIsearch2 and RNAplfold runs prior to the pipeline. For RIsearch2 runs, we screened our siRNA sequences against the whole repeat-masked human genome (hg19, including unplaced contigs and alternate haplotype assemblies, totaling 3 137 161 264 nt, thereof 1 430 387 259 non-N). Creating the index of the whole genome with RIsearch2 took 49 min single-core time on a single Intel© Xeon© CPU E5-2650 with 2.0 GHz. Storing this index required 47 GB of storage space and also at least as much RAM for subsequent RIsearch2 runs on this data. For 2431 siRNAs from the Huesken dataset, running RIsearch2 against the created hg19 index, with before-mentioned seed and energy threshold settings, took ∼7 h running 32 threads on two Intel© Xeon© CPU E5-2650 with 2.0 GHz. For the pre-computation of the genome-wide accessibility information with RNAplfold, we wrote a script that can divide the input sequences into 100-kb fragments, run the analysis for each subsequence, combine all generated RNAplfold results and pack them into a binary format. We run this script with 16 threads (thread per chromosome) on the same machine, and it took ∼40 h to get all the results (both strands). Storing these results required 176 GB storage. After precomputing these results, running the off-target discovery pipeline for 2431 Huesken siRNAs took ∼3.5 h, running 32 threads (thread per siRNA) on the same machine with two CPUs. However, it should be noted that, in this run, we did not compute the transcript-specific  off-targeting probabilities. Instead, we just reported the off-targeting potential of siRNAs. For the case where we report off-targeting probabilities of six siRNAs from the Burchard dataset, running the pipeline took ∼3 min, using six threads (thread per siRNA) on a single Intel© Xeon© CPU E5-2650 with 2.0 GHz.
In order to compare the running time of RIsearch2 with other currently available methods, we prepared a small test set since a genome/transcriptome-wide screen is not feasible with all of the methods. Within this small set, our query file includes 63 siRNAs, same as the siRNAs used for validating the off-targeting potential measure, and the target file is composed of 5982 transcripts and their antisense sequences, all longer than 80 nt, from human chromosome X. We ran the RNA–RNA interaction screens on this small set by using several energy- and/or accessibility-based methods: GUUGle, RIsearch, miRanda, PITA, IntaRNA, RNAplex, MIRZA-G and RIsearch2. We present the running times for these methods in Figure 6, detailed results including parameter settings are given in Supplementary Table S3. It shows that RIsearch2 is in general one to two orders of magnitude faster than the other methods. Surprisingly, GUUGle is also slower although it is limited to finding seed matches only, even compared to the slowest run of RIsearch2, which corresponds to the parameter setting that should find exactly the same seeds as GUUGle, but also compute the hybridization energy of the extended match. We also note that we in general are one to two orders of magnitudes faster than miRanda, although some settings is in the range of a half to one order of magnitude faster. For this and the other methods, however, a direct comparison is not possible as the programs follow different approaches with outset in different constraints.
Figure 6.
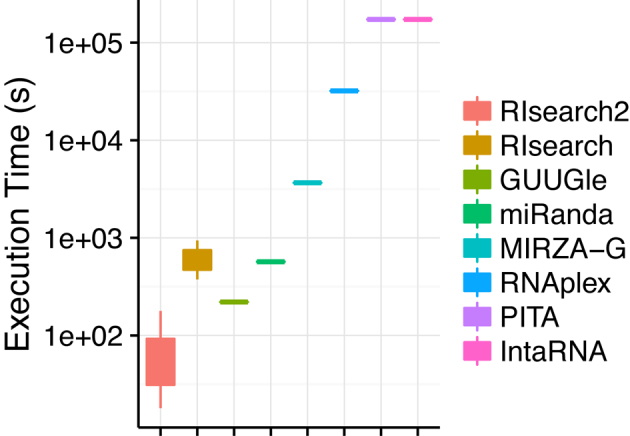
Execution time comparison of RNA–RNA interaction prediction tools on a small test set (63 siRNAs versus ∼6000 transcripts and their antisense). Executions involve different parameter settings of RIsearch2 and RIsearch methods and actual execution time of PITA and IntaRNA tools are longer than it is shown here (they have been aborted after running for more than 2 days).
DISCUSSION
Here, we presented RIsearch2, which is much faster than other existing methods for RNA–RNA interaction screens for siRNA off-targets, while using a highly suitable energy model ignoring intramolecular interactions. For predicting interactions between siRNAs and their off-targets, or miRNAs and their targets, the simplicity of this energy model is not a concern since siRNAs or miRNAs when binding their targets do not form intramolecular interactions. However, intramolecular interactions are a concern for the targeted transcripts. Within the siRNA off-target discovery pipeline, we take them into consideration by summing hybridization and opening energies to obtain the total free energies of the predicted bindings.
With the combination of RIsearch2 and the siRNA off-target discovery pipeline, we were able, at a full transcriptome-wide level in human, to compute off-targets as a combination of abundance and interaction strength through a partition function calculation. On essential benchmarks, we outperform MIRZA-G (21), to our knowledge the most recent tool for off-target discovery of specific off-target transcripts. In contrast to MIRZA-G, we find more transcripts that are significantly downregulated upon siRNA transfection as true off-targets on a substantial higher level.
Neither MIRZA-G nor our siRNA off-target discovery pipeline take the siRNA concentration into account simply because it is not needed, when ranking the off-target effects of single siRNAs. Obviously, for the pool of siRNAs induced in different concentration, this would make a difference, but this is not the case for data employed in this study.
Furthermore, our siRNA off-target discovery pipeline is, to our knowledge, the first tool capable of calculating siRNA off-targeting potentials on an entire human genome/transcriptome in the time scale of hours thanks to the large-scale prediction capabilities of RIsearch2. The only other tool we found for which larger siRNA off-target calculations have been made was siSPOTR (31). However, this tool is restricted to off-targeting potential calculations on 3΄ UTRs only. On benchmarking RIsearch2 on the same UTRs, we found that our off-target measure, in contrast to that of siSPOTR, has a more robust correlation to the overall off-targeting trace left on gene expression levels (by fold change) upon siRNA transfection. In addition, RIsearch2 made it possible to investigate the possible relationship between siRNA inhibition efficiency and off-targeting potential. Our analysis suggests that siRNAs with efficient inhibition tend to have a smaller off-target potential and vice versa.
It has been shown that the simplified energy model of RIsearch, predecessor of RIsearch2, in conjunction with a Smith–Waterman-like algorithm is effective in the search for near-complementary interactions, resulting in a method that was the fastest of its kind (15). However, in the same study, it has already been mentioned that the search space could be reduced by first identifying short stretches of complementarity, as e.g. GUUGle does, and only applying DP to extend such regions. By employing a novel integrated implementation, we have, with RIsearch2, successfully obtained a seed-and-extend method which is far more efficient than what is possible to obtain from any pipeline of GUUGle and RIsearch. Enabling user-defined seed and extension constraints and anchoring the dynaming programming on located seeds are some of the main novelties of this integration. Hence, with the speed-up of RIsearch2 over RIsearch and other methods, RIsearch2 holds an excellent potential as a filter in general RNA–RNA interaction screens. The RIsearch2 predictions could be fed directly into methods conducting more detailed RNA–RNA interaction predictions, and in turn also be combined with RNA–protein interactions (e.g. (53)).
Currently the data for verified RNA–RNA interactions are still sparse. For example, for miRNAs the specific interaction is often not known although CLIP-seq is contributing to elaborate more details on the location of the interaction but not necessarily the exact base pairs. This is known to be a challenge for the range of tools that have been developed specifically for miRNA target prediction (54). However more data are emerging (e.g. (55–58)) which will be useful for further efforts. With such data we will be able to get a more complete picture in regard to erroneous predictions.
RIsearch2 enables a new level of large-scale RNA–RNA interaction prediction with a number of possible applications. Together with the large amounts of sequencing data and methods to find novel non-coding RNAs and other data sources, performing large-scale interaction prediction for putative or real ncRNAs can provide the possibility of making hypothesis about RNA function. It has previously been shown that reliable RNA–RNA interactions can be used to infer the functional relationships of miRNAs (59). Hence, having such interaction data can be the basis for additional analysis in terms of discovering new ncRNAs and elucidating their roles in regulating cellular output. Future work can also include performing RNA–RNA interaction screens on genome-wide level by taking evolutionary conservation and accessibility of binding sites into account. Another future work may go in the direction of assigning p-values to our predictions by taking several factors into account, such as the conservation across multiple species (58). Accessibility of binding sites is also another information that could be integrated into such an approach. Yet another challenge for such an approach could be creating a good background model including analysis of randomized data.
As future direction for the siRNA off-target discovery pipeline, our findings show that there is room for a new specificity-oriented siRNA design method that will consider transcriptome-wide off-targeting potential measure as one of the key design principles. This would enable designing highly specific potent siRNAs that promise low-level off-target signatures specific to the tissue or cell line they are applied to. Currently siRNA off-target effects are avoided to some extent by using pooled siRNAs, therefore, another future direction might be to adapt the current pipeline to allow computing off-targeting potential scores for different siRNA pools. This would enable designing tissue (cell line) specific siRNA pools that promise low-level off-targeting noise on RNAi applications. However, since we currently take only transcript abundances into account within our partition function computation, and ignore siRNA concentrations, partition function computation would need further adjustments to compute off-targeting potential for siRNA pools. This could be relevant in fine tuning a design where the concentrations of different siRNAs might have different ranges of off-target effects.
Supplementary Material
ACKNOWLEDGEMENTS
We thank Christian Anthon for technical assistance and support. F.A. would like to thank Stefan Kurtz for a thorough introduction to suffix array data structures.
SUPPLEMENTARY DATA
Supplementary Data are available at NAR Online.
FUNDING
Danish Council for Independent Research (Technology and Production Sciences); Danish Center for Scientific Computing (DCSC/DEiC); Innovation Fund Denmark (Programme Commission on Strategic Growth Technologies) [0603-00320B]; Austrian FWF project ‘SFB F43 RNA regulation of the transcriptome’. Funding for open access charge: Innovation Fund Denmark.
Conflict of interest statement. None declared.
REFERENCES
- 1. Guerrier-Takada C., Gardiner K., Marsh T., Pace N., Altman S.. The RNA moiety of ribonuclease P is the catalytic subunit of the enzyme. Cell. 1983; 35:849–857. [DOI] [PubMed] [Google Scholar]
- 2. Bartel D.P. MicroRNAs: genomics, biogenesis, mechanism, and function. Cell. 2004; 116:281–297. [DOI] [PubMed] [Google Scholar]
- 3. Crick F. The origin of the genetic code. J. Mol. Biol. 1968; 38:367–379. [DOI] [PubMed] [Google Scholar]
- 4. Cavaillé J., Nicoloso M., Bachellerie J.P.. Targeted ribose methylation of RNA in vivo directed by tailored antisense RNA guides. Nature. 1996; 383:732–735. [DOI] [PubMed] [Google Scholar]
- 5. Kishore S., Stamm S.. The snoRNA HBII-52 regulates alternative splicing of the serotonin receptor 2C. Science. 2006; 311:230–232. [DOI] [PubMed] [Google Scholar]
- 6. Matera A.G., Terns R.M., Terns M.P.. Non-coding RNAs: lessons from the small nuclear and small nucleolar RNAs. Nat. Rev. Mol. Cell Biol. 2007; 8:209–220. [DOI] [PubMed] [Google Scholar]
- 7. Query C.C., Moore M.J., Sharp P.. Branch nucleophile selection in pre-mRNA splicing: evidence for the bulged duplex model. Genes Dev. 1994; 8:587–597. [DOI] [PubMed] [Google Scholar]
- 8. Gong C., Maquat L.E.. lncRNAs transactivate STAU1-mediated mRNA decay by duplexing with 3΄ UTRs via Alu elements. Nature. 2011; 470:284–288. [DOI] [PMC free article] [PubMed] [Google Scholar]
- 9. Ambros V. The functions of animal microRNAs. Nature. 2004; 431:350–355. [DOI] [PubMed] [Google Scholar]
- 10. Elbashir S.M., Harborth J., Weber K., Tuschl T.. Analysis of gene function in somatic mammalian cells using small interfering RNAs. Methods. 2002; 26:199–213. [DOI] [PubMed] [Google Scholar]
- 11. Jackson A.L., Burchard J., Schelter J., Chau B.N., Cleary M., Lim L., Linsley P.S.. Widespread siRNA ‘off-target’ transcript silencing mediated by seed region sequence complementarity. RNA. 2006; 12:1179–1187. [DOI] [PMC free article] [PubMed] [Google Scholar]
- 12. Backofen R. Gorodkin J, Ruzzo WL. Computational prediction of RNA–RNA interactions. RNA Sequence, Structure, and Function: Computational and Bioinformatic Methods. 2014; New York: Humana Press; 417–435.Vol. 1097 of Methods Mol. Biol.. [Google Scholar]
- 13. Rehmsmeier M., Steffen P., Höchsmann M., Giegerich R.. Fast and effective prediction of microRNA/target duplexes. RNA. 2004; 10:1507–1517. [DOI] [PMC free article] [PubMed] [Google Scholar]
- 14. Tafer H., Hofacker I.L.. RNAplex: a fast tool for RNA-RNA interaction search. Bioinformatics. 2008; 24:2657–2663. [DOI] [PubMed] [Google Scholar]
- 15. Wenzel A., Akbaşlı E., Gorodkin J.. RIsearch: fast RNA–RNA interaction search using a simplified nearest-neighbor energy model. Bioinformatics. 2012; 28:2738–2746. [DOI] [PMC free article] [PubMed] [Google Scholar]
- 16. Paraskevopoulou M.D., Georgakilas G., Kostoulas N., Vlachos I.S., Vergoulis T., Reczko M., Filippidis C., Dalamagas T., Hatzigeorgiou A.G.. DIANA-microT web server v5.0: service integration into miRNA functional analysis workflows. Nucleic Acids Res. 2013; 41:W169–W173. [DOI] [PMC free article] [PubMed] [Google Scholar]
- 17. Agarwal V., Bell G.W., Nam J.W., Bartel D.P.. Predicting effective microRNA target sites in mammalian mRNAs. eLife. 2015; 4:e05005. [DOI] [PMC free article] [PubMed] [Google Scholar]
- 18. Enright A.J., John B., Gaul U., Tuschl T., Sander C., Marks D.S.. MicroRNA targets in Drosophila. Genome Biol. 2003; 5, R1. [DOI] [PMC free article] [PubMed] [Google Scholar]
- 19. Betel D., Koppal A., Agius P., Sander C., Leslie C.. Comprehensive modeling of microRNA targets predicts functional non-conserved and non-canonical sites. Genome Biol. 2010; 11, R90. [DOI] [PMC free article] [PubMed] [Google Scholar]
- 20. Khorshid M., Hausser J., Zavolan M., van Nimwegen E.. A biophysical miRNA-mRNA interaction model infers canonical and noncanonical targets. Nat. Methods. 2013; 10:253–255. [DOI] [PubMed] [Google Scholar]
- 21. Gumienny R., Zavolan M.. Accurate transcriptome-wide prediction of microRNA targets and small interfering RNA off-targets with MIRZA-G. Nucleic Acids Res. 2015; 43:1380–1391. [DOI] [PMC free article] [PubMed] [Google Scholar]
- 22. Gerlach W., Giegerich R.. GUUGle: a utility for fast exact matching under RNA complementary rules including G-U base pairing. Bioinformatics. 2006; 22:762–764. [DOI] [PubMed] [Google Scholar]
- 23. Buehler E., Chen Y.C., Martin S.. C911: a bench-level control for sequence specific siRNA off-target effects. PLoS One. 2012; 7:e51942. [DOI] [PMC free article] [PubMed] [Google Scholar]
- 24. Singh S., Wu X., Ljosa V., Bray M.A., Piccioni F., Root D.E., Doench J.G., Boehm J.S., Carpenter A.E.. Morphological profiles of RNAi-induced gene knockdown are highly reproducible but dominated by seed effects. PLoS One. 2015; 10:e0131370. [DOI] [PMC free article] [PubMed] [Google Scholar]
- 25. Schmich F., Szczurek E., Kreibich S., Dilling S., Andritschke D., Casanova A., Low S.H., Eicher S., Muntwiler S., Emmenlauer M.. gespeR: a statistical model for deconvoluting off-target-confounded RNA interference screens. Genome Biol. 2015; 16, 220. [DOI] [PMC free article] [PubMed] [Google Scholar]
- 26. Jackson A.L., Linsley P.S.. Recognizing and avoiding siRNA off-target effects for target identification and therapeutic application. Nat. Rev. Drug Discov. 2010; 9:57–67. [DOI] [PubMed] [Google Scholar]
- 27. Boudreau R.L., Spengler R.M., Davidson B.L.. Rational design of therapeutic siRNAs: minimizing off-targeting potential to improve the safety of RNAi therapy for Huntington's disease. Mol. Ther. 2011; 19:2169–2177. [DOI] [PMC free article] [PubMed] [Google Scholar]
- 28. Vert J.P., Foveau N., Lajaunie C., Vandenbrouck Y.. An accurate and interpretable model for siRNA efficacy prediction. BMC Bioinformatics. 2006; 7, 520. [DOI] [PMC free article] [PubMed] [Google Scholar]
- 29. Ichihara M., Murakumo Y., Masuda A., Matsuura T., Asai N., Jijiwa M., Ishida M., Shinmi J., Yatsuya H., Qiao S. et al. Thermodynamic instability of siRNA duplex is a prerequisite for dependable prediction of siRNA activities. Nucleic Acids Res. 2007; 35:e123. [DOI] [PMC free article] [PubMed] [Google Scholar]
- 30. Birmingham A., Anderson E., Sullivan K., Reynolds A., Boese Q., Leake D., Karpilow J., Khvorova A.. A protocol for designing siRNAs with high functionality and specificity. Nat. Protoc. 2007; 2:2068–2078. [DOI] [PubMed] [Google Scholar]
- 31. Boudreau R.L., Spengler R.M., Hylock R.H., Kusenda B.J., Davis H.A., Eichmann D.A., Davidson B.L.. siSPOTR: a tool for designing highly specific and potent siRNAs for human and mouse. Nucleic Acids Res. 2013; 41:e9. [DOI] [PMC free article] [PubMed] [Google Scholar]
- 32. Gotoh O. An improved algorithm for matching biological sequences. J. Mol. Biol. 1982; 162:705–708. [DOI] [PubMed] [Google Scholar]
- 33. Rosenbloom K.R., Armstrong J., Barber G.P., Casper J., Clawson H., Diekhans M., Dreszer T.R., Fujita P.A., Guruvadoo L., Haeussler M. et al. The UCSC Genome Browser database: 2015 update. Nucleic Acids Res. 2015; 43:D670–D681. [DOI] [PMC free article] [PubMed] [Google Scholar]
- 34. Sethupathy P., Corda B., Hatzigeorgiou A.G.. TarBase: a comprehensive database of experimentally supported animal microRNA targets. RNA. 2006; 12:192–197. [DOI] [PMC free article] [PubMed] [Google Scholar]
- 35. Lekprasert P., Mayhew M., Ohler U.. Assessing the utility of thermodynamic features for microRNA target prediction under relaxed seed and no conservation requirements. PLoS One. 2011; 6:e20622. [DOI] [PMC free article] [PubMed] [Google Scholar]
- 36. Quinlan A.R., Hall I.M.. BEDTools: a flexible suite of utilities for comparing genomic features. Bioinformatics. 2010; 26:841–842. [DOI] [PMC free article] [PubMed] [Google Scholar]
- 37. Bernhart S.H., Hofacker I.L., Stadler P.F.. Local RNA base pairing probabilities in large sequences. Bioinformatics. 2006; 22:614–615. [DOI] [PubMed] [Google Scholar]
- 38. Lorenz R., Bernhart S.H., Honer Zu Siederdissen C., Tafer H., Flamm C., Stadler P.F., Hofacker I.L.. ViennaRNA Package 2.0. Algorithms Mol. Biol. 2011; 6:26. [DOI] [PMC free article] [PubMed] [Google Scholar]
- 39. Tafer H., Ameres S.L., Obernosterer G., Gebeshuber C.A., Schroeder R., Martinez J., Hofacker I.L.. The impact of target site accessibility on the design of effective siRNAs. Nat. Biotechnol. 2008; 26:578–583. [DOI] [PubMed] [Google Scholar]
- 40. Burchard J., Jackson A.L., Malkov V., Needham R.H., Tan Y., Bartz S.R., Dai H., Sachs A.B., Linsley P.S.. MicroRNA-like off-target transcript regulation by siRNAs is species specific. RNA. 2009; 15:308–315. [DOI] [PMC free article] [PubMed] [Google Scholar]
- 41. Garcia D.M., Baek D., Shin C., Bell G.W., Grimson A., Bartel D.P.. Weak seed-pairing stability and high target-site abundance decrease the proficiency of lsy-6 and other microRNAs. Nat. Struct. Mol. Biol. 2011; 18:1139–1146. [DOI] [PMC free article] [PubMed] [Google Scholar]
- 42. Huesken D., Lange J., Mickanin C., Weiler J., Asselbergs F., Warner J., Meloon B., Engel S., Rosenberg A., Cohen D. et al. Design of a genome-wide siRNA library using an artificial neural network. Nat. Biotechnol. 2005; 23:995–1001. [DOI] [PubMed] [Google Scholar]
- 43. Edgar R., Domrachev M., Lash A.E.. Gene Expression Omnibus: NCBI gene expression and hybridization array data repository. Nucleic Acids Res. 2002; 30:207–210. [DOI] [PMC free article] [PubMed] [Google Scholar]
- 44. Barrett T., Wilhite S.E., Ledoux P., Evangelista C., Kim I.F., Tomashevsky M., Marshall K.A., Phillippy K.H., Sherman P.M., Holko M. et al. NCBI GEO: archive for functional genomics data sets–update. Nucleic Acids Res. 2013; 41:D991–D995. [DOI] [PMC free article] [PubMed] [Google Scholar]
- 45. Karolchik D., Hinrichs A.S., Furey T.S., Roskin K.M., Sugnet C.W., Haussler D., Kent W.J.. The UCSC Table Browser data retrieval tool. Nucleic Acids Res. 2004; 32:D493–D496. [DOI] [PMC free article] [PubMed] [Google Scholar]
- 46. Brodersen P., Voinnet O.. Revisiting the principles of microRNA target recognition and mode of action. Nat. Rev. Mol. Cell Biol. 2009; 10:141–148. [DOI] [PubMed] [Google Scholar]
- 47. Flicek P., Amode M.R., Barrell D., Beal K., Billis K., Brent S., Carvalho-Silva D., Clapham P., Coates G., Fitzgerald S. et al. Ensembl 2014. Nucleic Acids Res. 2014; 42:D749–D755. [DOI] [PMC free article] [PubMed] [Google Scholar]
- 48. Petryszak R., Burdett T., Fiorelli B., Fonseca N.A., Gonzalez-Porta M., Hastings E., Huber W., Jupp S., Keays M., Kryvych N. et al. Expression Atlas update–a database of gene and transcript expression from microarray- and sequencing-based functional genomics experiments. Nucleic Acids Res. 2014; 42:D926–D932. [DOI] [PMC free article] [PubMed] [Google Scholar]
- 49. Ballantyne M.D., McDonald R.A., Baker A.H.. lncRNA/MicroRNA interactions in the vasculature. Clin. Pharmacol. Ther. 2016; 99:494–501. [DOI] [PMC free article] [PubMed] [Google Scholar]
- 50. Hausser J., Syed A.P., Bilen B., Zavolan M.. Analysis of CDS-located miRNA target sites suggests that they can effectively inhibit translation. Genome Res. 2013; 23:604–615. [DOI] [PMC free article] [PubMed] [Google Scholar]
- 51. Liu G., Zhang R., Xu J., Wu C.I., Lu X.. Functional conservation of both CDS- and 3΄-UTR-located microRNA binding sites between species. Mol. Biol. Evol. 2015; 32:623–628. [DOI] [PubMed] [Google Scholar]
- 52. Xu W., San Lucas A., Wang Z., Liu Y.. Identifying microRNA targets in different gene regions. BMC Bioinformatics. 2014; 15(Suppl 7):S4. [DOI] [PMC free article] [PubMed] [Google Scholar]
- 53. Holmqvist E., Wright P.R., Li L., Bischler T., Barquist L., Reinhardt R., Backofen R., Vogel J.. Global RNA recognition patterns of post-transcriptional regulators Hfq and CsrA revealed by UV crosslinking in vivo. EMBO J. 2016; 35:991–1011. [DOI] [PMC free article] [PubMed] [Google Scholar]
- 54. Reyes-Herrera P.H., Ficarra E.. One decade of development and evolution of microRNA target prediction algorithms. Genomics Proteomics Bioinformatics. 2012; 10:254–263. [DOI] [PMC free article] [PubMed] [Google Scholar]
- 55. Lu Z., Zhang Q.C., Lee B., Flynn R.A., Smith M.A., Robinson J.T., Davidovich C., Gooding A.R., Goodrich K.J., Mattick J.S. et al. RNA duplex map in living cells reveals higher-order transcriptome structure. Cell. 2016; 165:1267–1279. [DOI] [PMC free article] [PubMed] [Google Scholar]
- 56. Wang J., Liu T., Zhao B., Lu Q., Wang Z., Cao Y., Li W.. sRNATarBase 3.0: an updated database for sRNA-target interactions in bacteria. Nucleic Acids Res. 2016; 44:D248–D253. [DOI] [PMC free article] [PubMed] [Google Scholar]
- 57. Pain A., Ott A., Amine H., Rochat T., Bouloc P., Gautheret D.. An assessment of bacterial small RNA target prediction programs. RNA Biol. 2015; 12:509–513. [DOI] [PMC free article] [PubMed] [Google Scholar]
- 58. Wright P.R., Richter A.S., Papenfort K., Mann M., Vogel J., Hess W.R., Backofen R., Georg J.. Comparative genomics boosts target prediction for bacterial small RNAs. Proc. Natl. Acad. Sci. U.S.A. 2013; 110:E3487–E3496. [DOI] [PMC free article] [PubMed] [Google Scholar]
- 59. Mørk S., Pletscher-Frankild S., Pallejà A., Gorodkin J., Jensen L.J.. Protein-driven inference of miRNA–disease associations. Bioinformatics. 2014; 30:392–397. [DOI] [PMC free article] [PubMed] [Google Scholar]
Associated Data
This section collects any data citations, data availability statements, or supplementary materials included in this article.