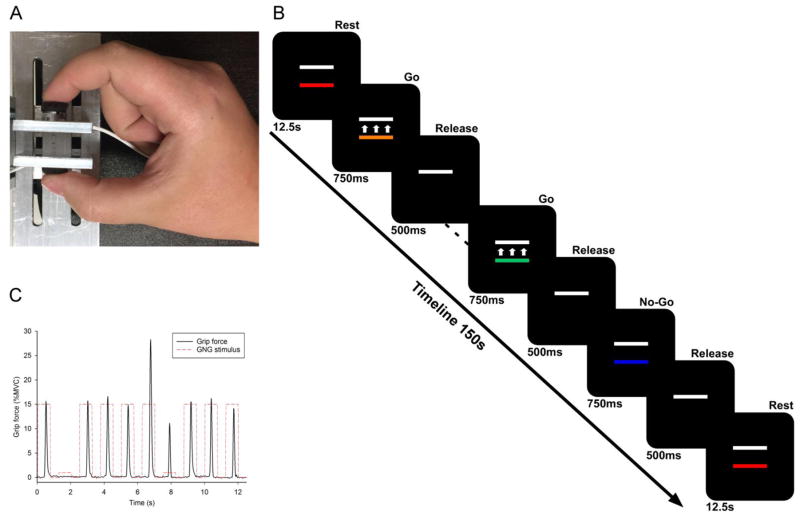
Figure 1.
(A) Participants used their thumb and index finger to grip against a custom-built force apparatus with identical button load cells. (B) The visual display consisted of two rectangular bars on a black background. A stationary, white target bar represented the target force amplitude. For each run, the target was normalized to 15% (low amplitude) or 60% (high amplitude) of the participant’s maximum voluntary contraction. A second colored bar moved up with increasing applied force and down with decreasing force. (C) The experimental time-series force data for 10 trials from an exemplar participant.

