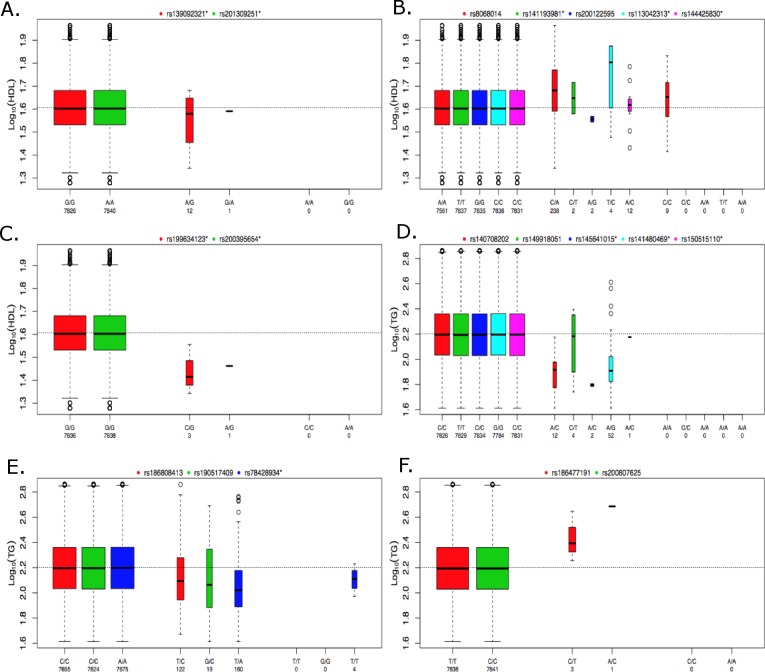
Figure 5. Boxplots of log10 phenotype versus genotype.
Boxplots are shown for genes (A) CNOT2, (B) HNF1B, (C) HPN-AS1, (D) SIRPD, (E) PAFAH1B2, and (F) UBE2L3. The boxplots are color coded for each variant and the number of samples for each genotype are indicated below the allele labels. Genotyped variants are indicated by an asterisk following the rsID. The width of the bars is proportional to the number of subjects in each group.

