Abstract
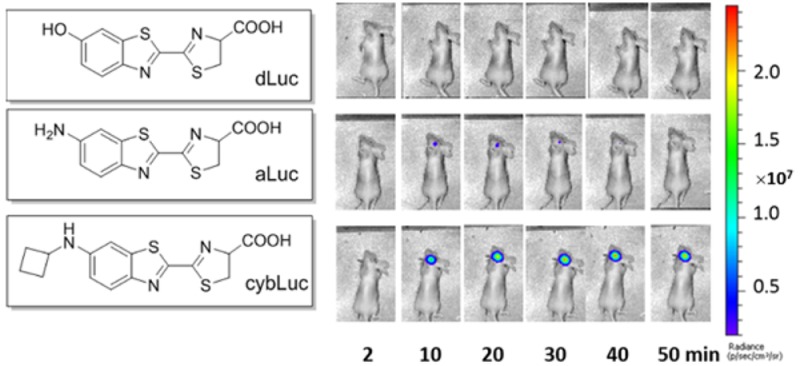
To enhance the efficiency of firefly luciferase/luciferin bioluminescence imaging, a series of N-cycloalkylaminoluciferins (cyaLucs) were developed by introducing lipophilic N-cycloalkylated substitutions. The experimental results demonstrate that these cyaLucs are effective substrates for native firefly luciferase (Fluc) and can produce elevated bioluminescent signals in vitro, in cellulo, and in vivo. It should be noted that, in animal studies, N-cyclobutylaminoluciferin (cybLuc) at 10 μM (0.1 mL), which is 0.01% of the standard dose of d-luciferin (dLuc) used in mouse imaging, can radiate 20-fold more bioluminescent light than d-luciferin (dLuc) or aminoluciferin (aLuc) at the same concentration. Longer in vivo emission imaging using cybLuc suggests that it can be used for long-time observation. Regarding the mechanism of cybLuc, our cocrystal structure data from firefly luciferase with oxidized cybLuc suggested that oxidized cybLuc fits into the same pocket as oxyluciferin. Most interestingly, our results demonstrate that the sensitivity of cybLuc in brain tumor imaging contributes to its extended application in deep tissues.
As a consistently sensitive, convenient, and noninvasive approach for understanding in vivo biology that facilitates the visualization of distinctive characteristics, bioluminescent imaging (BLI) has been comprehensively applied for monitoring pathogen detection, tumor growth, patterns of gene regulation in response to therapy, measuring protein–protein interactions, and other uses.1 The luciferin–luciferase system from the North American firefly (Photinus pyralis) is one of the principal bioluminescent systems found in insects.2 On the basis of this system, caged-luciferin analogues have been developed as highly responsive bioluminescent sensors for specific biomolecules, such as caspase,3 β-galactosidase,4 β-lactamase,5 aminopeptidase N,6 hydrogen peroxide,7,8 fluoride,9 and hydrogen sulfide.10 Although the general availability of various luciferase substrates is crucial for bioluminescent sensor development, the high selectivity and specificity between the enzyme and luciferin-based substrates limits the choice of new luciferase substrates. Most BLI studies rely exclusively on the native substrate d-luciferin (dLuc, 1, Figure 1) or its analogue, aminoluciferin (aLuc, 2, Figure 1), which can emit a realistic bioluminescent signal in the presence of firefly luciferase (Fluc), ATP, Mg2+, and O2. Therefore, a large pool of light-emitting Fluc substrates are required for various biological applications, such as probing or imaging biological processes.11
Figure 1.
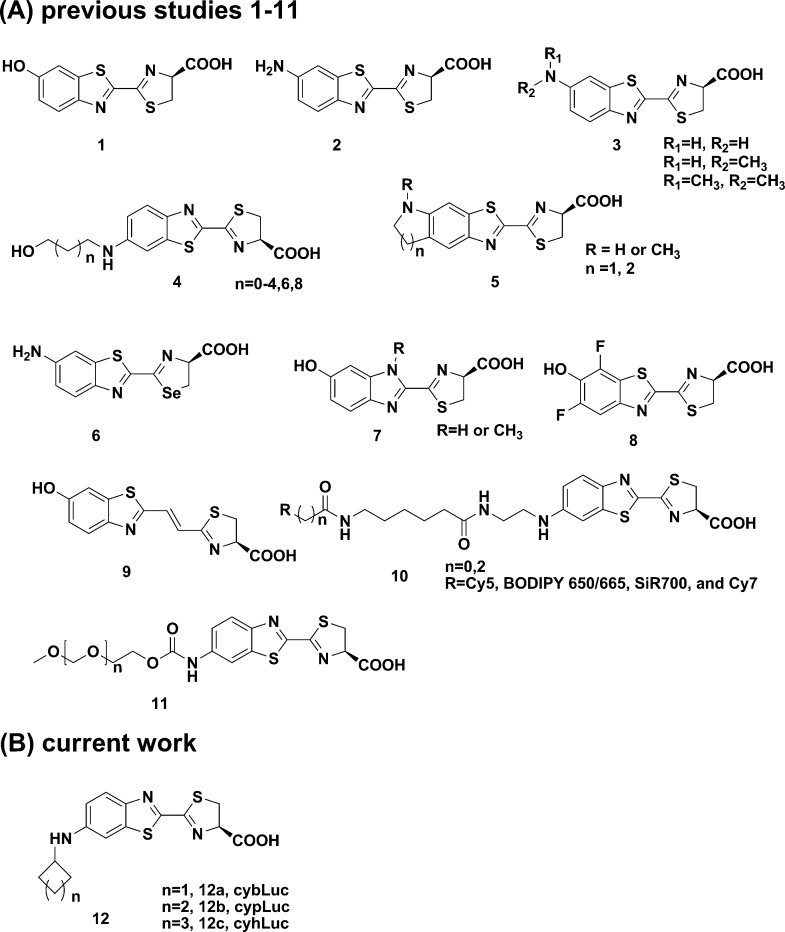
Structures of firefly luciferase substrates: (1) d-luciferin (dLuc); (2) aminoluciferin (aLuc); (3) aminoluciferin alkylated derivatives; (4) hydroxyalkyl aminoluciferins; (5) cyclic alkylaminoluciferins; (6) selenium-substituted aminoluciferin; (7) electronically modified luciferins; (8) pH-dependent difluoroluciferin (F2-Luc); (9) infra-luciferin; (10) near-infrared-emitting firefly luciferins; (11) PEG–luciferin; (12) N-cycloalkylaminoluciferins (cyaLucs) described in the current paper.
A known limitation of in vivo BLI experiments is the strong attenuation of bioluminescent signals that are emitted below 600 nm, which results from the absorption and scattering of light by tissue.12 Consequently, the applications of this system are restricted mainly to small animals and at superficial depths. In 1966, White et al. established that an amino group can replace the 6′-hydroxyl group of dLuc (1), resulting in aLuc (2),13 which emits light at 590 nm and has ∼10-fold higher affinity for luciferase than dLuc.14 Since then, modified luciferins have been widely developed (Figure 1); these include, for example, monoalkylated and dialkylated aminoluciferins (317 and 4(15)), conformation-restricted cyclic alkylaminoluciferin analogues (5),16,17 a selenium analogue of dLuc (6),18 electronically modified luciferins (7),19 pH-dependent difluoroluciferin (8),20 and red-shifted infra-luciferin (9) for various Fluc mutants.21 Moreover, cyclic alkylaminoluciferins (5) allow robust red-shifted light emission and overall light emission that is higher than that of dLuc.16 A recent report based on bioluminescence resonance energy transfer (BRET) described the development of an aminoluciferin NIR fluorophore (Cy5, BODIPY 650/665, SiR700, and Cy7) conjugate (10) that emits in the near-infrared region.22 This type of modification, however, alters the cellular uptake properties of the substrate and likely changes its biodistribution in vivo. Although these substrates can emit an intense initial burst of light similar to dLuc, they subsequently release much lower levels of sustained bioluminescence light output.
Another factor to consider is the relatively short circulatory half-life of luciferin in vivo. For example, Shinde et al. modified aLuc to glycine-aminoluciferin, which had a longer in vivo circulation time; yet the bioluminescent signals were attenuated.14 Gross et al. implanted microosmotic pumps into transgenic rats for continuous, long-term delivery of bioluminescent substrates,23 and Chandran et al. attached an aminoluciferin to poly(ethylene glycol) (PEG) (11, Figure 1) to improve tumor uptake via the enhanced permeability and retention (EPR) effect, thus allowing the possibility of long-term observations in animals.24 Although these studies solved the difficult problem of half-life to some extent, preparation of these compounds is too complicated for extensive applications, and thus a solution to this problem is still required.
The sensitivity of bioluminescence is one deficiency of the large-scale application of BLI because most available luciferins, such as dLuc, only possess a modest cell permeability. Even if these available luciferins have been widely applied to in vitro and in vivo imaging, they tend not to be the ideal substrate for imaging in deep tissues such as mouse brain. To enhance the permeability, one possible chemical strategy is to increase the lipophilicity and reduce the polarity of the molecule. For example, Evans et al. developed a cyclic alkylaminoluciferin (5, Figure 1) with improved sensitivity in vivo,25 while Kuchimaru et al. obtained an alkylated luciferin analogue AkaLumine–HCl with deep penetration and near-infrared emission.26 Moreover, recently Miller and co-workers introduced an FAAH-sensitive luciferin amides for brain bioluminescence imaging.27−29
With that starting point and constraining ourselves with the molecular weight and lipophilicity (ideally, logD 2.5 in consideration of the blood–brain barrier), we proposed to introduce lipophilic N-cycloalkyl groups onto aLuc shown in Scheme S1 as potential candidates to enhance the cell permeability,30,31 as well as to increase the bioluminescence sensitivity and to boost imaging in the brain. After evaluation, the bioluminescence sensitivities of the proposed N-cycloalkylaminoluciferins (cyaLucs, 12, Figure 1) exhibited properties superior to those of dLuc and aLuc in vitro and in vivo. Moreover, cyaLucs allowed robust red-shifted light emission and overall light emission that were higher than those of dLuc and aLuc. We synthesized cyaLucs that increased the total photon flux of light in vivo. In addition, the circulatory life of cybLuc in vivo was longer than that of dLuc and aLuc. As a result, cybLuc could improve relative bioluminescence signals in the brain.
Experimental Section
All reagents and solvents were obtained from commercial sources and were used as received unless otherwise noted. Milli-Q water was used to prepare all aqueous solutions. Bioluminescence spectra were collected using a Hitachi F4500 fluorescence spectrophotometer (Hitachi High Technologies America, Inc., Schaumburg, IL, U.S.A.) with a blocked excitation path at 37 °C. Measurements for bioluminescent assays were performed at 37 °C in 50 mM Tris buffer, pH 7.4, containing 10 mM MgCl2 and 0.1 mM ZnCl2. An IVIS kinetic imaging system (Caliper Life Sciences, Hopkinton, MA, U.S.A.) equipped with a cooled CCD camera was used for bioluminescent imaging at 37 °C.
Synthesis
The cyaLucs can be prepared with a facile and efficient method as depicted in Scheme S1. In brief, 6-aminobenzo[d]thiazole-2-carbonitrile (13) was included in a one-pot reaction with cyclanones and sodium cyanoborohydride in the presence of acetic acid (as a solvent and catalyst) to obtain pure monocycloalkyl intermediates 14a–c after column separation. A subsequent cross-coupling reaction of the intermediates 14a–c with d-cysteine hydrochloride resulted in cyaLucs (12a, cybLuc; 12b, cypLuc; 12c, cyhLuc) under a N2 atmosphere in the absence of light. The details for the preparation of all substrates and their NMR and high-resolution mass spectrometry (HR-MS) spectra can be found in the Supporting Information.
In Vitro Bioluminescence Measurements
Fifty microliters of Tris–HCl buffer containing 20 μg/mL luciferase and 2 mM ATP was added to solutions of the substrate at various concentrations (0.01–1 μM) in Tris buffer (50 μL), and the bioluminescent signals were then detected with an acquisition time of 0.5 s.
Fifty microliters of substrate (20 μM) solutions was added to various concentrations of ATP (0.25–10 μM) solutions in Tris–HCl buffer containing 20 μg/mL luciferase (50 μL), and the bioluminescent signals were then detected with an acquisition time of 0.5 s.
Bioluminescence Cell Imaging
ES-2-Fluc cells were passed and plated (4 × 10⁴ cells per well) in 96-well black plates with clear bottoms. When the cells became approximately 95% confluent, the medium was removed, and various concentrations of substrate in NS were added. The bioluminescence was measured immediately after the addition of the substrates with an acquisition time of 1 or 20 s. Photon emission was collected using a cooled CCD camera.
ES-2-Fluc cells were passed and plated at various concentrations (1250, 2500, 5000, 10 000, 20 000, and 40 000 cells per well) in black 96-well plates with clear bottoms. When the cells became approximately 95% confluent, the medium was removed, and 50 μL of substrate (20 μM) in normal saline (NS) were added. The bioluminescence was measured immediately after the addition of the substrates with an acquisition time of 1 s. Photon emission was collected using a cooled CCD camera.
In Vivo Bioluminescence Imaging
All animal studies were approved by the Ethics Committee and IACUC of Qilu Health Science Center, Shandong University and were conducted in compliance with European guidelines for the care and use of laboratory animals. Balb/c nude mice, 8 weeks of age, were purchased from the Animal Center of the China Academy of Medical Sciences (Beijing, China). To generate tumor xenografts in mice, ES-2-Fluc cells (1 × 10⁷) were implanted subcutaneously under the right forelimb armpit of each 6–8 week old nude mouse. Mice were housed singly or in groups and maintained on a 12:12 light–dark cycle at 22 °C with free access to food and water. The tumor was harvested and cut into pieces, and then 10 mg tumor pieces were implanted subcutaneously into the right armpit region. The tumor xenografts were allowed to grow for 2 weeks before imaging. Mice bearing ES-2-Fluc subcutaneous tumors were anesthetized with isoflurane and injected intraperitoneally (ip) with 100 μL of various concentrations of substrate (10 μM, 100 μM, 1 mM, 4 mM and 10 mM). After 10 min, bioluminescent images were acquired at various acquisition times (60, 30, 20, 10, and 1 s), and again at 6 ± 1 min until the intensity stabilized. When the signal reached a plateau, the intensity was measured using a cy5.5 filter.
Pathogen-free luciferase-expressing transgenic mice (FVB-Tg(CAG-luc,-GFP)L2G85Chco/FathJ17) were obtained from the Jackson Laboratory. The mice used were littermates (8 weeks of age, males) and were housed singly or in groups and maintained on a 12:12 light–dark cycle at 22 °C with free access to food and water. The dLuc, aLuc, and cybLuc substrates were injected [100 μL of 1 mM solutions in NS, intravenously (iv)] into luciferase-expressing FVB transgenic mice. Then, the bioluminescent images were acquired with an acquisition time 1 s and again at 5 ± 1 min until the intensity stabilized. The heads and backs of the mice are the regions of interests (ROIs), ROI 1 and ROI 2, respectively. The ratio of ROI 1 and ROI 2 can be used as an index of crossing of the blood–brain barrier.
The ES-2-Fluc cell suspensions were maintained on ice during surgery and were subsequently injected into the brain with a Hamilton syringe (180 μm needle) using a micropump system with flow rates of 1.500 nL/min (withdrawal) and 500 nL/min (injection) after leaving the needle in place for 2 min. After 12 days, mice bearing ES-2-Fluc subcutaneous tumors were anesthetized with isoflurane and injected with dLuc, aLuc, or cybLuc (ip, 1 mM, 200 μL). Bioluminescent images were acquired with a 10 s acquisition time and again at 5 min until the intensity stabilized.
Crystallization of Fluc and Fluc–cybLuc Complex
Details of clone, expression, and purification are described in the Supporting Information. Luciferases were concentrated to 8 mg/mL. Crystal of native luciferases was initially obtained by sitting-drop vapor diffusion at 293 K. After optimization, crystals were grown in hanging drops by mixing equal volumes of protein solution and reservoir solution (0.5 M Li2SO4, 15% PEG8000, 0.1 M Tris pH 8.0) at 293 K. To obtain crystal of Fluc–cybLuc complex, luciferase was incubated with compound cybLuc at 20 °C for 16 h under followed conditions: 3.2 mM ATP, 1.2 mM compound cybLuc, and 12 mM MgCl2. The incubated enzyme was filtered and mixed with an equal volume of reservoir solution (0.1 M HEPES pH 7.5, 20% PEG8000) sitting drop to obtain crystals at 293 K. The crystals obtained were flash-frozen in liquid nitrogen after soaking in a cryoprotectant solution consisting of the respective reservoir solution with 15–20% glycerol used as a cryoprotectant, and all data sets were collected at 100 K in a nitrogen stream.
Data Collection, Processing, and Structure Determination
X-ray diffraction data were collected at 100 K on beamline BL17U at SSRF, Shanghai, China equipped with a MAR Mosaic CCD 225 detector. The data were integrated and scaled using the HKL-200 program suite.32 The Fluc crystal belongs to space group P41212 with unit cell parameters of a = 117.967 Å, b = 117.967 Å, c = 95.681 Å, α = β = γ = 90° and diffracts to 2.4 Å resolution. The Fluc–cybLuc crystal belongs to P41 space group with unit cell parameters of a = 73.101 Å, b = 73.101 Å, c = 96.465 Å, α = β = γ = 90° and diffracts to 2.3 Å resolution. The structures of Fluc and Fluc–cybLuc were solved by molecular replacement using Phaser from the CCP4 suite of programs33 with firefly luciferase (PDB entry 1BA3) as the search model. The initial model of luciferase was refined using PHENIX34 with additional rounds of manual rebuilding using the Coot molecular graphics program.35 In the final steps of refinement, water molecules were finally checked for hydrogen bonding in Coot and modified if necessary. The compound cybLuc was added to the complex model by Coot based on the FO–FC density map of the ligand structure. The same refinement was carried out as for the Fluc–cybLuc structure. The final model has a Rwork = 0.1781 and a Rfree = 0.2266 based on a subset of 22 634 of the reflections.
X-ray diffraction data collection and refinement statistics are presented in Table S2. The final model was checked and validated using PROCHECK,36 QMEAN,37 and ProQ,38 which indicated a good-quality model. The mean temperature factors for protein and solvent were calculated using BAVERAGE from the CCP4 program suite.29 Molecular graphics was illustrated with PyMOL.39 The atomic coordinates and structure factors of Fluc and Fluc–cybLuc have been deposited in the Protein Data Bank with accession codes 5DV9 and 5DWV, respectively.
Statistical Analysis
Data values were expressed as means ± SD or SEM of at least two independent experiments and evaluated using Student t test for unpaired samples.
Results and Discussion
cyaLucs Sustained Robust Bioluminescence ex Vivo
The emission wavelengths of cyaLucs (cybLuc, cypLuc, and cyhLuc) with Fluc in the presence of ATP, Mg2+, and oxygen were evaluated. The results exhibited that these cyaLucs were competent substrates for native Fluc as indicated by the production of a red-shifted bioluminescence signal. The bioluminescence emission peaks for dLuc, aLuc, cybLuc, cypLuc, and cyhLuc were 560, 591, 603, 603, and 607 nm, respectively (Figure S1). It should be emphasized that these red-shifted bioluminescence profiles for cyaLucs are of significance for penetrating tissues in live animal imaging. In our case, the most potent compound cybLuc has up to 60-fold Km and a lower Vmax than parent aminoluciferin. As the bulky size of N-cycloalkylated substitution grows, Km of cyaLucs intends to be larger so that the affinity of cyaLucs to luciferase becomes lower (Figure S2 and Table S1).
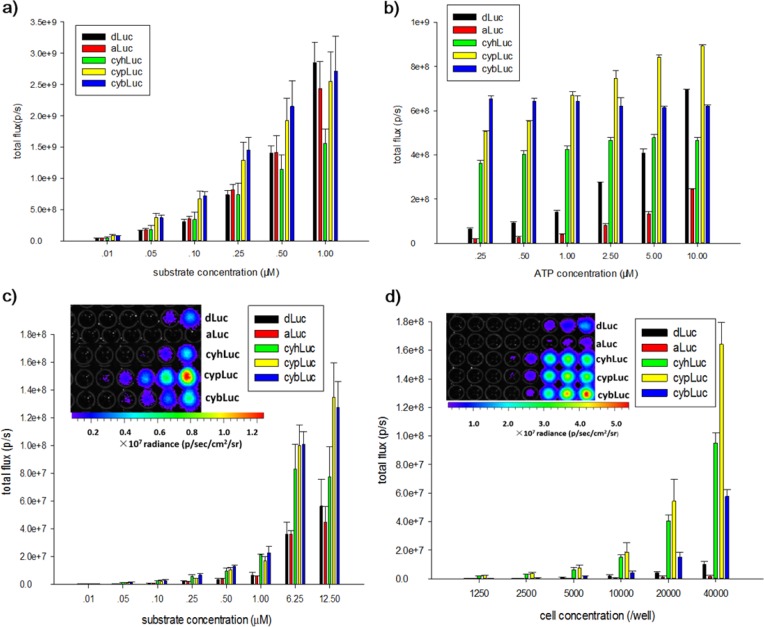
To further strengthen the relationships between the bioluminescent emission intensities of cyaLucs as substrates or ATP concentrations, we treated Fluc with increasing concentrations of cyaLucs or ATP. As a result, with the increased substrate concentration (0.01–1 μM), light emission intensities are enhanced, and compared to dLuc, there is no obvious difference on bioluminescent intensities within ATP (0.25–100 μM). These results clearly indicated that the bioluminescence induced by Fluc directly correlated with the concentrations of the cyaLucs, and cyaLucs with ATP-dependent manner to bioluminescence were inferior compared with dLuc within ATP (0.25–10 μM). Furthermore, compared to dLuc or aLuc, the concentrations of cyaLucs were lower, and thus, the sensitivities were higher (Figure 2, parts a and b). To determine the light-emitting properties of these cyaLucs at the cellular level, we incubated cyaLucs with native Fluc-expressing human ovarian cancer ES-2 cells (ES-2-Fluc). The bioluminescent intensities of cyaLucs increased with increasing concentrations of substrates and with increasing amounts of cells (Figure 2, parts c and d). Other cell lines expressing Fluc produced the similar results (Figure S3). In a dose-dependent experiment, the bioluminescent intensities from dLuc and aLuc continue to grow; in the meanwhile, cyaLucs reach a plateau in vitro and a slight decline in cellulo at >25 μM substrate concentration (Figure S5). It appears that dLuc would be brighter than cybLuc at 200 μM. Moreover, it should be underlined that, in the cell-based examination, cyaLucs presented their superior bioluminescent emission to dLuc and aLuc at >1 μM concentration, and a case in point is that the emission intensity of cyaLucs at 6.25 μM is stronger than of dLuc and aLuc at 100 μM (Figure S5). These promising results evidently suggested that cyaLucs possess efficient cell penetration.
Figure 2.
Dose–response analysis of substrates (a) and ATP (b): (a) 0.01–1 μM substrates incubated with 10 μg/mL native luciferase in 50 mM Tris–HCl buffer containing 10 mM MgCl2, 0.1 mM ZnCl2, and 1 mM ATP (pH 7.4); (b) 0.25–10 μM ATP incubated with 10 μg/mL native luciferase in 50 mM Tris–HCl buffer containing 10 mM MgCl2, 0.1 mM ZnCl2, and 10 μM luciferins (pH 7.4). Dose–response bioluminescence analysis of substrates (c) and cells (d): (c) bioluminescence imaging of (0.01–12.50 μM) substrates incubated with ES-2-Fluc cells (4 × 10⁴ cells per well) and quantification of the bioluminescent imaging signal; (d) bioluminescence imaging of substrates incubated with various concentrations of ES-2-Fluc cells (1.25 × 10³ to 4 × 10⁴ per well) and quantification of the bioluminescent imaging signals. All assays were performed in triplicate and presented as the mean ± SEM.
Application of cybLuc in Animal Bioluminescence Imaging
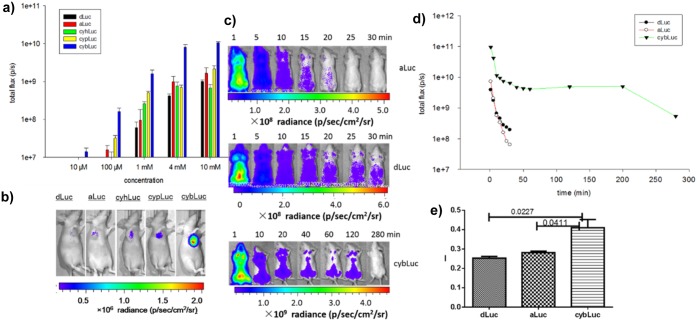
The standard method for BLI with dLuc and aLuc is to inject 150 mg/kg intraperitoneally, which equates to 0.1 mL of a 100 mM dLuc solution for an average mouse, and to image the mice after approximately 10 min, when the emission is typically at its peak.40 Considering that cyaLucs emit more robust light than dLuc and aLuc in cellular tests at the micromolar levels, bioluminescent intensities in living animals were also evaluated. Various concentrations of substrates (in 0.1 mL volume) were injected intraperitoneally into well-established mouse xenograft tumor models. The results obtained suggested very favorable light-emitting behaviors for cyaLucs in living animals, particularly cybLuc, which produced an ∼20-fold higher bioluminescent signal than dLuc and aLuc at equivalent doses (Figure 3, parts a and b). Interestingly, cybLuc is capable of emitting detectable bioluminescence for 13 h (Figure S4), which is a breakthrough for the challenge of short-time imaging in vivo. Given this outstanding performance of cybLuc, we evaluated the capabilities of cybLuc in luciferase-expressing transgenic mice. Intravenous injections of cybLuc revealed bioluminescent behavior in luciferase-expressing transgenic mice, and the intensity and circulatory life were superior to dLuc and aLuc as before. In addition, the ratio of the cybLuc bioluminescence total flux in the brain was higher than dLuc and aLuc (Figure 3, parts c–e); thus, we can infer that cybLuc can access brain tissue more readily.
Figure 3.
Bioluminescence imaging of substrates with ES-2-Fluc tumors in nude mice (a and b): (a) integrated bioluminescence emission for mice using various concentrations of luciferins (ip; 10 μM, 100 μM, 1 mM, 4 mM, and 10 mM; 100 μL); (b) representative bioluminescence images of a nude mouse implanted with ES-2-Fluc xenografts after intraperitoneal injections of various luciferins (10 μM, 0.1 mL). Comparison of dLuc, aLuc, and cybLuc in luciferase-expressing transgenic mice (c–e): (c) representative bioluminescence images of luciferase-expressing transgenic mice administered dLuc, aLuc, and cybLuc iv (1 mM, 0.1 mL); (d) total photon output from the heads of luciferase-expressing FVB transgenic mice treated with dLuc, aLuc, or cybLuc; (e) head-to-back ratio of bioluminescence. All assays were performed in triplicate and presented as the mean ± SEM; *, P < 0.05.
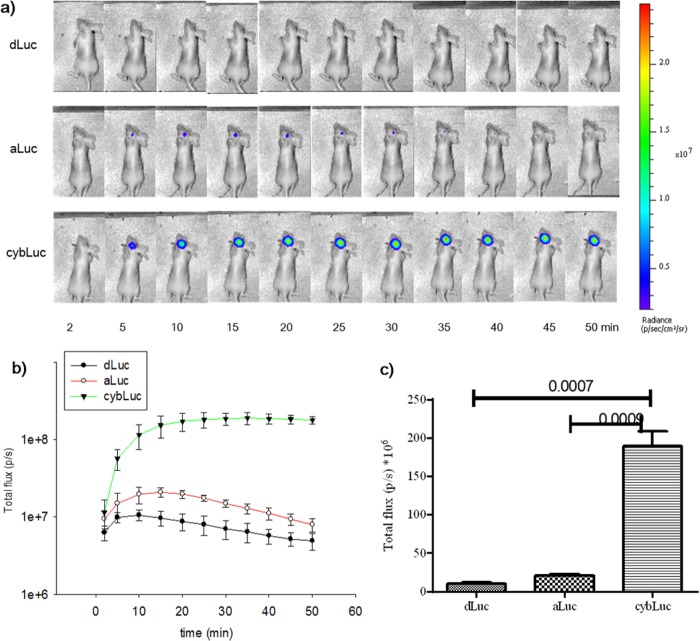
Considering the high ratio of cybLuc bioluminescence total flux in the brain, we further assessed cybLuc for BLI sensitivity in the rodent brain. We imaged mice to measure bioluminescence 12 days after they were treated with ES-2-Fluc cells in the brain hippocampus.41 The results obtained (Figure 4a) verified the advantageous effects of cybLuc on the stability of bioluminescence in vivo. When the intensity of the bioluminescence reached a plateau, cybLuc maintained its status for more than 30 min, whereas aLuc and dLuc did so for less than 5 min (Figure 4b). Furthermore, the intensity with cybLuc was 18-fold higher than with dLuc and aLuc. At high substrate concentration (100 mM dLuc, 10 mM cybLuc), the results demonstrated that the bioluminescent intensity of cybLuc declined from 10 min compared to dLuc from 15 min (Figure S6), Moreover, 10 mM cybLuc displays stronger bioluminescent signal than 100 mM dLuc. It needs to be noted that ip injection of 10 mM cybLuc can provide about 7-fold higher signal than of 100 mM dLuc (Figure S6), which suggests that cybLuc can proficiently cross the blood–brain barrier and access deep brain tissues more efficiently (Figure 4c).
Figure 4.
Bioluminescence imaging of substrates with ES-2-Fluc in nude mouse brain: (a) representative bioluminescence images after intraperitoneal injection of dLuc, aLuc, and cybLuc (1 mM, 0.2 mL) over time; (b) total flux for mice with dLuc, aLuc, and cybLuc (1 mM, 0.2 mL) from above; (c) total flux for mice with dLuc, aLuc, and cybLuc at plateau points (dLuc, 10 min; aLuc, 15 min; cybLuc, 35 min). All assays were performed in triplicate and presented as the mean ± SEM.
Crystallization of Oxidized cybLuc with Fluc
To better understand the mechanism of action of cybLuc, the structures of apo-form of luciferase (Fluc) and holo-form complex with oxidized cybLuc (Fluc–cybLuc) were determined to 2.1 and 2.3 Å resolution, respectively, by molecular replacement (Table S2) using the crystal structure of luciferase from P. pyralis (Protein Data Bank accession number: 1BA3) as a model. The final models of Fluc and Fluc–cybLuc show that each asymmetric unit contains one monomer. All atoms of the Fluc model are well-defined except for two amino acid residues at the N-terminus and seven amino acid residues at C-terminus. The amino acids of Fluc–cybLuc model from N-terminal to Arg437 are well-defined except for two disordered amino acid residues at N-terminus and a loop from Gly200 to Gly203.
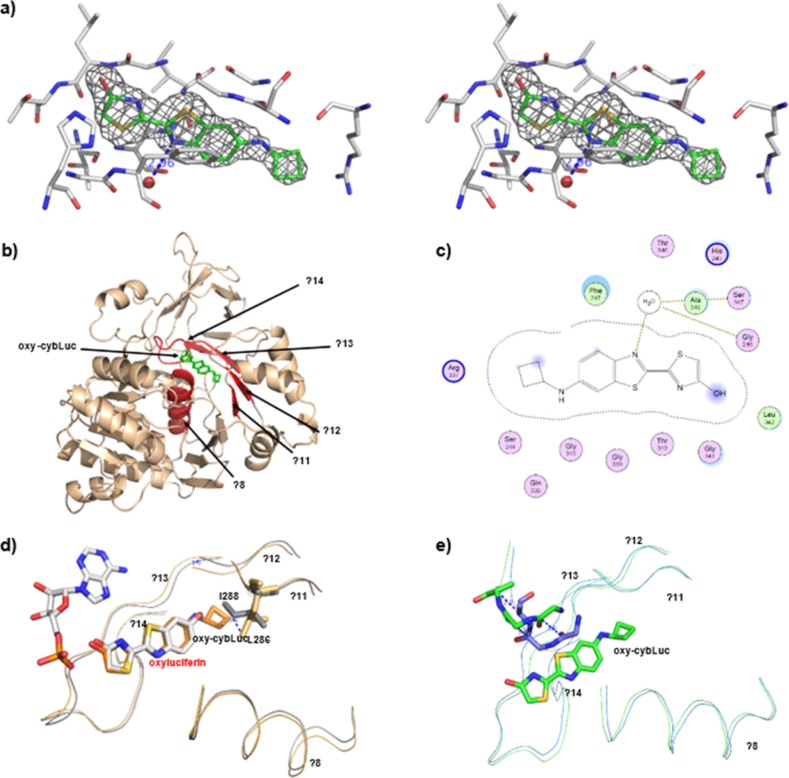
In the Fluc–cybLuc structure, oxidized cybLuc gives a clear density in the active site (Figure 5a). The oxy-cybLuc (products) is bound in a hydrophobic pocket consisting of α8 (amino acid residues 246–258), β11 (284–287), β12 (311–314), β13 (337–340), β14 (349–351), and a loop (341–348) (Figure 5b). A water molecule, Wat 25, is hydrogen-bonded to N7 of cybLuc (3.0 Å). His245 forms a hydrogen bond with the hydroxyl of cybLuc (3.5 Å). Ser314 forms a hydrogen bond with the amino group of cybLuc (3.7 Å). Phe247 has a hydrophobic interaction with the phenyl moiety of cybLuc, as well as Ser314, Gly315, Arg337, and Gln338 line a hydrophobic network with a cyclobutyl ring. Among the interactions, the methylene of the Arg337 side chain has a hydrophobic interaction with the cyclobutyl ring of cybLuc. As a result, cybLuc can combine more tightly than dLuc with luciferase. The details of active-site residues are depicted in Figure 5c.
Figure 5.
Overall structure of Fluc–cybLuc complex and oxy-cybLuc binding site: (a) stereoview of the structure around oxy-cybLuc and FO–FC OMIT map contoured at 3.0σ shows electron density for oxy-cybLuc, a water, and interaction amino acids in the binding site; (b) cartoon model representation of Fluc–cybLuc complex structure in wheat color; the oxy-cybLuc binding site (α8, β11, β12, β13, β14, and a loop) are drawn in red color; the oxy-cybLuc is shown in green stick model; (c) a schematic drawing of oxy-cybLuc binding site; (d) stereoview superposition of LcrLuc–AMP/oxyluciferin complex structure (gray) and Fluc–cybLuc complex structure (wheat); (e) stereoview superposition of apo-Fluc (blue) and Fluc–cybLuc (green).
We align the Fluc–cybLuc structure to the LcrLuc–AMP/oxyluciferin complex structure (Protein Data Bank accession number: 2D1R),42 indicating that the oxidized cybLuc has a suitable superposition to oxyluciferin except for the cyclobutyl ring of oxidized cybLuc. Therefore, we ascertain that cybLuc has the same interaction site in luciferase. The hydrophobic pocket of Fluc is most similar to LcrLuc, except for β12 of Fluc has about 1.0 Å distance to β13 of LcrLuc and Leu286 side chain of Fluc–cybLuc has 3.1 Å distance with Ile 288 of LcrLuc (Figure 5d). The structure of Fluc–cybLuc is essentially different with apo-Fluc between the loops (Gly315-Ala317). The loop in Fluc–cybLuc has obvious movement, which seems to be the switching of the compound cybLuc to the luciferase protein (Figure 5e).
Conclusion
In summary, by introducing a lipophilic N-cycloalkylated substitution into aLuc, we produced a series of sensitive N-cycloalkylaminoluciferins (cyaLucs) for use in the firefly luciferase–luciferin bioluminescence system. The experimental results clearly demonstrated that these cyaLucs were competent substrates for native Fluc and could produce high levels of bioluminescent signals in vitro, in cellulo, and in vivo. In addition, the red-shifted bioluminescent emissions and the increased cell permeability of cyaLucs are of significance for penetrating tissues in live animal imaging. In animal studies, up to 10 μM (0.1 mL) of cybLuc, which is 0.01% of the standard dose of dLuc used in mouse imaging studies, can produce a 20-fold higher bioluminescence signal than dLuc or aLuc at the same concentration. It should be noted that such a small dose is not only economical, but is also precise for detection in biological studies. In our studies, longer emission during in vivo imaging of cybLuc was observed. Regarding the mechanism of cybLuc, our cocrystal structure data from firefly luciferase with oxidized cybLuc suggested that oxidized cybLuc fits into the same pocket as oxyluciferin. These results indicate that cybLuc can be used in applications requiring long-time observation in vivo. Moreover, cybLuc is able to detect luciferase expression in brain tumors with greater sensitivity than dLuc or aLuc, and thus, it can be used in brain tumor imaging and in other applications for deep tissues, for example, in the brain. We believe that these novel firefly luciferase substrates will expand the imaging toolkit and inspire new applications for bioluminescence technology. It is our expectation that, based on such a tailor-made lipophilic strategy, a variety of firefly luciferase substrates will become available for BLI purposes. Currently, additional efforts are in progress to develop a panel of excellent substrates for firefly luciferase following this type of strategy.
Acknowledgments
The present work was supported by Grants from the National Program on Key Basic Research Project of China (Nos. 2013CB734000 and 2015CB150600), the National Natural Science Foundation of China (Nos. 81673393 and 31401626), the Taishan Scholar Program at Shandong Province, The Qilu Scholar Program at Shandong University, the Program for Changjiang Scholars and Innovative Research Team in University (No. IRT13028), the Major Project of Science and Technology of Shandong Province (No. 2015ZDJS04001), the Fundamental Research Funds of Shandong University (No. 2014JC008), and the National Institutes of Health (No. R01GM112003).
Supporting Information Available
The Supporting Information is available free of charge on the ACS Publications website at DOI: 10.1021/acs.analchem.6b03510.
General methods, synthetic procedures, original spectra for structural characterization, and additional figures and tables (PDF)
Author Contributions
The manuscript was written through contributions of all authors. W.W. and J.S. contributed equally.
The authors declare no competing financial interest.
Supplementary Material
References
- Paley M. A.; Prescher J. A. MedChemComm 2014, 5, 255. 10.1039/C3MD00288H. [DOI] [PMC free article] [PubMed] [Google Scholar]
- Lloyd J. E. Annu. Rev. Entomol. 1983, 28, 131–160. 10.1146/annurev.en.28.010183.001023. [DOI] [Google Scholar]
- Thornberry N. A.; Rano T. A.; Peterson E. P.; Rasper D. M.; Timkey T.; Garcia-Calvo M.; Houtzager V. M.; Nordstrom P. A.; Roy S.; Vaillancourt J. P.; Chapman K. T.; Nicholson D. W. J. Biol. Chem. 1997, 272, 17907–17911. 10.1074/jbc.272.29.17907. [DOI] [PubMed] [Google Scholar]
- Geiger R.; Schneider E.; Wallenfels K.; Miska W. Biol. Chem. Hoppe-Seyler 1992, 373, 1187–1191. 10.1515/bchm3.1992.373.2.1187. [DOI] [PubMed] [Google Scholar]
- Yao H.; So M. K.; Rao J. Angew. Chem., Int. Ed. 2007, 46, 7031–7034. 10.1002/anie.200701931. [DOI] [PubMed] [Google Scholar]
- Li J.; Chen L.; Wu W.; Zhang W.; Ma Z.; Cheng Y.; Du L.; Li M. Anal. Chem. 2014, 86, 2747–2751. 10.1021/ac404176x. [DOI] [PubMed] [Google Scholar]
- Wu W.; Li J.; Chen L.; Ma Z.; Zhang W.; Liu Z.; Cheng Y.; Du L.; Li M. Anal. Chem. 2014, 86, 9800–9806. 10.1021/ac502396g. [DOI] [PubMed] [Google Scholar]
- Van de Bittner G. C.; Dubikovskaya E. A.; Bertozzi C. R.; Chang C. J. Proc. Natl. Acad. Sci. U. S. A. 2010, 107, 21316–21321. 10.1073/pnas.1012864107. [DOI] [PMC free article] [PubMed] [Google Scholar]
- Ke B.; Wu W.; Wei L.; Wu F.; Chen G.; He G.; Li M. Anal. Chem. 2015, 87, 9110–9113. 10.1021/acs.analchem.5b02237. [DOI] [PubMed] [Google Scholar]
- Ke B.; Wu W.; Liu W.; Liang H.; Gong D.; Hu X.; Li M. Anal. Chem. 2016, 88, 592–595. 10.1021/acs.analchem.5b03636. [DOI] [PubMed] [Google Scholar]
- Li J.; Chen L.; Du L.; Li M. Chem. Soc. Rev. 2013, 42, 662–676. 10.1039/C2CS35249D. [DOI] [PubMed] [Google Scholar]
- Negrin R. S.; Contag C. H. Nat. Rev. Immunol. 2006, 6, 484–490. 10.1038/nri1879. [DOI] [PubMed] [Google Scholar]
- White E. H.; Wörther H.; Seliger H. H.; McElroy W. D. J. Am. Chem. Soc. 1966, 88, 2015–2019. 10.1021/ja00961a030. [DOI] [Google Scholar]
- Shinde R.; Perkins J.; Contag C. H. Biochemistry 2006, 45, 11103–11112. 10.1021/bi060475o. [DOI] [PubMed] [Google Scholar]
- Woodroofe C. C.; Shultz J. W.; Wood M. G.; Osterman J.; Cali J. J.; Daily W. J.; Meisenheimer P. L.; Klaubert D. H. Biochemistry 2008, 47, 10383–10393. 10.1021/bi800505u. [DOI] [PubMed] [Google Scholar]
- Mofford D. M.; Reddy G. R.; Miller S. C. J. Am. Chem. Soc. 2014, 136, 13277–13282. 10.1021/ja505795s. [DOI] [PMC free article] [PubMed] [Google Scholar]
- Reddy G. R.; Thompson W. C.; Miller S. C. J. Am. Chem. Soc. 2010, 132, 13586–13587. 10.1021/ja104525m. [DOI] [PMC free article] [PubMed] [Google Scholar]
- Conley N. R.; Dragulescu-Andrasi A.; Rao J.; Moerner W. E. Angew. Chem., Int. Ed. 2012, 51, 3350–3353. 10.1002/anie.201105653. [DOI] [PMC free article] [PubMed] [Google Scholar]
- McCutcheon D. C.; Paley M. A.; Steinhardt R. C.; Prescher J. A. J. Am. Chem. Soc. 2012, 134, 7604–7607. 10.1021/ja301493d. [DOI] [PMC free article] [PubMed] [Google Scholar]
- Pirrung M. C.; Biswas G.; De Howitt N.; Liao J. Bioorg. Med. Chem. Lett. 2014, 24, 4881–4883. 10.1016/j.bmcl.2014.08.048. [DOI] [PubMed] [Google Scholar]
- Jathoul A. P.; Grounds H.; Anderson J. C.; Pule M. A. Angew. Chem., Int. Ed. 2014, 53, 13059–13063. 10.1002/anie.201405955. [DOI] [PMC free article] [PubMed] [Google Scholar]
- Kojima R.; Takakura H.; Ozawa T.; Tada Y.; Nagano T.; Urano Y. Angew. Chem., Int. Ed. 2013, 52, 1175–1179. 10.1002/anie.201205151. [DOI] [PubMed] [Google Scholar]
- Gross S.; Abraham U.; Prior J. L.; Herzog E. D.; Piwnica-Worms D. Mol. Imaging 2007, 6, 121–130. 10.2310/7290.2007.00009. [DOI] [PubMed] [Google Scholar]
- Chandran S. S.; Williams S. A.; Denmeade S. R. Luminescence 2009, 24, 35–38. 10.1002/bio.1060. [DOI] [PubMed] [Google Scholar]
- Evans M. S.; Chaurette J. P.; Adams S. T. Jr.; Reddy G. R.; Paley M. A.; Aronin N.; Prescher J. A.; Miller S. C. Nat. Methods 2014, 11, 393–395. 10.1038/nmeth.2839. [DOI] [PMC free article] [PubMed] [Google Scholar]
- Kuchimaru T.; Iwano S.; Kiyama M.; Mitsumata S.; Kadonosono T.; Niwa H.; Maki S.; Kizaka-Kondoh S. Nat. Commun. 2016, 7, 11856. 10.1038/ncomms11856. [DOI] [PMC free article] [PubMed] [Google Scholar]
- Mofford D. M.; Adams S. T. Jr.; Reddy G. S.; Reddy G. R.; Miller S. C. J. Am. Chem. Soc. 2015, 137, 8684–8687. 10.1021/jacs.5b04357. [DOI] [PMC free article] [PubMed] [Google Scholar]
- Mofford D. M.; Miller S. C. ACS Chem. Neurosci. 2015, 6, 1273–1275. 10.1021/acschemneuro.5b00195. [DOI] [PubMed] [Google Scholar]
- Adams S. T. Jr.; Mofford D. M.; Reddy G. S.; Miller S. C. Angew. Chem., Int. Ed. 2016, 55, 4943–4946. 10.1002/anie.201511350. [DOI] [PMC free article] [PubMed] [Google Scholar]
- Misra R. N.; Xiao H. Y.; Kim K. S.; Lu S.; Han W. C.; Barbosa S. A.; Hunt J. T.; Rawlins D. B.; Shan W.; Ahmed S. Z.; Qian L.; Chen B. C.; Zhao R.; Bednarz M. S.; Kellar K. A.; Mulheron J. G.; Batorsky R.; Roongta U.; Kamath A.; Marathe P.; Ranadive S. A.; Sack J. S.; Tokarski J. S.; Pavletich N. P.; Lee F. Y.; Webster K. R.; Kimball S. D. J. Med. Chem. 2004, 47, 1719–1728. 10.1021/jm0305568. [DOI] [PubMed] [Google Scholar]
- Betti L.; Biagi G.; Giannaccini G.; Giorgi I.; Livi O.; Lucacchini A.; Manera C.; Scartoni V. J. Med. Chem. 1998, 41, 668–673. 10.1021/jm9701334. [DOI] [PubMed] [Google Scholar]
- Otwinowski Z.; Minor W. In Methods in Enzymology, Vol. 278; Carter C. W. Jr., Sweet R. M., Eds.; Academic Press: San Diego, CA, 1997; pp 307–326. [DOI] [PubMed] [Google Scholar]
- Winn M. D.; Ballard C. C.; Cowtan K. D.; Dodson E. J.; Emsley P.; Evans P. R.; Keegan R. M.; Krissinel E. B.; Leslie A. G.; McCoy A.; McNicholas S. J.; Murshudov G. N.; Pannu N. S.; Potterton E. A.; Powell H. R.; Read R. J.; Vagin A.; Wilson K. S. Acta Crystallogr., Sect. D: Biol. Crystallogr. 2011, 67, 235–242. 10.1107/S0907444910045749. [DOI] [PMC free article] [PubMed] [Google Scholar]
- Adams P. D.; Grosse-Kunstleve R. W.; Hung L. W.; Ioerger T. R.; McCoy A. J.; Moriarty N. W.; Read R. J.; Sacchettini J. C.; Sauter N. K.; Terwilliger T. C. Acta Crystallogr., Sect. D: Biol. Crystallogr. 2002, 58, 1948–1954. 10.1107/S0907444902016657. [DOI] [PubMed] [Google Scholar]
- Emsley P.; Cowtan K. Acta Crystallogr., Sect. D: Biol. Crystallogr. 2004, 60, 2126–2132. 10.1107/S0907444904019158. [DOI] [PubMed] [Google Scholar]
- Laskowski R. A.; MacArthur M. W.; Moss D. S.; Thornton J. M. J. Appl. Crystallogr. 1993, 26, 283–291. 10.1107/S0021889892009944. [DOI] [Google Scholar]
- Benkert P.; Tosatto S. C.; Schomburg D. Proteins: Struct., Funct., Genet. 2008, 71, 261–277. 10.1002/prot.21715. [DOI] [PubMed] [Google Scholar]
- Cristobal S.; Zemla A.; Fischer D.; Rychlewski L.; Elofsson A. BMC Bioinf. 2001, 2, 5. 10.1186/1471-2105-2-5. [DOI] [PMC free article] [PubMed] [Google Scholar]
- Lill M. A.; Danielson M. L. J. Comput.-Aided Mol. Des. 2011, 25, 13–19. 10.1007/s10822-010-9395-8. [DOI] [PubMed] [Google Scholar]
- Adams S. T. Jr.; Miller S. C. Curr. Opin. Chem. Biol. 2014, 21, 112–120. 10.1016/j.cbpa.2014.07.003. [DOI] [PMC free article] [PubMed] [Google Scholar]
- Aswendt M.; Adamczak J.; Couillard-Despres S.; Hoehn M. PLoS One 2013, 8, e55662. 10.1371/journal.pone.0055662. [DOI] [PMC free article] [PubMed] [Google Scholar]
- Nakatsu T.; Ichiyama S.; Hiratake J.; Saldanha A.; Kobashi N.; Sakata K.; Kato H. Nature 2006, 440, 372–376. 10.1038/nature04542. [DOI] [PubMed] [Google Scholar]
Associated Data
This section collects any data citations, data availability statements, or supplementary materials included in this article.


