

Abstract
Nuclear hormone receptors (NR) have been implicated as regulators of lipid and carbohydrate metabolism. The orphan NR4A subgroup has emerged as regulators of metabolic function. Targeted silencing of neuron-derived orphan receptor 1 (Nor-1)/NR4A3 in skeletal muscle cells suggested that this NR was necessary for oxidative metabolism in vitro. To investigate the in vivo role of Nor-1, we have developed a mouse model with preferential expression of activated Nor-1 in skeletal muscle. In skeletal muscle, this resulted in a marked increase in: 1) myoglobin expression, 2) mitochondrial DNA and density, 3) oxidative enzyme staining, and 4) genes/proteins encoding subunits of electron transport chain complexes. This was associated with significantly increased type IIA and IIX myosin heavy chain mRNA and proteins and decreased type IIB myosin heavy chain mRNA and protein. The contractile protein/fiber type remodeling driving the acquisition of the oxidative type II phenotype was associated with 1) the significantly increased expression of myocyte-specific enhancer factor 2C, and phospho-histone deacetylase 5, and 2) predominantly cytoplasmic HDAC5 staining in the Tg-Nor-1 mice. Moreover, the Nor-1 transgenic line displayed significant improvements in glucose tolerance, oxygen consumption, and running endurance (in the absence of increased insulin sensitivity), consistent with increased oxidative capacity of skeletal muscle. We conclude that skeletal muscle fiber type is not only regulated by exercise-sensitive calcineurin-induced signaling cascade but also by NR signaling pathways that operate at the nexus that coordinates muscle performance and metabolic capacity in this major mass tissue.
Nuclear hormone receptors (NR) are hormone/ligand-dependent DNA binding proteins that translate endocrine, metabolic, and pathophysiological signals into gene regulation. Multiple NRs have been implicated in the regulation of lipid, carbohydrate, and energy homeostasis (and substrate utilization) in an organ/tissue-specific manner (1). Neuron-derived orphan receptor 1 (Nor-1/NR4A3) is a member of the NR4A subgroup of transcription factors. In mammals, the NR4A subgroup consists of three closely related orphan NRs: neuron-derived clone 77 (Nur77/NR4A1), NR-related 1 (Nurr1/NR4A2), and Nor-1. No bona fide endogenous/native Nor-1 ligands have been identified, and thus, it is designated as an “orphan” NR and can operate in a ligand-independent manner (2). However, several agonists that modulate the activity of this NR have been recently described (3–8).
Members of the NR4A subgroup have recently emerged as regulators of metabolic function both in vitro and in vivo (reviewed in Ref. 9). The expression of the NR4A subgroup is known to be induced in multiple tissues by a diverse range of stimuli (associated with metabolic function), such as β-adrenoceptor agonists (10–12), cold (13, 14), fatty acids (15), glucose (16), insulin (17), cholesterol (18), melanocortins (19), and thiazolidinediones (20).
In skeletal muscle and fat tissue, the expression of Nor-1 is strikingly induced by both β-adrenergic (21) and melanocortin signaling (19), which regulate energy expenditure and satiety, respectively. Gain- and loss-of-function studies (in vitro and in vivo) in metabolic tissues have associated Nur77/NR4A1 with specific aspects of lipid, carbohydrate, and energy homeostasis (11–13, 22–25). However, the direct role of Nor-1 in relation to metabolic function has not been examined in skeletal muscle in vivo. Skeletal muscle is a major mass peripheral tissue with large energy demands, accommodated by oxidative metabolism. This lean tissue accounts for up to 40% of the total body mass and energy expenditure and is the predominant site for fatty acid and glucose oxidation (26, 27). Consequently, skeletal muscle plays a significant role in the regulation of body composition, energy balance, insulin sensitivity, and the blood lipid profile. We have previously demonstrated that Nor-1 expression is necessary for oxidative metabolism. Targeted silencing of Nor-1 in skeletal muscle cells (in vitro) resulted in increased lactate production and decreased fatty acid oxidation associated with the attenuation of gene expression involved in the aerobic metabolism of carbohydrate and fat metabolism (10, 21).
In the course of the current study, we have developed a mouse model with preferential expression of activated Nor-1 in skeletal muscle to investigate the role of this NR in vivo. We have used the human skeletal muscle α-actin (HSA) promoter (28) to drive skeletal muscle-specific expression of activated Nor-1. In this current study, we have demonstrated that expression of activated Nor-1 in skeletal muscle results in the transition toward a more oxidative phenotype. Skeletal muscle displays increased myoglobin expression, mitochondrial DNA (mtDNA)/number, oxidative enzyme staining, and oxidative myosin heavy chain (MyHC) IIX/IIA expression. Consistent with an enhanced oxidative phenotype in skeletal muscle, Nor-1 transgenic mice display significantly improved glucose tolerance, oxygen consumption, and endurance/fatigue resistance, consistent with the acquisition of a more oxidative muscle phenotype.
Results
Transgenic overexpression of activated Nor-1 in skeletal muscle
Our previous work provided in vitro evidence that Nor-1 is necessary for oxidative metabolism in a skeletal muscle cell culture system (10). We were interested in validating the physiologically relevant in vivo functional role(s) of Nor-1 in skeletal muscle, a major peripheral tissue mass that accounts for around 40% of the total body mass in nonobese subjects (26) and significant levels of fatty acid oxidation, glucose disposal, and energy demand (27). We used the approach of investigating Nor-1 function, by the targeted skeletal muscle-specific expression of an activated form of Nor-1 in transgenic mice. We produced transgenic mice (by pronuclear injection) that selectively express a transgene encoding the chimeric viral protein 16 (VP16)-Nor-1 in skeletal muscle (under the control of the HSA promoter) (28, 29). Activated NRs have been previously used in several transgenic NR studies (30–34). Various major organ/tissues, including skeletal muscle, were extracted from male wild-type (WT) and transgenic (Tg-Nor-1) mice, and ectopic Nor-1 transgene expression was examined via quantitative RT-PCR (qRT-PCR) (Fig. 1A). We observed that the heterozygous transgenic mice selectively, predominantly, and abundantly expressed the ectopic transcript (transgene) in quadriceps femoris skeletal muscle relative to other organ/tissues. As expected, no transgene expression was evident in WT littermate mice. Interestingly, lower transgene expression was observed in other tissues, such as leukocytes, liver, heart, and brain. However, in all cases, this expression was significantly lower than the expression apparent in skeletal muscle. For example, ectopic-Nor-1 expression was more than 25- and more than 200-fold greater in skeletal muscle, relative to heart and brown adipose tissue, respectively. These data demonstrated that activated Nor-1 is preferentially expressed in the skeletal muscle of transgenic mice. This is comparable with previous studies in mice using the HSA promoter that have produced selective skeletal muscle-specific NR expression (31, 35–37).
Fig. 1.
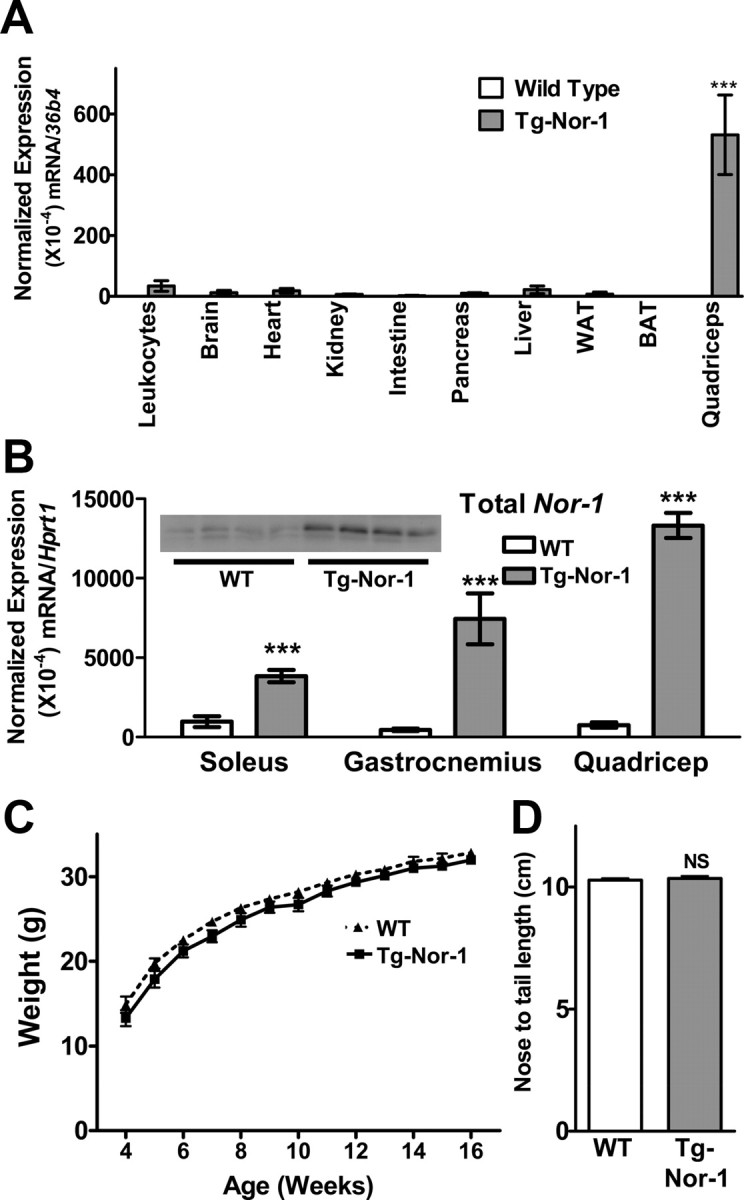
Expression of endogenous/ectopic Nor-1. A, Multiple tissues were assayed to determine the mRNA expression of the Nor-1 transgene in WT and transgenic (Tg-Nor-1) mice (n = 3). Statistical significance was assessed using a one-way ANOVA with Dunnett's post hoc test to compare the skeletal muscle sample (quadriceps femoris). B, Expression of total Nor-1 mRNA in soleus, gastrocnemius, and quadriceps femoris from WT and transgenic mice (n = 4–8). Statistical significance was assessed using a one-way ANOVA with Bonferroni's post hoc test. Total NOR-1 protein expression in quadriceps femoris muscle was determined by Western blotting (n = 4; B, inset). Weight (C) and length (D) of WT and transgenic mice (n = 12–16). ***, P < 0.001. NS, Nonsignificant. WAT, White adipose tissue; BAT, brown adipose tissue.
Skeletal muscle fibers are classified by speed of contraction and the aerobic (oxidative)/anaerobic (glycolytic) production of ATP. Slow type I red fibers use aerobic/oxidative metabolism (are more insulin sensitive), are rich in mitochondria (and myoglobin), and are suited to endurance activity. In contrast, type II fast twitch fibers are primarily anaerobic and glycolytic (IIB), use anaerobic glycolysis, are rich in glycogen, and are suited to short-term intense activity. However, there are also type IIA (oxidative) and type IIX (intermediate) fast twitch fibers. We evaluated the expression of endogenous Nor-1 in predominantly type I soleus muscle, predominantly type II gastrocnemius muscle and mixed fiber type quadriceps femoris muscle. We observed no significant differences in expression of the mRNA encoding endogenous/native Nor-1 in soleus, gastrocnemius, and quadriceps femoris skeletal muscle from WT mice (Supplemental Fig. 1, published on The Endocrine Society's Journals Online web site at http://mend.endojournals.org). Additional expression analysis demonstrated that total (endogenous plus ectopic) Nor-1 transcript expression increased 3- to 10-fold in the soleus, gastrocnemius, and quadriceps femoris muscle of transgenic mice relative to WT mice, respectively (Fig. 1B). The ectopic expression pattern in the transgenic line is concordant with the endogenous Nor-1 expression, and the activity of the skeletal α-actin promoter. Increased Nor-1 expression was also confirmed at the protein level using Western blotting (Fig. 1B, inset). In this background, we observed significant suppression of endogenous Nor-1 mRNA in soleus and decreased expression (that did not attain significance) in gastrocnemius and quadriceps femoris muscle. These data demonstrate the transgenic mice, express the ectopic transcript, and attenuate endogenous Nor-1 mRNA expression.
Transgenic expression of activated Nor-1 did not significantly alter the total body weight (Fig. 1C) or nose to tail length of the mice (Fig. 1D).
Nor-1 expression induces myoglobin expression in skeletal muscle in both type I and type II predominant skeletal muscles
Visual anatomical examination of skeletal muscle in the Nor-1 transgenic mouse after dissection revealed a distinct and striking increase in red pigmentation in transgenic relative to WT littermates. Enhanced red pigmentation was apparent in all visible skeletal muscle of transgenic mice. For example, the hind leg and gastrocnemius muscles after dissection are shown in Fig. 2, A and B (not to scale). Enhanced red pigmentation in skeletal muscle is associated with increased myoglobin expression, mitochondrial density, and oxidative capacity (31, 38–40). Subsequently, we examined myoglobin mRNA expression in soleus, gastrocnemius, quadriceps, femoris, and tibialis anterior skeletal muscle. Quantitative PCR revealed significant 2- to 4-fold increases in myoglobin mRNA expression (Fig. 2C) in both type I predominant (soleus) and type II predominant skeletal muscles (tibialis anterior, gastrocnemius, and quadriceps femoris). This demonstrated that transgenic Nor-1 expression induced myoglobin expression in both type I and type II fiber-predominate skeletal muscles.
Fig. 2.

Increased myoglobin expression in the skeletal muscle of Nor-1 transgenic mice. Representative photograph of whole back leg (A) and isolated gastrocnemius muscle (B) from WT and transgenic (Tg-Nor-1) mice. C, Skeletal muscle myoglobin mRNA levels were assayed by qRT-PCR in soleus, gastrocnemius (Gastroc.), quadriceps femoris, and tibialis anterior in WT and transgenic mice (n = 4–8). **, P < 0.01; ***, P < 0.001.
Nor-1 expression increases skeletal muscle succinate dehydrogenase (SDH) and nicotinamide adenine dinucleotide hydride (NADH) staining, mtDNA, and mitochondrial density in skeletal muscle
Acquisition of increased oxidative capacity in the Nor-1-expressing muscle of transgenic mice was validated by histochemical staining of tibialis anterior fresh frozen cryosections. Staining for mitochondrial enzyme activity using SDH (Fig. 3A) and NADH-diaphorase (NADH) (Fig. 3B) staining indicated that Nor-1 expression induced an acquisition of oxidative muscle fibers (and suggested increased oxidative phosphorylation). We used quantitative PCR analysis to examine mRNA expression encoding components of the electron transport chain complexes I, II, and III, i.e. NADH dehydrogenase (ubiquinone) 1β (Ndufb), succinate dehydrogenase complex, subunit B, iron sulfur (Sdhb), and ubiquinol-cytochrome c reductase complex III protein 2 (Uqcrc2), respectively, in quadriceps femoris skeletal muscle. In concordance with the increased mitochondrial enzyme staining, we observed significantly increased expression of Ndufb, Sdhb, and Uqcrc2 mRNA in quadriceps femoris skeletal muscle (Fig. 3C). Moreover, we observed increased expression of mitofusin-2 (Mfn2) mRNA (Fig. 3C), a mitochondrial fusion protein associated with mitochondrial function in skeletal muscle (41). Furthermore, we used the MitoProfile total oxidative phosphorylation Western blotting antibody cocktail directed against oxidative phosphorylation complexes I–V, containing monoclonal antibodies against the CI subunit NDUFB-subcomplex 8; CII subunit SDHB; CIII subunit UQCRC2; CIV subunit cytochrome c oxidase subunit 1; and CV α-subunit ATP synthase subunit α (ATP5A1). Western blot analysis on quadriceps femoris skeletal muscle (Fig. 3D) and the quantification (Fig. 3E) demonstrated significant increases in the expression of the complex I–V oxidative phosphorylation subunits in transgenic Nor-1 relative to WT littermates.
Fig. 3.

Skeletal muscle from Nor-1 transgenic mice display elevated mitochondrial markers. Brightfield microphotograph of transverse tibialis anterior cryosections from WT and transgenic (Tg-Nor-1) mice after SDH staining (A) and NADH staining (B). Representative microphotographs are shown (n = 3). Scale bar, 500 μm. C, The mRNA expression of functional mitochondrial genes Ndufa5, Uqcrc2, Sdhb, and Mfn2 in quadriceps femoris skeletal muscle was assayed by qRT-PCR (n = 4). D, Western blotting of key proteins involved in oxidative phosphorylation with (E) quantification by densitometry. Statistical significance was assessed using a one-way ANOVA with Bonferroni's post hoc test. F, mtDNA content was compared relative to gDNA content using qRT-PCR in soleus, gastrocnemius (Gastroc.), quadriceps femoris, and tibialis anterior (n = 4–6). G, Representative (n = 3) transmission electron micrograph of EDL from WT and transgenic mice. Arrow points to mitochondria. Scale bar, 2 μm. H, Analysis of mitochondria Vv% was derived from transmission electron microscopy for soleus, EDL, and tibialis anterior (n = 3). COX1, Cytochrome c oxidase subunit 1. *, P < 0.05; **, P < 0.01; ***, P < 0.001.
Quantitative PCR analysis of genomic DNA (gDNA) from skeletal muscle followed by PCR for Rnr2 (mitochondrial rRNA) and PolG2 (DNA polymerase subunit γ-2 gene) revealed significant increases in the mtDNA relative to gDNA in soleus, gastrocnemius, tibialis anterior, and quadriceps femoris muscle from the transgenic line, relative to WT littermates (Fig. 3F). Additional confirmation of increased mitochondria was identified by electron microscopy. Representative electron microphotographs of extensor digitorum longus (EDL) in WT and transgenic mice (Fig. 3G) are shown. Quantification of mitochondrial number using electron microscopy is shown in Fig. 3H for soleus, EDL, and tibialis anterior.
In summary, these histochemical and electron microscopy studies further demonstrated that Nor-1 expression induced the acquisition of an oxidative phenotype.
Nor-1 expression significantly increases expression of type IIA and IIX MyHC expression, in association with decreased type IIB expression
Skeletal muscle fibers as discussed are classified by speed of contraction and production of ATP. Expression analysis of the MyHC (ATPase) genes that are the major structural components of the sarcomeric thick filament can be used to define the specific type of skeletal muscle. There are four distinct MyHC genes 1, 2, 4, and 7 that encode the type IIX, IIA, IIB, and I MyHC transcripts, respectively. Quantitative PCR analysis revealed a very significant (P < 0.001) increase in the levels of type IIX MyHC in quadriceps femoris and gastrocnemius muscle tissue from the transgenic Nor-1-expressing mice, relative to the WT littermates (Fig. 4, A and B, respectively). Secondly, qRT-PCR analysis revealed very significant (P < 0.001) increases in the expression of the mRNA encoding type IIA MyHC in quadriceps femoris, gastrocnemius, and soleus muscle tissue from the transgenic Nor-1-expressing mice, relative to the WT littermates (Fig. 4, A–C, respectively). Thirdly, we observed highly significant decreases (P < 0.001) in the expression of the mRNA encoding type IIB MyHC in quadriceps femoris, gastrocnemius, and soleus muscle tissue from the transgenic Nor-1-expressing mice, relative to the WT littermates (Fig. 4, A–C, respectively). Finally, qRT-PCR analysis revealed significantly decreased levels of type I MyHC in gastrocnemius, and soleus from the transgenic Nor-1-expressing mice, relative to the WT littermates (Fig. 4, B and C, respectively). The complete statistical analysis is presented in Supplemental Table 1. Figure 4D summarizes the fold activation and repression of the four MyHC mRNA in quadriceps femoris, gastrocnemius, and soleus skeletal muscle tissues. Immunofluorescence with quantification (Fig. 5, A and B) and high-resolution SDS-PAGE (Fig. 5C) highlight the significant decrease in type IIB and increases in IIX MyHC fibers/protein levels.
Fig. 4.
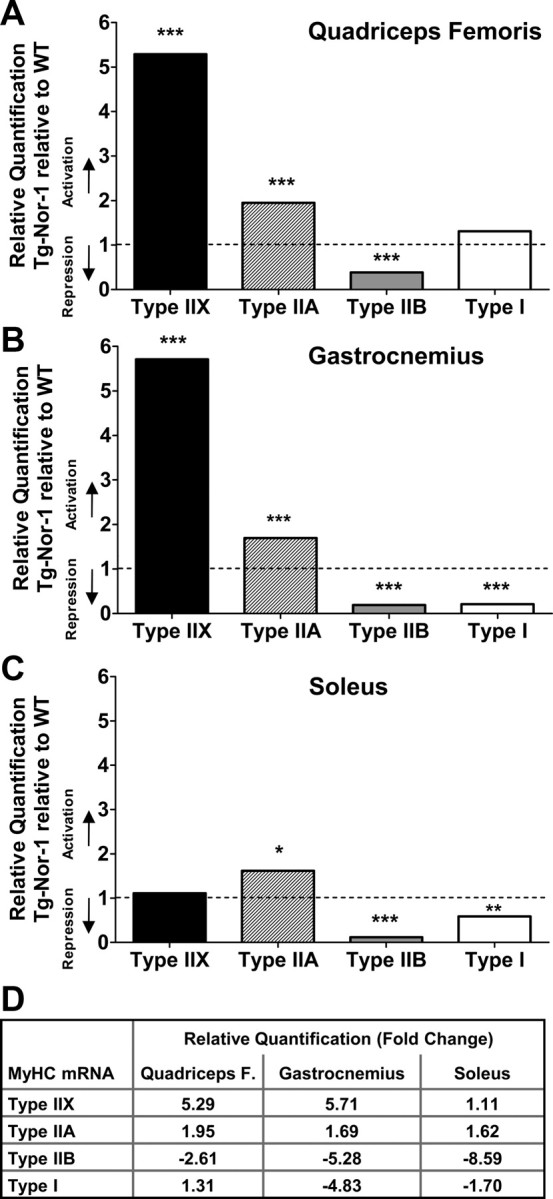
Expression of the Nor-1 transgene in mouse skeletal muscle alters the mRNA expression of MyHC isoforms. The mRNA expression of MyHC isoforms (MyHC IIX, IIA, IIB, and I, corresponding to mRNA Myh1, Myh2, Myh4, and Myh7, respectively) was assayed using qRT-PCR in quadriceps femoris (A), gastrocnemius (B), and soleus skeletal muscle (C) (n = 5–8). qRT-PCR was processed using Integromics StatMiner software suite and normalized to 18S rRNA. D, Table summarizing type IIX, IIA, IIB, and I MyHC mRNA fold activation and repression in quadriceps femoris (F), gastrocnemius, and soleus (for complete data of statistical analysis, see Supplemental Table 1). *, P < 0.05; **, P < 0.01; ***, P < 0.001.
Fig. 5.
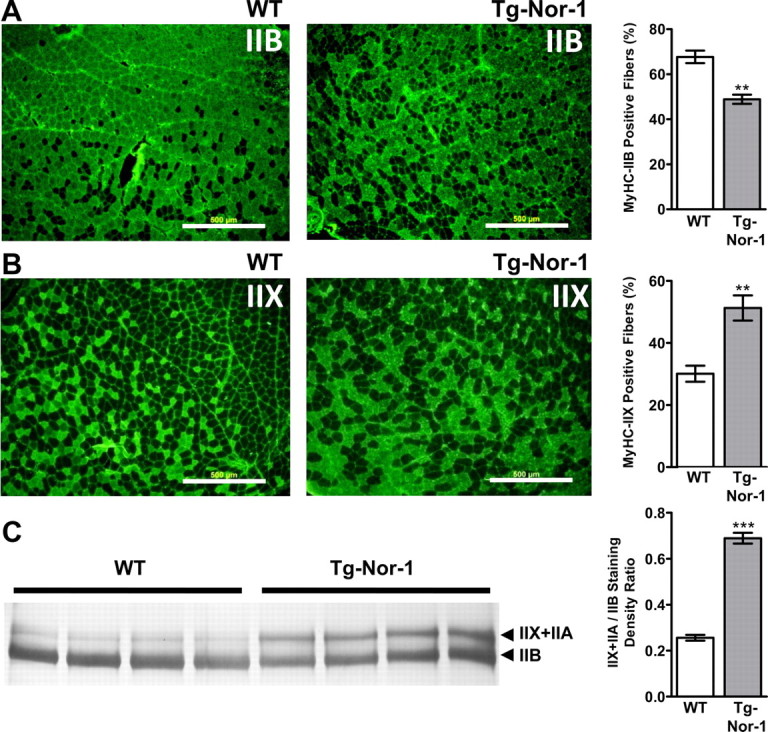
Nor-1 transgenic mice display alterations in MyHC isoform proteins. Immunofluorescence was used to detect skeletal muscle fibers expressing MyHC IIB (A) and MyHC IIX (B) on transverse tibialis anterior cryosections from WT and transgenic (Tg-Nor-1) mice. Representative microphotographs (n = 3) are shown. Scale bar, 500 μm. Positive staining fibers were manually counted and calculated as percentage. C, High-resolution SDS-PAGE of MyHC isoforms from quadriceps femoris in WT and transgenic mice (n = 4) with quantification by densitometry. **, P < 0.01; ***, P < 0.001.
In summary, these qRT-PCR, protein, histochemical, and electron microscopy studies demonstrated that Nor-1 expression induced the acquisition of an oxidative phenotype that was characterized by an increase in the ratio of IIX/A to IIB muscle fibers.
The transition to a type IIX (and IIA) phenotype involves increased phospho-histone deacetylase (HDAC)5 expression
The type I and II (A, X, and B) skeletal muscle fiber types are the products of a coordinated regulation of complex genetic programs that act in a concerted manner and encode contractile proteins, metabolic enzymes, myokines, etc. that produce skeletal muscle with unique metabolic and movement-dependent features. The physiological and environmental stimuli, and demands on skeletal muscle, activate specific effector signaling pathways, including calcium/calcineurin signaling, transcription factors [nuclear factor of activated T cells 1–4, myogenic differentiation 1 (MyoD), and myocyte enhancer factor 2 (MEF2)], and coregulators [peroxisome proliferator-activated receptor gamma coactivator 1 (PGC1)] that modulate the environment/signal-dependent phenotype of this critical peripheral tissue.
Olson and co-workers (42) have demonstrated that HDAC4/5 phosphorylation is involved in oxidative fiber identity (increased type I and IIA MyHC, increased myoglobin protein expression, and decreased type IIB mRNA expression) and increased muscle performance and fatigue resistance. The transgenic Nor-1 mice displayed many of these characteristics. Consequently, we performed Western blot analysis with HDAC antibodies on cell extracts isolated from the quadriceps femoris skeletal muscle from WT and Nor-1 Tg-Nor-1 mice (Fig. 6). We observed increased expression of p-HDAC5 (Ser259) in the Tg-Nor-1 mice (relative to WT) but not p-HDAC5 (Ser498), p-HDAC4 (Ser246), or p-HDAC7 (Ser155) (Fig. 6A). We did not observe any changes in (total) HDAC4 and HDAC5 expression. The results were consistent with: 1) increases in myoglobin and mitochondrial density, and 2) increases and decreases in type IIX (and IIA) and type IIB MyHC, respectively. In concordance, with the increased phosphorylation status of HDAC5 in the Tg-Nor-1 mice, immunofluorescence analysis revealed nuclear staining in WT mice and, predominantly, cytoplasmic staining of HDAC5 in the Tg-Nor-1 mice (Fig. 6B). This is in concordance with the previously reported phosphorylation-mediated nucleocytoplasmic shuttling of HDAC5 (43).
Fig. 6.
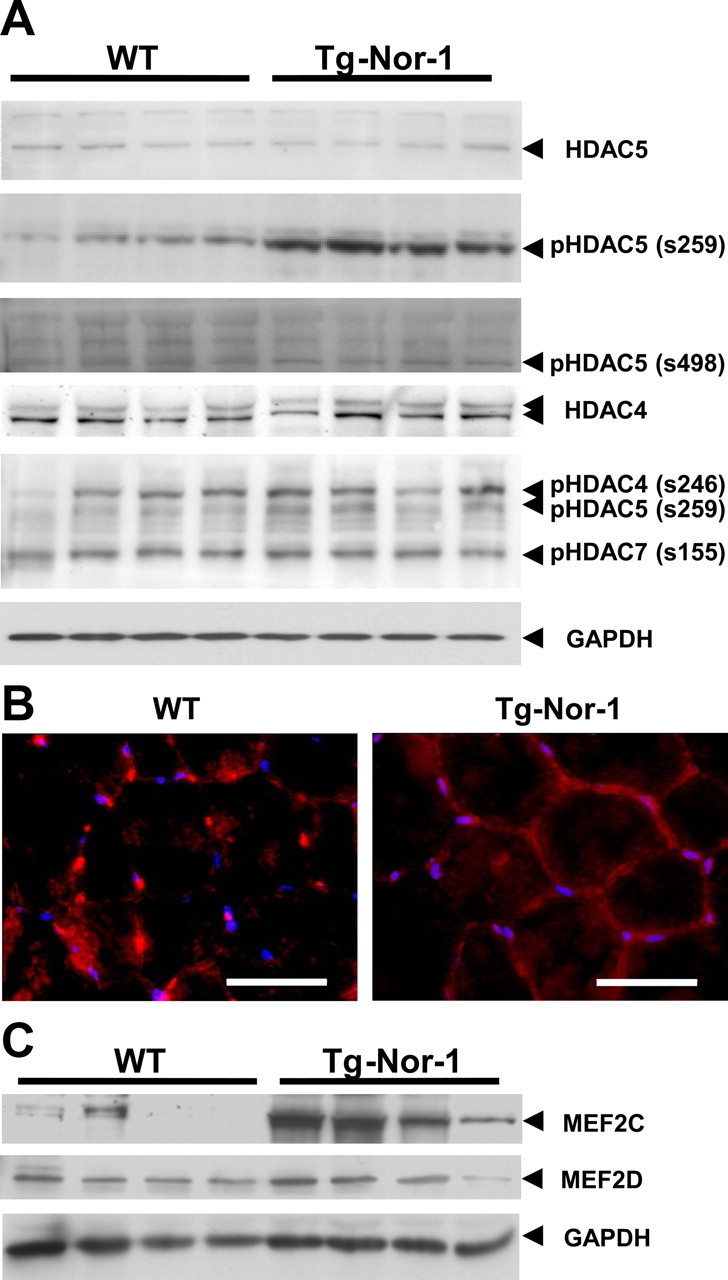
Phosphorylation of HDAC5 is enhanced in Nor-1 transgenic mice. A, Western blotting of quadriceps femoris protein extract from WT and transgenic (Tg-Nor-1) mice (n = 4). Specific antibodies were used to detect total HDAC5, phospho-HDAC5 (Ser259 and Ser498), HDAC4, phospho-pHDAC4/5/7 (Ser246/259/155, respectively), and GAPDH (loading control). B, Immunofluorescence was used to localize HDAC5 (red) in transverse tibialis anterior cryosections from WT and transgenic (Tg-Nor-1) mice with 4′,6-diamidino-2-phenylindole (DAPI) nuclear stain (blue). Representative microphotographs (n = 3) are shown. Scale bar, 50 μm. C, Specific antibodies were used to detect MEF2C, MEF2D, and GAPDH (loading control).
Class II HDACs are regulated by multiple signaling pathways, and many protein kinases operate as HDAC kinases that are involved in the regulation of the muscle phenotype (44–46) and/or metabolic homeostasis (47–49). For example, protein kinase D1 (PKD1) and AMP-activated protein kinase to name a few, phosphorylate HDAC5 and control its subcellular localization and activity. We examined the expression of pAMPK and pPKD1 and did not observe differential expression of these activated kinases in the transgenic mice (see Supplemental Fig. 2). Further systematic analysis of the many HDAC kinases [for example, calcium/calmodulin-dependent protein kinases I/IV, salt-inducible kinase 1, minibrain-related kinase (DYRK1B), etc.] will be required to identify the specific HDAC kinase activated in the Tg-Nor-1 mice.
In addition, we used qRT-PCR analysis on a custom microfluidic TaqMan Low Density Array (TLDA) platform to assay multiple genes (against six internal/normalization controls) that characterize (type I/II) slow/fast muscle fiber type and that control (and/or are involved in) contractile protein remodeling/signaling pathways discussed above. Quantitative PCR of soleus, gastrocnemius, and quadriceps femoris skeletal muscle on our custom TLDA again validated the significant differential increased and decreased expression of MyHC IIX and IIB, respectively (Supplemental Table 2). We also assayed the expression of the NFAT family (c1-4) that modulates type I and II MyHC gene expression. However, we did not observe the differential expression of these mRNAs that encode these four DNA binding proteins. In addition, we assayed the expression of the MyoD and myogenin (basic helix loop helix factors), and the Mef2A-D (MADS box factors), because differential (and specific) expression of these factors has been associated with type I/II and oxidative/glycolytic muscle. We identified significantly increased levels of the mRNA encoding MyoD and Mef2C (Table 1 and Supplemental Table 2 for complete statistical analysis). Furthermore, we observed increases in total MEF2C protein expression after Western blot analysis (Fig. 6C). Interestingly, we did not detect differential expression of Pgc1α and Pgc1β in soleus/type I and gastrocnemius/type II skeletal muscle (Table 1). In summary, the transition in fiber type is associated with increased (Ser259) phosphorylation of HDAC5, nucleocytoplasmic shuttling of HDAC5, and MEF2C expression (mRNA and protein).
Table 1.
Expression of mRNA encoding important skeletal muscle transcriptional factors
| Detector | Quadriceps |
Gastrocnemius |
Tibialis anterior |
Soleus |
||||
|---|---|---|---|---|---|---|---|---|
| RQ | P value | RQ | P value | RQ | P value | RQ | P value | |
| Nfatc1 | 0.931 | 1.218 | 0.891 | 1.431 | ||||
| Nfatc2 | 0.948 | 1.126 | 0.930 | 0.709 | a | |||
| Nfatc3 | 0.875 | 1.015 | 0.883 | 1.253 | ||||
| Nfatc4 | 1.122 | 1.235 | 1.168 | 1.257 | ||||
| Mef2a | 1.017 | 1.232 | 1.405 | 1.522 | a | |||
| Mef2b | 1.064 | 0.850 | 2.102 | 0.912 | ||||
| Mef2c | 1.976 | b | 1.924 | b | 1.482 | 1.541 | b | |
| Mef2d | 0.717 | 0.947 | 0.864 | 1.601 | a | |||
| Myod1 | 2.320 | a | 1.650 | 1.883 | a | 2.366 | ||
| Myog | 1.546 | 1.565 | 2.495 | b | 1.652 | |||
| Ppargc1a | 1.411 | 1.206 | 1.068 | |||||
| Ppargc1b | 1.328 | 1.302 | 0.874 | |||||
Table summarizing mRNA fold activation and repression in quadriceps femoris, gastrocnemius, tibialis anterior, and soleus of transgenic mice relative to WT mice (n = 4). Data are presented as relative quantification (RQ), calculated fold differences (normalized to Hprt1). Numbers less than 1.0 represent repression, and numbers more than 1.0 represent induction. Differential expression and statistical analysis were calculated using Integromics StatMiner software suite, as described in Materials and Methods. For complete data of statistical analysis, see Supplemental Table 2.
P < 0.05.
P < 0.01.
Tg-Nor-1 mice display improved glucose tolerance, and exercise endurance in the absence of increased insulin sensitivity
The marked increases in type IIX and IIA fibers, associated with decreases in type IIB fibers, suggested a shift toward a more oxidative muscle fiber type, indicative of improved glucose tolerance, insulin sensitivity, and running endurance (34, 39, 40, 50).
We examined male WT and heterozygous transgenic Nor-1 mice fed with a normal diet until 12 wk. We observed no significant differences in blood glucose levels in heterozygous Nor-1 transgenic mice relative to WT mice after an overnight fast (data not shown). We performed IP glucose tolerance tests (GTT) (Fig. 7A). In the transgenic Nor-1 mice, glucose clearance was significantly improved after a glucose challenge (see GTT and area under the curve, Fig. 7A, inset). Interestingly, the transgenic Nor-1 mice did not display a significantly improved response to the administration of IP insulin (Fig. 7B).
Fig. 7.

Expression of the Nor-1 transgene in mouse skeletal muscle alters blood glucose clearance and enhances running endurance. Glucose (A) and insulin (B) tolerance measured via blood glucose levels were compared in both WT and transgenic (TG-Nor-1) mice (n = 12–16). Statistical significance was assessed using a one-way ANOVA with Bonferroni's post hoc test. Area under the curve was determined for GTT (A, inset). C, The protein levels of GLUT4 and GAPDH were determined via Western blotting with quantification by densitometry. D, Oxygen consumption volume (VO2) corrected for body weight in WT and transgenic mice (n = 7–12). Average oxygen consumption volume corrected for body weight over 24 h (D, inset). E, Indirect calorimetry was used to calculate heat production corrected for body weight (n = 7–12). Average heat production corrected for body weight over 24 h (E, inset). F, Small animal treadmill was used to measure (i) running endurance distance, (ii) running time, and (iii) maximum running speed in WT and transgenic mice (n = 4). *, P < 0.05; **, P < 0.01; ***, P < 0.001.
We further investigated improved glucose tolerance by Western blot analysis of glucose transporter (GLUT)4 protein expression. McGee et al. (47) reported that phosphorylation of HDAC5 reduces association with the Glut4 promoter and increases nuclear export (see Fig. 6B). In concordance, we observed a significant (P < 0.05) 2-fold increase in the expression of GLUT4 protein in the skeletal muscle from the Tg-Nor-1 mice, relative to WT littermates (Fig. 7C). In addition, we suggest that the improved glucose tolerance independent of whole-body insulin action (relative to the WT mice) is associated with the marked increase in skeletal muscle oxidative capacity. In summary, the Nor-1 transgenic mice displayed improved glucose tolerance, in accordance with the skeletal muscle fiber type (and increased GLUT4 expression) induced by Nor-1 expression in this line of mice.
We measured oxygen consumption and energy expenditure using metabolic cages. Increased expression of IIA/X fibers, associated with decreased type IIB, coupled to increases in myoglobin and mitochondria is suggestive of increased oxidative capacity. The indirect calorimetry studies demonstrated that the transgenic mice (relative to WT littermates) displayed significantly increased oxygen consumption and energy expenditure (Fig. 7, D and E).
We further evaluated the impact of acquiring an improved oxidative skeletal muscle phenotype on endurance. This was evaluated on treadmills to exercise mice to exhaustion. The Nor-1 transgenic line displayed significantly increased resistance to fatigue, for example, we observed that the transgenic mice could run for increased distance and time (Fig. 7F, i and ii, respectively). Secondly, we used the treadmills to evaluate the maximal running speed of the WT and Nor-1 transgenic mice. We observed that the WT mice on average could run at a significantly higher speed than the Nor-1 transgenic mice line (Fig. 7iii). In summary, the increase in type IIA/X fibers (associated with decreases in type IIB) driven by Nor-1 expression lead to improved glucose tolerance, oxidative capacity, and exercise endurance.
Discussion
We report here that ectopic skeletal muscle-specific transgenic expression of activated Nor-1 (driven by the HSA promoter) increases the endurance of C57BL/6J mice. The fatigue-resistant phenotype is associated with increased: 1) myoglobin expression, 2) expression of mitochondrial electron transport genes/enzymes, 3) mtDNA and density, and 4) IIX (and IIA) MyHC mRNA/protein expression coupled to decreases in type IIB MyHC. Moreover, this transition from a predominantly type II glycolytic muscle phenotype to an intermediate type II oxidative phenotype involves increased phosphorylation of HDAC5 and nucleo-cytoplasmic shuttling of HDAC5 that has been previously implicated in fiber type remodeling and associated with the acquisition of oxidative characteristics (43).
As discussed, the expression of Nor-1 (NR4A3) is markedly induced in type I and II skeletal muscle after treatment with β-adrenergic agonists (10, 21). Furthermore, β-adrenergic signaling regulates lipolysis and energy expenditure in skeletal muscle (51–54), suggesting that Nor-1 may mediate skeletal muscle metabolism. In this context, targeted silencing of Nor-1/NR4A3 in skeletal muscle suggested that this NR was necessary for oxidative metabolism (10). In concordance with this previous study, the preferential ectopic expression of the activated Nor-1 transgene in skeletal muscle resulted in the acquisition of a more oxidative and fatigue-resistant muscle phenotype (associated with increased mitochondrial density and increased expression of myoglobin and mitochondrial electron transport genes). In concordance with the described phenotype of the Nor-1-activated mice, impaired β-adrenergic signaling in rodent models reduced exercise endurance (55).
Interestingly, type 2 diabetes and insulin resistance have been associated with decreased oxidative phosphorylation capacity and/or mitochondrial content. However, decreased oxidative capacity is not the major cause of insulin resistance (56). This study demonstrates that increased oxidative capacity (and mitochondrial content) can lead to improved glucose tolerance and fatigue resistance in the absence of increased insulin sensitivity.
As mentioned above, we observed that the acquisition of the fatigue-resistant phenotype involved the increased expression of phospho-HDAC5 (Ser259). The class II HDACs (HDAC4/5) are known to modulate the expression of genes underlying the contractile protein remodeling associated with the transition to a more oxidative (and/or type I/slow twitch) muscle phenotype (reviewed in Ref. 46). Interestingly, increased HDAC4 and/or HDAC5 phosphorylation driven by constitutively active PKD1 expression (a skeletal muscle class II HDAC kinase) in transgenic mice increases fatigue resistance, increases type I and IIA MyHC, decreases type IIB mRNA expression, and increases myoglobin protein expression. These results are strikingly similar to observations in the Tg-Nor-1 line. We observed increased type IIA (and decreased type IIB MyHC), correlated with elevated myoglobin and the expression of genes/enzymes involved in mitochondrial oxidative phosphorylation. However, our phenotype has a unique contractile protein footprint and is distinguished by the associated dramatic induction of type IIX MyHC.
In the context of NRs that control metabolism, skeletal muscle-specific expression of several NR and NR cofactors have been associated with increased oxidative capacity and fatigue resistance. For example, skeletal muscle-specific overexpression/activation of the NRs: PPARδ (31), ERRγ (34), and NR cofactors PGC-1α (40) and PGC-1β (39) all display skeletal muscle with increased oxidative capacity. The current study further substantiates the role of NRs in the regulation of skeletal muscle fiber type. We conclude that skeletal muscle fiber type is not only regulated by an exercise-sensitive calcineurin-induced signaling cascade but also by NR signaling pathways. Further, this is the first demonstration of skeletal muscle fiber type regulation by a member of the NR4A subgroup. This reinforces the importance of NR function in the regulation of skeletal muscle performance and metabolic function.
Materials and Methods
Generation transgenic mice
All animal-related procedures were approved by the Animal Experimentation Ethics Committees of The University of Queensland and conformed to the Guidelines for the Care and Use of Experimental Animals described by the National Health and Medical Research Council of Australia. To activate Nor-1, the small activation domain of the Herpes simplex VP16 (57) was fused in frame to the N terminus of the full-length Nor-1 cDNA coding sequence. The VP16-Nor-1 chimera was obtained from the full-length pNLVP16-Nor-1 vector that has been described before (58). The VP16-Nor-1 coding sequence was ligated into the pSG5-HSA vector described in Ref. 36. The pSG5-HSA-VP16-Nor-1 vector was codigested with BssSI and PvuI to produce the transgene cassette containing HSA promoter and VP16-Nor-1 coding sequence. The linearized Tg-HSA-VP16-Nor-1 construct was injected into the pronuclei of F1 BCB(C57BL/6J X CBA) zygotes (performed by the Transgenic Animal Services of Queensland, The University of Queensland) to generate founder mice. The transgenic Nor-1 founder and descendant mice have a transgene copy number equal to one. Mice were maintained on a 12-h light, 12-h dark cycle, with standard mouse chow (Meat Free Rat and Mouse; Specialty Feeds, Glen Forrest, Australia) and water provided ad libitum at The University of Queensland Biological Resources animal house facility. All experiments were performed on male mice of 11–16 wk of age. All experimental mice were backcrossed to the C57BL/6J background for greater than six generations, and experiments consist of heterozygous transgenic mice with WT siblings.
RNA extraction, cDNA synthesis, and quantitative real-time PCR
WT and transgenic mice were euthanized with carbon dioxide with organs/tissues surgically excised. All samples were snap frozen in liquid nitrogen. RNA and cDNA synthesis was carried out as described in Refs. 59, 60. Target cDNA were compared by qRT-PCR in 25-μl reactions as described in Ref. 59. Expression levels were normalized to control genes as stated. TLDA platform was used as previously described (19, 60, 61), in a custom-designed format, which includes TaqMan primer/probe sets for genes involved in metabolism and myogenesis.
qRT-PCR for mtDNA quantification
Total DNA was extracted from homogenized and sonicated skeletal muscle samples using DNeasy Blood & Tissue kit (QIAGEN, Valencia, CA). Target mtDNA and gDNA were amplified from 0.1 μg of total DNA using SYBR Green Master Mix (Applied Biosystems, Foster City, CA) on a ABI Prism 7500 (Applied Biosystems) sequence detection system, qRT-PCR was conducted over 45 cycles of 95 C for 15 sec and 60 C for 1 min, preceded by an initial 95 C for 10 min. mtDNA/gDNA ratio was determined from δ cycle threshold values.
Primers
Primers for analysis of cDNA populations using SYBR green have been described in detail for 36b4 (62). SYBR primers were designed using Primer Express (Applied Biosystems) for: VP16-Nor-1 mRNA and genotyping forward (F), CCC AAA AAA GAA GAG AAA GGT AGA TG and reverse (R), ACG TCC TCG CCG TCT AAG TG; endogenous Nor-1 mRNA F, TCA CTT TGC AAC GCT GAC AGA and R, GGT AGG ATG TCG CCA CGT TT; Polg2 gDNA F, CGC AGC CGA GGG ACA GT and R, AAG AAA TGC CAC TAG CTG TTC CTT; and Rnr2 mtDNA F, CCG AAA CCA AAC GAG CTA CCT and R, CTC GTT AGG CTT TTC ACC TCT ACC T. Assay-on-Demand TaqMan primer/probe sets were used for all other expression analysis with primer information described in Supplemental Table 3.
Western blot analysis
Western blot analysis was carried out as described (10). Blots were probed with anti-Nor-1 (1:300; Santa Cruz Biotechnology, Inc., Santa Cruz, CA), MitoProfile Total OXPHOS Rodent WB Antibody cocktail (1:500, MS604; MitoSciences, Eugene, OR), anti-HDAC5 (no. 2082, 1:1000; Cell Signaling, Beverly, MA), anti-pHDAC5 (Ser259, ab53693, 1:1000; Abcam, Cambridge, MA), anti-HDAC4 (no. 5392, 1:1000; Cell Signaling), anti-pHDAC4/5/7 (Ser246/259/155, respectively, no. 3443, 1:1000; Cell Signaling), antiglyceraldehyde-3-phosphate dehydrogenase (GAPDH) (2275-PC-100, 1:20,000; Trevigen, Gaithersburg, MD), anti-MEF2c (Ab64644, 1:1000; Abcam), anti-MEF2d (Ab32845, 1:1000; Abcam), anti-GLUT4 (Ab62375, 1:5000; Abcam), anti-pPKD1 (S738+S742, ab74105, 1:1000; Abcam), anti-AMPKα (no. 2532, 1:1000; Cell Signaling), or anti-pAMPKα (Thr172, no. 2535S, 1:1000; Cell Signaling) in Tris-buffered saline with 5% skim milk powder (or 1% BSA for antiphospho-proteins). Secondary antirabbit/mouse-horseradish peroxidase (Pierce Biotechnology, Rockford, IL) was used at 1:5000 to 1:10,000 in 5% skim milk powder. Densitometry was performed using ImageJ (63).
Histological analyses
Tibialis anterior muscle was mounted in optimal cutting temperature compound and frozen in melting isopentane cooled in liquid nitrogen; 10-μm transverse sections from the midbelly region of the muscle were cut on a cryostat. Cryosections were stained for SDH activity as previously described (42) and NADH activity as previously described (64). Histology was performed on three WT and three transgenic mice (n = 3), and microphotographs are a representative image. Images were taken with an Olympus BX-51 fluorescence microscope (Olympus, Tokyo, Japan).
Immunofluorescence
Tibialis anterior transverse cryosections (10 μm) were created as described above. For myofiber analysis, section were fixed with ice-cold acetone for 5 min and allowed to dry. Concentrated lysate from monoclonal antibodies 6H1 and 10F5 described in Lucas et al. (65) was obtained from the Developmental Studies Hybridoma Bank. Sections were blocked in 5% goat serum and treated with 1:10 dilutions of 6H1 and 10F5 in 5% goat serum. Sections were then treated with Alexa Fluor 488 goat antimouse (Invitrogen, Carlsbad, CA) at 1:50. For HDAC5 analysis, sections were fixed with 4% formaldehyde in PBS for 15 min. Sections were blocked in 5% goat serum and treated with anti-HDAC5 (no. 2082; Cell Signaling) at 1:100 in 5% goat serum. Sections were then treated with Alexa Fluor 594 goat antirabbit (Invitrogen) at 1:100. Immunofluorescence was performed on three WT and three transgenic mice (n = 3), and microphotographs are a representative image. No fluorescence was visible in secondary-only controls. Images were taken with an Olympus BX-51 fluorescence microscope. For myofiber analysis, positive fibers were manually quantified.
Electron microscope and volume occupancy percentage (Vv%)
Skeletal muscle samples (tibialis anterior, soleus, and EDL) were collected from adult mice (n = 3). Samples were processed at the Australian Microscopy and Microanalysis Research Facility according to standard protocol. The Vv% occupied by mitochondria was estimated by intersection counting as described (66). Briefly, images were captured at random from different areas using a magnification of ×20,000 and overlaid with appropriate double-lattice grids to measure intersections with mitochondria (20 fields/tissue per animal).
High-resolution SDS-PAGE
Whole skeletal muscle extracts were examined using the method of Rossini et al. (67) in a Bio-Rad Mini-Protean II electrophoresis system (Bio-Rad, Hercules, CA) with 0.1 μg of skeletal muscle protein added per lane. Gels were silver stained using the method of (68). Gels were scanned and densitometry was performed using ImageJ (63).
GTT and insulin tolerance testing
Was performed as described in Ref. 36 with mice fasted overnight for glucose and 6 h for insulin tolerances tests. Insulin (Actrapid; Novo Nordisk, Bagsværd, Denmark) was used at 0.75 U.
Oxygen consumption and heat production
Oxygen consumption was measured using Columbus Instruments Comprehensive Lab Animal Monitoring System (Columbus, OH). Mice were acclimated for 1 d and then measured over the next night and day cycle.
Treadmill running
Mice were run on an Exer 3/6 Treadmill (Columbus Instruments) with mild electrical stimulus at 5% inclination. Mice were trained by running once per day for 30 min at 10 m/min for 3 d. To test maximal running speed, mice were acclimated for a period of 30 min at 10 m/min followed by acceleration for 1 m/min until exhaustion. For endurance tests, mice were acclimated for 60 min at 10 m/min followed by incremental acceleration (1 m/min every 5 min) to a maximum speed of 20 m/min until exhaustion. Exhaustion was defined by failure to run for greater than 10 sec.
Statistical analysis
Statistical analysis for all non-TLDA qRT-PCR data were performed using Prism 4 (GraphPad Software, San Diego, CA). Non-TLDA data were analyzed using Student's t test unless otherwise stated. All results are expressed as means ± sem. Significant changes in expression of TLDA data were analyzed using the ABI/Integromics StatMiner software package (Philadelphia, PA), previously described (19, 60, 61). Differentially expressed genes were identified by Linear models (contained in the LIMMA package for Bioconductor R embedded in StatMiner). Significance is assigned by the application of the Empirical Bayes statistic, described as equivalent to shrinkage of the estimated sample variances toward a pooled estimate, resulting in far more stable inference when the number of arrays is small (69). It returns the empirical Bayes log odds of differential expression (i.e. the probability) that a gene is differentially expressed (a higher score represents a more significant result). For example, B statistic of 0 indicates a 50:50 chance of differential expression, B scores more than 0 indicate more than 50:50 chance of differential expression, B less than 0 (−ve scores) reflect odds that a gene is more than likely, not differentially expressed. The B statistic considers and ranks a proportion of differentially expressed genes (P < 0.01). Analysis also includes t, the empirical Bayes moderated t statistic (a variant t test), an empirically moderated estimate of se. Data are presented as relative quantification (RQ), i.e. the calculated fold differences normalized to one of the selected controls (for example, 18S rRNA) between the transgenic and the WT littermates. RQ was determined using the equation: RQ = 2−ΔΔCt (70).
Acknowledgments
We thank the facilities and the scientific and technical assistance of Dr. Kathryn Green of the Australian Microscopy and Microanalysis Research Facility at the Centre for Microscopy and Microanalysis (The University of Queensland) and the Welford Donation. The monoclonal antibodies 6H1 and 10F5 developed by Christine Lucas (Department of Physiology, University of Sydney, Sydney, Australia) were obtained from the Developmental Studies Hybridoma Bank developed under the auspices of the National Institute of Child Health and Human Development and maintained by Department of Biology (The University of Iowa, Iowa City, IA).
This work was supported by a research project grant from the National Health and Medical Research Council (NHMRC) of Australia. G.E.O.M. is a Principal Research Fellow of the NHMRC and N.A.E. was a recipient of an Australian Postgraduate Award.
Disclosure Summary: The authors have nothing to disclose.
NURSA Molecule Pages†:
Nuclear Receptors: Nor-1.
Annotations provided by Nuclear Receptor Signaling Atlas (NURSA) Bioinformatics Resource. Molecule Pages can be accessed on the NURSA website at www.nursa.org.
- EDL
- Extensor digitorum longus
- F
- forward
- gDNA
- genomic DNA
- GAPDH
- glyceraldehyde-3-phosphate dehydrogenase
- GLUT
- glucose transporter
- GTT
- glucose tolerance test
- HSA
- human skeletal muscle α-actin
- HDAC
- histone deacetylase
- MEF2
- myocyte enhancer factor 2
- Mfn2
- mitofusin-2
- mtDNA
- mitochondrial DNA
- MyHC
- myosin heavy chain
- MyoD
- myogenic differentiation 1
- NADH
- nicotinamide adenine dinucleotide hydride
- Ndufb
- NADH dehydrogenase (ubiquinone) 1β
- Nor-1
- neuron-derived orphan receptor 1
- NR
- nuclear hormone receptor
- PGC1
- peroxisome proliferator-activated receptor gamma coactivator 1
- PKD1
- protein kinase D1
- qRT-PCR
- quantitative RT-PCR
- R
- reverse
- RQ
- relative quantification
- SDH
- succinate dehydrogenase
- Sdhb
- succinate dehydrogenase complex, subunit B, iron sulfur
- TLDA
- TaqMan Low Density Array
- Uqcrc2
- ubiquinol-cytochrome c reductase complex III protein 2
- VP16
- viral protein 16
- Vv%
- volume occupancy percentage
- WT
- wild type.
References
- 1. Chawla A , Repa JJ , Evans RM , Mangelsdorf DJ. 2001. Nuclear receptors and lipid physiology: opening the X-files. Science 294:1866–1870 [DOI] [PubMed] [Google Scholar]
- 2. Wilson TE , Fahrner TJ , Johnston M , Milbrandt J. 1991. Identification of the DNA binding site for NGFI-B by genetic selection in yeast. Science 252:1296–1300 [DOI] [PubMed] [Google Scholar]
- 3. Wansa KD , Harris JM , Yan G , Ordentlich P , Muscat GE. 2003. The AF-1 domain of the orphan nuclear receptor NOR-1 mediates trans-activation, coactivator recruitment, and activation by the purine anti-metabolite 6-mercaptopurine. J Biol Chem 278:24776–24790 [DOI] [PubMed] [Google Scholar]
- 4. Chintharlapalli S , Burghardt R , Papineni S , Ramaiah S , Yoon K , Safe S. 2005. Activation of Nur77 by selected 1,1-Bis(3′-indolyl)-1-(p-substituted phenyl)methanes induces apoptosis through nuclear pathways. J Biol Chem 280:24903–24914 [DOI] [PubMed] [Google Scholar]
- 5. Zhan Y , Du X , Chen H , Liu J , Zhao B , Huang D , Li G , Xu Q , Zhang M , Weimer BC , Chen D , Cheng Z , Zhang L , Li Q , Li S , Zheng Z , Song S , Huang Y , Ye Z , Su W , Lin SC , Shen Y , Wu Q. 2008. Cytosporone B is an agonist for nuclear orphan receptor Nur77. Nat Chem Biol 4:548–556 [DOI] [PubMed] [Google Scholar]
- 6. Kagaya S , Ohkura N , Tsukada T , Miyagawa M , Sugita Y , Tsujimoto G , Matsumoto K , Saito H , Hashida R. 2005. Prostaglandin A2 acts as a transactivator for NOR1 (NR4A3) within the nuclear receptor superfamily. Biol Pharm Bull 28:1603–1607 [DOI] [PubMed] [Google Scholar]
- 7. Hintermann S , Chiesi M , von Krosigk U , Mathé D , Felber R , Hengerer B. 2007. Identification of a series of highly potent activators of the Nurr1 signaling pathway. Bioorg Med Chem Lett 17:193–196 [DOI] [PubMed] [Google Scholar]
- 8. Dubois C , Hengerer B , Mattes H. 2006. Identification of a potent agonist of the orphan nuclear receptor Nurr1. ChemMedChem 1:955–958 [DOI] [PubMed] [Google Scholar]
- 9. Pearen MA , Muscat GE. 2010. Minireview: nuclear hormone receptor 4A signaling: implications for metabolic disease. Mol Endocrinol 24:1891–1903 [DOI] [PMC free article] [PubMed] [Google Scholar]
- 10. Pearen MA , Myers SA , Raichur S , Ryall JG , Lynch GS , Muscat GE. 2008. The orphan nuclear receptor, NOR-1, a target of β-adrenergic signaling, regulates gene expression that controls oxidative metabolism in skeletal muscle. Endocrinology 149:2853–2865 [DOI] [PubMed] [Google Scholar]
- 11. Maxwell MA , Cleasby ME , Harding A , Stark A , Cooney GJ , Muscat GE. 2005. Nur77 regulates lipolysis in skeletal muscle cells. Evidence for cross-talk between the β-adrenergic and an orphan nuclear hormone receptor pathway. J Biol Chem 280:12573–12584 [DOI] [PubMed] [Google Scholar]
- 12. Chao LC , Zhang Z , Pei L , Saito T , Tontonoz P , Pilch PF. 2007. Nur77 coordinately regulates expression of genes linked to glucose metabolism in skeletal muscle. Mol Endocrinol 21:2152–2163 [DOI] [PMC free article] [PubMed] [Google Scholar]
- 13. Kanzleiter T , Schneider T , Walter I , Bolze F , Eickhorst C , Heldmaier G , Klaus S , Klingenspor M. 2005. Evidence for Nr4a1 as a cold-induced effector of brown fat thermogenesis. Physiol Genomics 24:37–44 [DOI] [PubMed] [Google Scholar]
- 14. Kumar N , Liu D , Wang H , Robidoux J , Collins S. 2008. Orphan nuclear receptor NOR-1 enhances 3′,5′-cyclic adenosine 5′-monophosphate-dependent uncoupling protein-1 gene transcription. Mol Endocrinol 22:1057–1064 [DOI] [PMC free article] [PubMed] [Google Scholar]
- 15. Roche E , Buteau J , Aniento I , Reig JA , Soria B , Prentki M. 1999. Palmitate and oleate induce the immediate-early response genes c-fos and nur-77 in the pancreatic β-cell line INS-1. Diabetes 48:2007–2014 [DOI] [PubMed] [Google Scholar]
- 16. Susini S , Roche E , Prentki M , Schlegel W. 1998. Glucose and glucoincretin peptides synergize to induce c-fos, c-jun, junB, zif-268, and nur-77 gene expression in pancreatic β (INS-1) cells. FASEB J 12:1173–1182 [PubMed] [Google Scholar]
- 17. Wu X , Wang J , Cui X , Maianu L , Rhees B , Rosinski J , So WV , Willi SM , Osier MV , Hill HS , Page GP , Allison DB , Martin M , Garvey WT. 2007. The effect of insulin on expression of genes and biochemical pathways in human skeletal muscle. Endocrine 31:5–17 [DOI] [PubMed] [Google Scholar]
- 18. Rius J , Martínez-González J , Crespo J , Badimon L. 2004. Involvement of neuron-derived orphan receptor-1 (NOR-1) in LDL-induced mitogenic stimulus in vascular smooth muscle cells: role of CREB. Arterioscler Thromb Vasc Biol 24:697–702 [DOI] [PubMed] [Google Scholar]
- 19. Wang SC , Myers SA , Eriksson NA , Fitzsimmons RL , Muscat GE. 2011. Nr4a1 siRNA expression attenuates α-MSH regulated gene expression in 3T3-L1 adipocytes. Mol Endocrinol 25:291–306 [DOI] [PMC free article] [PubMed] [Google Scholar]
- 20. Fu Y , Luo L , Luo N , Zhu X , Garvey WT. 2007. NR4A orphan nuclear receptors modulate insulin action and the glucose transport system: potential role in insulin resistance. J Biol Chem 282:31525–31533 [DOI] [PubMed] [Google Scholar]
- 21. Pearen MA , Ryall JG , Maxwell MA , Ohkura N , Lynch GS , Muscat GE. 2006. The orphan nuclear receptor, NOR-1, is a target of β-adrenergic signaling in skeletal muscle. Endocrinology 147:5217–5227 [DOI] [PubMed] [Google Scholar]
- 22. Chao LC , Wroblewski K , Zhang Z , Pei L , Vergnes L , Ilkayeva OR , Ding SY , Reue K , Watt MJ , Newgard CB , Pilch PF , Hevener AL , Tontonoz P. 2009. Insulin resistance and altered systemic glucose metabolism in mice lacking Nur77. Diabetes 58:2788–2796 [DOI] [PMC free article] [PubMed] [Google Scholar]
- 23. Kanzleiter T , Wilks D , Preston E , Ye J , Frangioudakis G , Cooney GJ. 2009. Regulation of the nuclear hormone receptor nur77 in muscle: influence of exercise-activated pathways in vitro and obesity in vivo. Biochim Biophys Acta 1792:777–782 [DOI] [PubMed] [Google Scholar]
- 24. Pols TW , Bonta PI , de Vries CJ. 2007. NR4A nuclear orphan receptors: protective in vascular disease? Curr Opin Lipidol 18:515–520 [DOI] [PubMed] [Google Scholar]
- 25. Pei L , Waki H , Vaitheesvaran B , Wilpitz DC , Kurland IJ , Tontonoz P. 2006. NR4A orphan nuclear receptors are transcriptional regulators of hepatic glucose metabolism. Nat Med 12:1048–1055 [DOI] [PubMed] [Google Scholar]
- 26. Owen OE , Reichard GAJ , Boden G , Patel MS , Trapp VE. 1978. Interrelationships among key tissues in the utilization of metabolic substrate. Adv Mod Nutr 2:517–550 [Google Scholar]
- 27. Zurlo F , Larson K , Bogardus C , Ravussin E. 1990. Skeletal muscle metabolism is a major determinant of resting energy expenditure. J Clin Invest 86:1423–1427 [DOI] [PMC free article] [PubMed] [Google Scholar]
- 28. Muscat GE , Kedes L. 1987. Multiple 5′-flanking regions of the human α-skeletal actin gene synergistically modulate muscle-specific expression. Mol Cell Biol 7:4089–4099 [DOI] [PMC free article] [PubMed] [Google Scholar]
- 29. Brennan KJ , Hardeman EC. 1993. Quantitative analysis of the human α-skeletal actin gene in transgenic mice. J Biol Chem 268:719–725 [PubMed] [Google Scholar]
- 30. Li Y , Lazar MA. 2002. Differential gene regulation by PPARγ agonist and constitutively active PPARγ2. Mol Endocrinol 16:1040–1048 [DOI] [PubMed] [Google Scholar]
- 31. Wang YX , Zhang CL , Yu RT , Cho HK , Nelson MC , Bayuga-Ocampo CR , Ham J , Kang H , Evans RM. 2004. Regulation of muscle fiber type and running endurance by PPARδ. PLoS Biol 2:e294. [DOI] [PMC free article] [PubMed] [Google Scholar]
- 32. Noshiro M , Usui E , Kawamoto T , Sato F , Nakashima A , Ueshima T , Honda K , Fujimoto K , Honma S , Honma K , Makishima M , Kato Y. 2009. Liver X receptors (LXRα and LXRβ) are potent regulators for hepatic Dec1 expression. Genes Cells 14:29–40 [DOI] [PubMed] [Google Scholar]
- 33. Suino-Powell K , Xu Y , Zhang C , Tao YG , Tolbert WD , Simons SS , Xu HE. 2008. Doubling the size of the glucocorticoid receptor ligand binding pocket by deacylcortivazol. Mol Cell Biol 28:1915–1923 [DOI] [PMC free article] [PubMed] [Google Scholar]
- 34. Rangwala SM , Wang X , Calvo JA , Lindsley L , Zhang Y , Deyneko G , Beaulieu V , Gao J , Turner G , Markovits J. 2010. Estrogen-related receptor γ is a key regulator of muscle mitochondrial activity and oxidative capacity. J Biol Chem 285:22619–22629 [DOI] [PMC free article] [PubMed] [Google Scholar]
- 35. Fazeli S , Wells DJ , Hobbs C , Walsh FS. 1996. Altered secondary myogenesis in transgenic animals expressing the neural cell adhesion molecule under the control of a skeletal muscle α-actin promoter. J Cell Biol 135:241–251 [DOI] [PMC free article] [PubMed] [Google Scholar]
- 36. Raichur S , Fitzsimmons RL , Myers SA , Pearen MA , Lau P , Eriksson N , Wang SM , Muscat GE. 2010. Identification and validation of the pathways and functions regulated by the orphan nuclear receptor, RORα1, in skeletal muscle. Nucleic Acids Res 38:4296–4312 [DOI] [PMC free article] [PubMed] [Google Scholar]
- 37. Pearce NJ , Arch JR , Clapham JC , Coghlan MP , Corcoran SL , Lister CA , Llano A , Moore GB , Murphy GJ , Smith SA , Taylor CM , Yates JW , Morrison AD , Harper AJ , Roxbee-Cox L , Abuin A , Wargent E , Holder JC. 2004. Development of glucose intolerance in male transgenic mice overexpressing human glycogen synthase kinase-3β on a muscle-specific promoter. Metabolism 53:1322–1330 [DOI] [PubMed] [Google Scholar]
- 38. Wu H , Rothermel B , Kanatous S , Rosenberg P , Naya FJ , Shelton JM , Hutcheson KA , DiMaio JM , Olson EN , Bassel-Duby R , Williams RS. 2001. Activation of MEF2 by muscle activity is mediated through a calcineurin-dependent pathway. EMBO J 20:6414–6423 [DOI] [PMC free article] [PubMed] [Google Scholar]
- 39. Arany Z , Lebrasseur N , Morris C , Smith E , Yang W , Ma Y , Chin S , Spiegelman BM. 2007. The transcriptional coactivator PGC-1β drives the formation of oxidative type IIX fibers in skeletal muscle. Cell Metab 5:35–46 [DOI] [PubMed] [Google Scholar]
- 40. Lin J , Wu H , Tarr PT , Zhang CY , Wu Z , Boss O , Michael LF , Puigserver P , Isotani E , Olson EN , Lowell BB , Bassel-Duby R , Spiegelman BM. 2002. Transcriptional co-activator PGC-1α drives the formation of slow-twitch muscle fibres. Nature 418:797–801 [DOI] [PubMed] [Google Scholar]
- 41. Bach D , Pich S , Soriano FX , Vega N , Baumgartner B , Oriola J , Daugaard JR , Lloberas J , Camps M , Zierath JR , Rabasa-Lhoret R , Wallberg-Henriksson H , Laville M , Palacín M , Vidal H , Rivera F , Brand M , Zorzano A. 2003. Mitofusin-2 determines mitochondrial network architecture and mitochondrial metabolism. A novel regulatory mechanism altered in obesity. J Biol Chem 278:17190–17197 [DOI] [PubMed] [Google Scholar]
- 42. Frey N , Frank D , Lippl S , Kuhn C , Kögler H , Barrientos T , Rohr C , Will R , Müller OJ , Weiler H , Bassel-Duby R , Katus HA , Olson EN. 2008. Calsarcin-2 deficiency increases exercise capacity in mice through calcineurin/NFAT activation. J Clin Invest 118:3598–3608 [DOI] [PMC free article] [PubMed] [Google Scholar]
- 43. McKinsey TA , Zhang CL , Lu J , Olson EN. 2000. Signal-dependent nuclear export of a histone deacetylase regulates muscle differentiation. Nature 408:106–111 [DOI] [PMC free article] [PubMed] [Google Scholar]
- 44. Knight JD , Kothary R. 2011. The myogenic kinome: protein kinases critical to mammalian skeletal myogenesis. Skelet Muscle 1:29. [DOI] [PMC free article] [PubMed] [Google Scholar]
- 45. Martin M , Kettmann R , Dequiedt F. 2007. Class IIa histone deacetylases: regulating the regulators. Oncogene 26:5450–5467 [DOI] [PubMed] [Google Scholar]
- 46. Bassel-Duby R , Olson EN. 2006. Signaling pathways in skeletal muscle remodeling. Annu Rev Biochem 75:19–37 [DOI] [PubMed] [Google Scholar]
- 47. McGee SL , van Denderen BJ , Howlett KF , Mollica J , Schertzer JD , Kemp BE , Hargreaves M. 2008. AMP-activated protein kinase regulates GLUT4 transcription by phosphorylating histone deacetylase 5. Diabetes 57:860–867 [DOI] [PubMed] [Google Scholar]
- 48. Wang B , Moya N , Niessen S , Hoover H , Mihaylova MM , Shaw RJ , Yates JR , Fischer WH , Thomas JB , Montminy M. 2011. A hormone-dependent module regulating energy balance. Cell 145:596–606 [DOI] [PMC free article] [PubMed] [Google Scholar]
- 49. Mihaylova MM , Vasquez DS , Ravnskjaer K , Denechaud PD , Yu RT , Alvarez JG , Downes M , Evans RM , Montminy M , Shaw RJ. 2011. Class IIa histone deacetylases are hormone-activated regulators of FOXO and mammalian glucose homeostasis. Cell 145:607–621 [DOI] [PMC free article] [PubMed] [Google Scholar]
- 50. Handschin C. 2011. Peroxisome proliferator-activated receptor γ coactivator 1β (PGC-1β) improves skeletal muscle mitochondrial function and insulin sensitivity. Diabetologia 54:1270–1272 [DOI] [PubMed] [Google Scholar]
- 51. Blaak EE , Van Baak MA , Kemerink GJ , Pakbiers MT , Heidendal GA , Saris WH. 1994. β-Adrenergic stimulation of energy expenditure and forearm skeletal muscle metabolism in lean and obese men. Am J Physiol 267:E306–E315 [DOI] [PubMed] [Google Scholar]
- 52. Hagström-Toft E , Enoksson S , Moberg E , Bolinder J , Arner P. 1998. β-Adrenergic regulation of lipolysis and blood flow in human skeletal muscle in vivo. Am J Physiol 275:E909–E916 [DOI] [PubMed] [Google Scholar]
- 53. Blaak EE. 2004. Basic disturbances in skeletal muscle fatty acid metabolism in obesity and type 2 diabetes mellitus. Proc Nutr Soc 63:323–330 [DOI] [PubMed] [Google Scholar]
- 54. Fagher B , Liedholm H , Monti M , Moritz U. 1986. Thermogenesis in human skeletal muscle as measured by direct microcalorimetry and muscle contractile performance during β-adrenoceptor blockade. Clin Sci 70:435–441 [DOI] [PubMed] [Google Scholar]
- 55. Lessard SJ , Rivas DA , Chen ZP , van Denderen BJ , Watt MJ , Koch LG , Britton SL , Kemp BE , Hawley JA. 2009. Impaired skeletal muscle β-adrenergic activation and lipolysis are associated with whole-body insulin resistance in rats bred for low intrinsic exercise capacity. Endocrinology 150:4883–4891 [DOI] [PMC free article] [PubMed] [Google Scholar]
- 56. Szendroedi J , Phielix E , Roden M. 13 September 2011. The role of mitochondria in insulin resistance and type 2 diabetes mellitus. Nat Rev Endocrinol 10.1038/nrendo.2011.138 [DOI] [PubMed] [Google Scholar]
- 57. Sadowski I , Ma J , Triezenberg S , Ptashne M. 1988. GAL4-VP16 is an unusually potent transcriptional activator. Nature 335:563–564 [DOI] [PubMed] [Google Scholar]
- 58. Wansa KD , Muscat GE. 2005. TRAP220 is modulated by the antineoplastic agent 6-mercaptopurine, and mediates the activation of the NR4A subgroup of nuclear receptors. J Mol Endocrinol 34:835–848 [DOI] [PubMed] [Google Scholar]
- 59. Pearen MA , Ryall JG , Lynch GS , Muscat GE. 2009. Expression profiling of skeletal muscle following acute and chronic β2-adrenergic stimulation: implications for hypertrophy, metabolism and circadian rhythm. BMC Genomics 10:448. [DOI] [PMC free article] [PubMed] [Google Scholar]
- 60. Crowther LM , Wang SC , Eriksson NA , Myers SA , Murray LA , Muscat GE. 2011. Chicken ovalbumin upstream promoter-transcription factor II regulates nuclear receptor, myogenic, and metabolic gene expression in skeletal muscle cells. Physiol Genomics 43:213–227 [DOI] [PubMed] [Google Scholar]
- 61. Myers SA , Eriksson N , Burow R , Wang SC , Muscat GE. 2009. β-Adrenergic signaling regulates NR4A nuclear receptor and metabolic gene expression in multiple tissues. Mol Cell Endocrinol 309:101–108 [DOI] [PubMed] [Google Scholar]
- 62. Bian K , Harari Y , Zhong M , Lai M , Castro G , Weisbrodt N , Murad F. 2001. Down-regulation of inducible nitric-oxide synthase (NOS-2) during parasite-induced gut inflammation: a path to identify a selective NOS-2 inhibitor. Mol Pharmacol 59:939–947 [DOI] [PubMed] [Google Scholar]
- 63. Abramoff MD , Magalhaes PJ , Ram SJ. 2004. Image Processing with ImageJ. Biophotonics Int 11:36–42 [Google Scholar]
- 64. Jackson KA , Snyder DS , Goodell MA. 2004. Skeletal muscle fiber-specific green autofluorescence: potential for stem cell engraftment artifacts. Stem Cells 22:180–187 [DOI] [PubMed] [Google Scholar]
- 65. Lucas CA , Kang LH , Hoh JF. 2000. Monospecific antibodies against the three mammalian fast limb myosin heavy chains. Biochem Biophys Res Commun 272:303–308 [DOI] [PubMed] [Google Scholar]
- 66. Parton RG. 1994. Ultrastructural localization of gangliosides; GM1 is concentrated in caveolae. J Histochem Cytochem 42:155–166 [DOI] [PubMed] [Google Scholar]
- 67. Rossini K , Rizzi C , Sandri M , Bruson A , Carraro U. 1995. High-resolution sodium dodecyl sulfate-polyacrylamide gel electrophoresis and immunochemical identification of the 2X and embryonic myosin heavy chains in complex mixtures of isomyosins. Electrophoresis 16:101–104 [DOI] [PubMed] [Google Scholar]
- 68. Merril CR , Goldman D , Sedman SA , Ebert MH. 1981. Ultrasensitive stain for proteins in polyacrylamide gels shows regional variation in cerebrospinal fluid proteins. Science 211:1437–1438 [DOI] [PubMed] [Google Scholar]
- 69. Smyth GK. 2004. Linear models and empirical bayes methods for assessing differential expression in microarray experiments. Stat Appl Genet Mol Biol 3:Article3 [DOI] [PubMed] [Google Scholar]
- 70. Goni R , Garcia P , Foissac ST. 2009. The qPCR data statistical analysis. Integromics White Paper (September 2009): 1–9 [Google Scholar]