

Abstract
The isoform A of the insulin receptor (IR) (IR-A) is a bifunctional receptor, because it binds both insulin and IGF-II. IR-A activation by IGF-II plays a role in development, but its physiological role in adults is unknown. IGF-II signaling through IR-A is deregulated in cancer and favors tumor progression. We hypothesized that IGF-II binding to the IR-A elicits a unique signaling pathway. In order to obtain an unbiased evaluation of IR-A substrates differentially involved after IGF-II and insulin stimulation, we performed quantitative proteomics of IR-A substrates recruited to tyrosine-phosphorylated protein complexes using stable isotope labeling with amino acids in cell culture in combination with antiphosphotyrosine antibody pull down and mass spectrometry. Using cells expressing only the human IR-A and lacking the IGF-I receptor, we identified 38 IR-A substrates. Only 10 were known IR mediators, whereas 28 substrates were not previously related to IR signaling. Eleven substrates were recruited by stimulation with both ligands: two equally recruited by IGF-II and insulin, three more strongly recruited by IGF-II, and six more strongly recruited by insulin. Moreover, 14 substrates were recruited solely by IGF-II and 13 solely by insulin stimulation. Interestingly, discoidin domain receptors, involved in cell migration and tumor metastasis, and ephrin receptor B4, involved in bidirectional signaling upon cell-cell contact, were predominantly activated by IGF-II. These findings indicate that IR-A activation by IGF-II elicits a unique signaling pathway that may play a distinct role in physiology and in disease.
In recent years, the functional role of the two isoforms (A and B) of the insulin receptor (IR) has attracted renewed interest due to the finding that the IR isoform A (IR-A), generated by removal of exon 11, besides binding insulin, also binds IGF-II with high affinity (1). This IR-A binding feature is not shared by the IR-B isoform that contains the 12-amino acid string encoded by exon 11. IR-A has physiological significance in prenatal life, because its activation by IGF-II plays a crucial role in embryo and fetal development (2, 3). However, the physiological role of IR-A in adult life remains unclear. In adults, IR-A expression is predominant in nonclassical insulin target tissues (spleen, brain, etc.), whereas IR-B expression is predominant in classical insulin target tissues, such as liver, fat, and muscle. The fact that IR-A is coexpressed with IR-B in these tissues, especially in muscle and fat, remains puzzling (3).
Limited evidence suggests that the two IR isoforms may activate partially different intracellular signaling and biological effects in response to insulin, at least in some cellular models (4, 5). However, we hypothesize that the biological significance of the ubiquitous IR-A expression in adult tissues is related with its high affinity for the IGF-II (3).
IGF-II signaling through the IR-A may play a role in certain diseases, such as type 2 diabetes mellitus and cancer (3, 6). IR-A is often overexpressed in a variety of human malignancies, and activation of an autocrine IR-A/IGF-II loop is associated with cancer progression and dedifferentiation (1, 7–9). Anticancer therapies targeting the IGF receptor (IGF-IR) do not block IGF-II signaling through the IR-A, although they block IGF-II binding to the IGF-IR (9, 10).
For these reasons, it is important to unravel the intracellular signaling network activated by IGF-II binding to the IR-A. In particular, we asked whether IGF-II signaling through IR-A is unique or just overlaps with insulin signaling. We have previously shown that in mouse fibroblasts expressing only IR-A and lacking IGF-IR (R−/IR-A cells), IGF-II is a more potent mitogen than insulin (1) and elicits a gene expression profile partially different from that elicited by insulin (11, 12). We have also found that, in R−/IR-A cells, IGF-II induces a different balance between the activation of the phosphatidylinositol 3-kinase (PI3K) and the ERK1/2 pathways as compared with insulin. As a consequence, IGF-II stimulates a signaling pattern characterized by increased ERK1/2:PI3K and p70S6 kinase:protein kinase B activation ratios as compared with insulin (13).
To identify new proximal effectors of the IR-A and additional differences between IGF-II and insulin in intracellular signaling, we undertook an unbiased approach aimed at identifying the components of protein complexes differentially activated by stimulation of R−/IR-A cells with either IGF-II or insulin. We used a mass spectrometry (MS)-based proteomic approach [stable isotope labeling with amino acids in cell culture (SILAC)], which allows comparison between immunoprecipitated proteins from different cell culture conditions (14, 15).
We identified a number of IR effectors previously described in other model systems and also several new effectors recruited by IR-A activation. Although the IGF-II affinity for IR-A is approximately 4-fold lower than that of insulin (1), some of these effectors were approximately equally activated by the two ligands. Most intriguingly, several other IR-A effectors were exclusively activated or more potently activated by one ligand, either IGF-II or insulin. These findings confirm that IGF-II, via the IR-A, activates a unique signaling pathway, which may play an exclusive role in physiology and disease.
Results
Quantitative SILAC analysis of intracellular mediators after stimulation of R−/IR-A cells by either IGF-II or insulin
To obtain a quantitative and unbiased analysis of the signaling networks activated by IGF-II and insulin upon IR-A binding, we used R−/IR-A cells. As previously reported, these mouse fibroblasts overexpress the human IR-A (∼5 × 10⁵ receptors per cell) and lack the IGF-IR. They also express low levels of endogenous IR-A, but no IR-B (13). Subconfluent R−/IR-A cell cultures were subdivided in three sets and grown in unlabeled or labeled medium, as indicated in Materials and Methods. After complete labeling, cells of the first set were stimulated with vehicle alone, the second set was stimulated with IGF-II (10 nm) and the third one with insulin (10 nm) for 1 min. Cells lysates from the three different cell cultures were mixed, and tyrosine-phosphorylated proteins were purified by anti-phosphotyrosine-antibody pull down, and the proteins were subsequently processed for liquid chromatography (LC)-MS/MS analysis, as described in Materials and Methods (Fig. 1). The experiment was repeated twice and analyzed as described in Materials and Methods. Representative MS spectra of IR-A substrates are shown in Supplemental Figs. 1 and 2, published on The Endocrine Society's Journals Online web site at http://mend.endojournals.org.
Fig. 1.

Schematic overview of the SILAC approach used to identify IR-A mediators after IGF-II or insulin stimulation. Cells were grown in three different arginine-stable isotope-labeled media. Cells grown in natural arginine were stimulated with vehicle alone. Cells grown in l-13C6-Arg-containing medium were treated with IGF-II, and cells grown in l-13C615N4-Arg-containing medium were treated with insulin. Stimulation was carried out with 10 nm ligand for 1 min. Equal amounts of proteins were mixed with antiphosphotyrosine antibodies (anti-pY) and the immunoprecipitated (IP) fraction was resolved by SDS-PAGE. The gel was excised into bands, and each band was digested with trypsin. Each fraction from the in-gel digestion was analyzed by nano LC-MSMS, using a QSTAR XL hybrid MS instrument or an LTQ Orbitrap XL.
By LC-MS/MS analysis, a total of 158 gene products was identified and quantified in the first experiment, whereas a total of 277 gene products was identified and quantified in the second experiment. Proteins, whose recruitment to the phosphotyrosine protein complexes occurred as a consequence of ligand stimulation, were considered effectors of IGF-II and/or insulin in R−/IR-A cells. Our approach was aimed at identifying not only proteins phosphorylated in tyrosine residues after stimulation but also proteins that closely interact with direct interactors and are involved in downstream signaling. A total of 38 proteins showed a significant difference after either IGF-II or insulin stimulation; 10/38 of them are known IR mediators (Table 1), whereas 28/38 represent newly identified effectors of IR-A signaling (Table 2).
Table 1.
IR-A substrates activated or deactivated by IGF-II (ratio M:L) or insulin (ratio H:L) identified by SILAC and previously reported as involved in insulin signaling
| Accession no. | Reference | Protein name | Experiment 1 |
Experiment 2 |
||||||
|---|---|---|---|---|---|---|---|---|---|---|
| Ratio M:L | sd | Ratio H:L | sd | Ratio M:L | Significance M:L (A) | Ratio H:L | Significance H:L (A) | |||
| IPI00128358 | 58 | IR | 6.61 | 1.84 | 27.59 | 7.8 | 5.76 | 0.000 | 24.06 | 0.000 |
| IPI00379844.4 | 59 | IRS-2 | 2.20 | 0.37 | 3.24 | 0.47 | 4.70 | 0.000 | 5.47 | 0.000 |
| IPI00119627 | 59 | IRS-1 | 4.02 | 15.74 | ||||||
| IPI00117159.1 | 60 | PI3K p85 subunit β | 1.55 | 0.06 | 1.23 | 0.07 | 1.83 | 0.000 | 1.85 | 0.001 |
| IPI00229927.2 | 31 | CIP4 | 1.28 | 0.12 | 1.48 | 0.07 | 1.46 | 0.012 | 1.77 | 0.002 |
| IPI00136110.3 | 60 | PI3K p110 subunit β | 1.39 | 0.026 | 1.07 | 0.369 | ||||
| IPI00125832.1 | 61 | Caveolin-2 | 0.96 | 0.351 | 1.53 | 0.016 | ||||
| IPI00664670.4 | 32 | Filamin C | 0.82 | 0.106 | 0.65 | 0.011 | ||||
| IPI00467223 | 27 | SPIN90 | 1.38 | 0.009 | 1.25 | 0.005 | ||||
| IPI00119060 | 30 | Flotillin 2 | 1.08 | 1.42 | ||||||
sd are reported for data obtained in the first experiment and statistical significance regarding IGF-II [M:L (A)] and insulin stimulation [H:L (A)] for data obtained in the second experiment, as detailed in Materials and Methods.
Table 2.
IR-A substrates activated or deactivated by IGF-II (ratio M:L) or insulin (ratio H:L) identified by SILAC and not previously reported as involved in insulin signaling
| Accession no. | Protein name | Experiment 1 |
Experiment 2 |
||||||
|---|---|---|---|---|---|---|---|---|---|
| Ratio M:L | sd | Ratio H:L | sd | Ratio M:L | Significance M:L (A) | Ratio H:L | Significance H:L (A) | ||
| IPI00129221.1 | DDR1 | 4.07 | 0.000 | 1.70 | 0.003 | ||||
| IPI00466187.5 | Myo10 | 1.37 | 0.30 | 1.88 | 0.73 | 2.43 | 0.000 | 1.85 | 0.001 |
| IPI00758066.2 | EphB 4 | 1.88 | 0.000 | 1.06 | 0.380 | ||||
| IPI00752490.1 | Rhamm | 1.73 | 0.000 | 1.69 | 0.004 | ||||
| IPI00122971.2 | Neural cell adhesion molecule 1 | 1.56 | 0.003 | 1.32 | 0.077 | ||||
| IPI00284816.4 | Collagen alpha-1(XVIII) chain precursor | 1.55 | 0.004 | 1.31 | 0.087 | ||||
| IPI00124761.1 | DDR2 | 1.48 | 1.43 | 1.53 | 0.005 | 1.19 | 0.182 | ||
| IPI00338854.3 | Guanine nucleotide binding protein (G protein), alpha inhibiting activity polypeptide 3 | 1.50 | 0.007 | 1.28 | 0.106 | ||||
| IPI00876558.1 | Latrophilin-2 | 1.44 | 0.015 | 1.25 | 0.131 | ||||
| IPI00319830.7 | Isoform 1 of Spectrin beta chain | 1.44 | 0.015 | 0.81 | 0.136 | ||||
| IPI00330476 | Cytoplasmic FMR 1-interacting protein 1 | 1.39 | 0.16 | 1.75 | 0.16 | 1.42 | 0.020 | 1.52 | 0.017 |
| IPI00221723.1 | WAVE2 | 1.41 | 0.11 | 1.76 | 0.56 | 1.39 | 0.027 | 2.29 | 0.000 |
| IPI00626627.4 | FYN-binding protein | 1.34 | 0.045 | 1.35 | 0.065 | ||||
| IPI00798483.1 | ABI1 | 1.63 | 2.01 | 1.20 | 0.167 | 2.00 | 0.000 | ||
| IPI00755241.1 | Nckap1 | 1.59 | 1.77 | 1.19 | 0.182 | 1.91 | 0.001 | ||
| IPI00115516.1 | Elastin microfibril interface-located protein 1 | 1.19 | 0.174 | 0.68 | 0.022 | ||||
| IPI00124959.1 | Antigen KI-67 | 1.05 | 0.450 | 0.72 | 0.044 | ||||
| IPI00280250.5 | SH3 and PX domain-containing protein 2A | 1.03 | 0.486 | 1.54 | 0.014 | ||||
| IPI00396739.1 | SWI/SNF-related matrix-associated actin-dependent regulator of chromatin A5 | 0.94 | 0.303 | 0.61 | 0.005 | ||||
| IPI00126939.1 | Protein kinase C, delta binding protein | 0.89 | 0.219 | 1.77 | 0.002 | ||||
| IPI00135443.2 | DNA topoisomerase 2-beta | 0.89 | 0.217 | 0.65 | 0.012 | ||||
| IPI00222188.4 | Collagen alpha-2(I) chain | 0.88 | 0.203 | 0.72 | 0.040 | ||||
| IPI00555055.3 | Histone H2AV | 0.72 | 0.029 | 0.73 | 0.049 | ||||
| IPI00127186.1 | Neurogenic locus notch homolog protein 1 precursor | 0.71 | 0.024 | 1.21 | 0.169 | ||||
| IPI00221494.7 | Lipoma-preferred partner | 0.69 | 0.015 | 1.01 | 0.487 | ||||
| IPI00122321 | Serine/threonine-protein kinase VRK3 | 0.70 | 0.78 | ||||||
| IPI00124281 | Myosin-Ib | 0.64 | 0.08 | 0.75 | 0.14 | ||||
| IPI00126725 | Interferon-activable protein 202 | 0.56 | 0.79 | ||||||
sd are reported for data obtained in the first experiment and statistical significance regarding IGF-II [M:L (A)] and insulin stimulation [H:L (A)] for data obtained in the second experiment, as detailed in Materials and Methods.
Quantitative analysis of known IR mediators involved in IR-A signaling after stimulation with either IGF-II or insulin
Ten proteins known to be involved in IR signaling were found positively (activated, n = 9) or negatively recruited (deactivated, n = 1) to tyrosine-phosphorylated protein complexes after stimulation with either insulin or IGF-II or both (Table 1). These findings provided a proof of concept that our SILAC approach was appropriate. As expected, the IR-A itself was the protein with the greatest level of activation as compared with unstimulated cells. The degree of activation was approximately 4-fold higher after insulin than after IGF-II, in accordance with the relative IR-A binding affinity for the two ligands (Table 1). The two immediate IR substrates (IRS), IRS-1 and IRS-2, were also found activated. However, although IRS-1 activation was approximately 4-fold greater after insulin than after IGF-II, IRS-2 activation was only slightly greater after insulin than after IGF-II. Intriguingly, the p85β regulatory subunit of PI3K, a major signaling mediator of IR, was approximately equally recruited after IGF-II and insulin stimulation, whereas the PI3K catalytic subunit p110β was significantly associated only with IGF-II stimulation (Table 1).
NCK interacting protein with SH3 domain (SPIN90) also appeared to be activated solely by IGF-II, whereas caveolin-2 and flotilin-2 appeared to be activated solely by insulin (Table 1). Filamin C was negatively associated with phosphotyrosine complexes only after insulin stimulation.
Quantitative analysis of new mediators involved in IR-A signaling upon IGF-II or insulin stimulation
Twenty-eight mediators not previously directly associated with insulin signaling were identified as positively or negatively recruited to tyrosine-phosphorylated proteins after insulin and/or IGF-II (Table 2).
The receptor for hyaluronan (HA)-mediated motility (Rhamm) was approximately equally responsive to both ligands. However, cytoplasmic FMR 1-interacting protein 1, Wiskott-Aldrich syndrome protein family member 2 (WAVE2), Abelson interactor 1 (ABI1), Nck-associated protein (Nckap)1, and F-actin capping protein α-subunit were all strongly activated after insulin and weakly activated or nonactivated after IGF-II (Table 2). All these molecules participate in actin cytoskeletal reorganization. Protein kinase C δ-binding protein, a component of caveolae, was only responsive to insulin.
In contrast, myosin X (Myo10), a protein expressed with a role in filopodia formation, as well as discoidin domain receptors (DDR), transmembrane collagen-binding receptor tyrosine kinases that are involved in the regulation of cell adhesion and migration, were activated predominantly by IGF-II.
The ephrin receptor ephrin type-B receptor 4 (EphB4), which has a crucial role in the regulation of morphogenesis, angiogenesis, and cell migration, and spectrin, a protein involved in the formation of the lateral membrane domain of epithelial cells, were both activated by IGF-II but not by insulin.
Other proteins were negatively recruited to tyrosine-phosphorylated protein complexes in response to ligand stimulation. In particular, two of them were responsive to both ligands, five solely to IGF-II, and five solely to insulin (Table 2).
The functional classification of these substrates is given in Table 3.
Table 3.
Functional classification of IR-A substrates recruited after IGF-II or insulin exposure
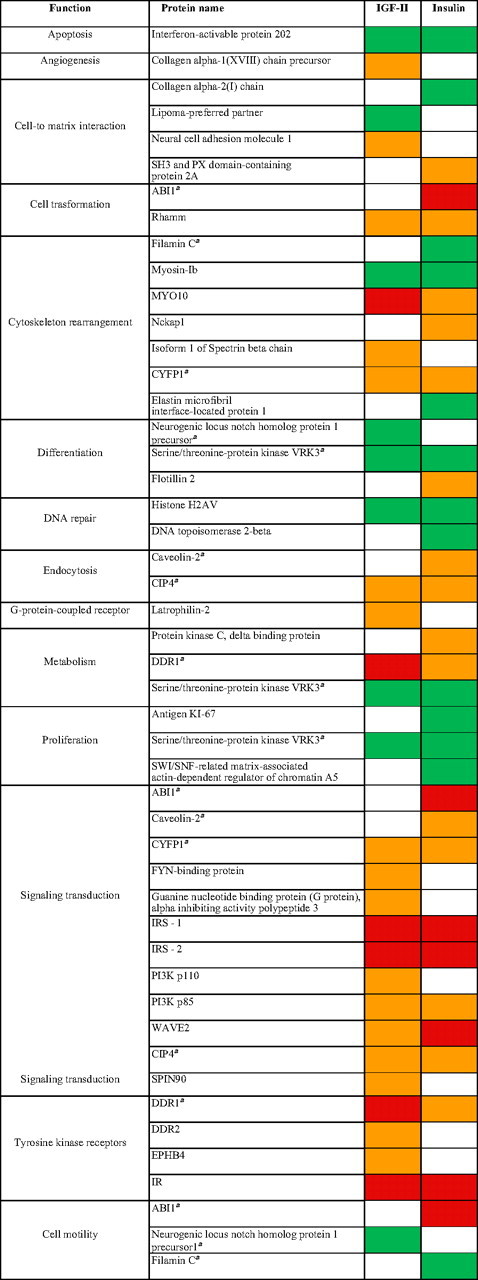
Red, activated ≥2.0; orange, activated up to 1.9; green, deactivated 0.79–0.5; white, nonregulated.
Substrates classified in more than one functional class.
Western blotting validation of a set of IR-A mediators
A subset of IR-A mediators, significantly modulated after stimulation with either IGF-II or insulin or both, were chosen for validation by Western blot analysis. This subset included three molecules previously known as insulin signaling effectors (IRS-1, IRS-2, and PI3K-p85) and six newly identified mediators (ABI1, WAVE2, DDR1, DDR2, EphB4, and Myo10). The IR-A was studied as control. R−/IR-A cells were treated with either IGF-II or insulin for 1 min and tyrosine-phosphorylated protein complexes obtained as already described for SILAC. Western blotting data were in close accordance with MS analysis (Fig. 2, A and B). Notably, IGF-II was clearly weaker than insulin in activating IR-A and recruiting IR-A, IRS-1, WAVE2, and ABI1. However, IGF-II was only marginally weaker or equally potent than insulin in recruiting IRS-2 and p85. Activation of EphB4, Myo10, DDR1, and DDR2 was significant only after IGF-II. Dose-response experiments showed maximal substrate activation at 1–10 nm for both ligands and confirmed the differences previously observed at 10 nm (Fig. 3A). Time-course experiments showed that maximal activation for IR-A, IRS proteins, p85, and WAVE2 was at 1–5 min after ligand stimulation, whereas it was at 5–30 min for DDR1, DDR2, and ABI1. The differences between the two ligands, however, were generally maintained at all time points (Fig. 3B).
Fig. 2.

Western blot analysis of selected IR-A substrates activated after IGF-II or insulin stimulation. R−/IR-A cells were stimulated with either IGF-II or insulin at a concentration of 10 nm for 1 min. Cell lysates were subjected to immunoprecipitation (IP) with antianti-PY antibodies (anti-pY) and to SDS-PAGE. Filters were then blotted with antibodies against the indicated substrates (left panel). Whole-cell lysates were also analyzed by Western blotting to provide a control for equal loading (right panel). Data represented in graphs are the average ± sem of three independent experiments. Statistical significance was determined using one-way ANOVA; *, P < 0.05; **, P < 0.001. BAS, Basal conditions.
Fig. 3.
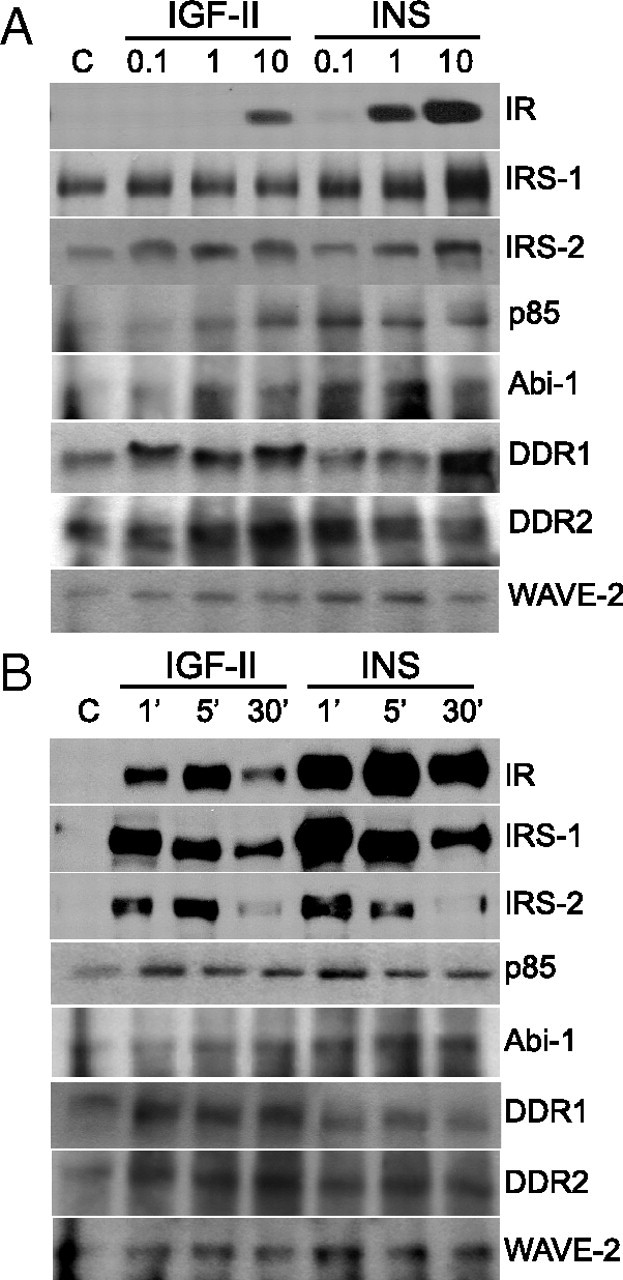
Dose response and time course of the activation of selected IR-A substrates after IGF-II or insulin stimulation. R−/IR-A cells were stimulated with either IGF-II or insulin at different concentrations for 1 min (A) or at the concentration of 10 nm for different times (B), as indicated. Cell lysates were subjected to IP with antianti-PY and subjected to Western blot analysis with antibodies against specific substrates, as described in Materials and Methods. The experiment shown is representative of three independent experiments.
For all these experiments, we have used R−/IR-A cells, because the results would not be equally clear in other cellular models coexpressing the IGF-IR, which, by binding the IGF-II, may obscure IGF-II action on the IR-A. However, one may argue whether the activation of these newly identified substrates could be reproduced in a more physiological context where endogenous IR-A and IGF-IR are coexpressed. To address this issue, we evaluated the response of a panel of substrates to insulin and IGF-II stimulation in NIH-3T3 nontransformed mouse embryo fibroblasts and in MCF-7 human breast cancer cells (Fig. 4). Both cell lines coexpress physiological levels of endogenous IR and IGF-IR (Fig. 4A). Moreover, in NIH-3T3 cells IR-A is approximately 70% of total IR, whereas in MCF-7, it is approximately 60% (data not shown). The involvement of newly identified substrates was clearly confirmed both in NIH-3T3 and MCF-7 cells, with IGF-II being mostly as effective or more effective than insulin (Fig. 4, B and C). Interestingly, in MCF-7 cells, insulin was slightly but consistently more effective than IGF-II in activating EphB4 (Fig. 4C). However, the coexistence of both IR isoforms and of IGF-IR and IR/IGF-IR hybrid receptors prevented us drawing any conclusion regarding the specific effect of IGF-II on IR-A in these cell lines.
Fig. 4.

Western blot analysis of the activation of selected IR-A substrates in NIH-3T3 and MCF-7 cells. A, Proteins levels for the IR and IGF-IR in R−/IR-A, MCF-7 and NIH-3T3 cell lines. NIH-3T3 (B) and MCF-7 (C) cells were stimulated with either IGF-II or insulin at a concentration of 10 nm for 1 min. Cell lysates were subjected to IP with antianti-pY antibodies and to SDS-PAGE. Filters were then blotted with antibodies against the indicated substrates (left panel). Whole-cell lysates were also analyzed by Western blotting to provide a control for equal loading (right panel). The experiment shown is representative of three independent experiments. IP, Immunoprecipitation.
Protein network modeling
To highlight signaling differences between IGF-II and insulin, we performed a protein interaction network modeling using Search Tool for the Retrieval of Interacting Genes/Proteins (STRING) database, a database dedicated to protein-protein interactions, including both physical and functional interactions. As shown in Fig. 5, the signaling network resulting from IGF-II stimulation is noticeably different from that resulting from insulin stimulation. It appears that differences in the degree and/or kinetics and/or compartimentalization of immediate IR-A substrates, such as IRS-1 and IRS-2, are sufficient to orchestrate a substantially different signaling network when R−/IR-A cells are stimulated with either IGF-II or insulin (Fig. 5).
Fig. 5.

Interaction maps of IR-A substrates modulated by either IGF-II or insulin. IR-A substrates found to be significantly modulated after either IGF-II or insulin stimulation were used to establish protein interaction maps using the STRING database. Nodes represent the protein substrates, and lines with different colors indicate different protein-protein interaction modes.
Discussion
In the present study, we used the SILAC methodology in combination with antiphospho-tyrosine immunoprecipitation and MS to perform an unbiased study to identify mediators differentially recruited to tyrosine-phosphorylated proteins after IR-A stimulation with either IGF-II or insulin. It is noteworthy that most previous studies on insulin signaling (16, 17), including some recent papers using various proteomic approaches (15, 18–21), have been performed in classical insulin target cells (muscle cells, adipocytes, hepatocytes) that express both IR isoforms with a predominance of the IR-B. Wild-type cells also coexpress the IGF-IR and IR/IGF-IR hybrid receptors (22, 23), which may also bind insulin, although at low affinity, and affect signaling specificity (24). No previous study has compared IGF-II and insulin signaling using an unbiased proteomic approach. The two ligands may elicit different biological effects in R−/IR-A and in other cells, with IGF-II being a more potent stimulator of mitogenesis and migration and insulin being more metabolically effective (1, 7). Interestingly, others have shown that it is possible to design peptides with high affinity for IR-A binding and eliciting high metabolic effects but reduced mitogenesis as compared with insulin (25), thus reinforcing the concept that different IR-A ligands may have divergent biological effects.
Our SILAC approach proved to be very effective, because we were able to identify 10 previously known IR mediators as well as 28 new potential IR-A mediators not previously directly associated with insulin signaling. To avoid false positives, we used very conservative thresholds for protein identification in combination with manual inspection of peptide fragmentation spectra. Overall, the number of substrates identified was comparable with that found by studies using a similar approach (19–21). Validation analysis carried out by Western blot for a panel of effectors and including dose-response and time-course experiments was in excellent agreement with our proteomics results.
Data analysis revealed several signaling differences between IGF-II and insulin after binding to the IR-A. These differences were not unique to IR−/IR-A cells but were also found in nonengineered cells, such as NIH-3T3 fibroblasts and MCF-7 breast cancer cells, where a panel of these effectors was evaluated by Western blotting. These cells, however, express endogenous IGF-IR and IR/IGF-IR hybrids, which may affect the response to IGF-II. The potential significance of some of these differences will be discussed. We will first discuss differences related to previously known mediators and then differences related to newly identified mediators.
First, we found that IR-A and its immediate intracellular substrate IRS-1 were more effectively activated by insulin as compared with IGF-II. This reflects the relative binding affinities of the two ligands to the IR-A confirming our previous findings (1). However, the activation of IRS-2 was similar after IGF-II and insulin stimulation, suggesting a preferential activation of IRS-2 by IGF-II, given the lower binding affinity of IGF-II. This finding confirms previous evidences obtained by us and others (1, 13, 26) and suggests that the preferential IRS-2 activation by IGF-II may contribute to downstream signaling differences between the two ligands.
Interestingly, SPIN90, a proto-oncogene tyrosine-protein kinase Src (Src) homology (SH)3 domain-containing protein, implicated in IR signaling was more effectively activated by IGF-II than by insulin. SPIN90 forms a complex with Wiskott-Aldrich syndrome protein and recruits other proteins to Nck1 at focal adhesions after growth factors stimulation and/or cell adhesion (27).
In contrast, other known IR-A substrates, such as caveolin-2 and flotilin-2, were significantly activated by insulin but not by IGF-II. Both caveolin-2 and flotilin-2 are scaffolding protein and components of the caveolae, which play an important role in the compartmentalization of a variety of signal transduction molecules. The IR itself is specifically recruited within caveolae (28). Caveolin-2 is phosphorylated by insulin stimulation at Tyr19, and this phosphorylation affects the binding of SH2 domain-containing proteins, including c-Src, Nck, and GTPase-activating protein (Ras), and regulates the activity of Ras/ERK and focal adhesion kinase (29). Flotilin proteins have been involved in glucose transport (30).
Among molecules more strongly activated by insulin than by IGF-II, we found cell division control protein 42 (Cdc42)-interacting protein 4 (CIP4). CIP4 interacts with neuronal Wiskott-Aldrich Syndrome protein and dynamin-2. A splice variant of mouse CIP4, CIP4/2, was previously identified as a putative TC10 protein effector. TC10 protein, a Ras homologous protein family, is activated by insulin stimulation downstream of E3 ubiquitin-protein ligase CBL phosphorylation and may constitute a second, PI3K-independent pathway, involved in insulin-stimulated glucose uptake in adipocytes and myocytes (31).
Only filamin C, among known IR mediators, appeared to be negatively associated with tyrosine phosphoproteins after stimulation, with statistical significance reached only after insulin. Filamin C is an actin-binding protein, which is serine phosphorylated by serine-threonine kinase in response to insulin stimulation (32) and plays a role in stabilizing actin filaments network. It may also act as a scaffolding protein for signaling components.
In addition to previously described IR substrates, we also identified 28 new IR-A mediators not previously directly implicated in insulin signaling. Many were differentially recruited to phosphoproteins after IGF-II and insulin stimulation. Most of these mediators are involved in important cellular functions, such as cytoskeleton remodeling, extracellular matrix interactions or intercellular interactions.
It is known that insulin induces a rapid remodeling of actin filaments into a cortical network. Actin remodeling may provide a scaffold to signaling molecules and plays a role in cell motility and in endocytotic processes and glucose transporter-4 translocation (33). We found that several components of the WAVE2 signaling complex, which plays a crucial role in actin remodeling, are activated by IGF-II and insulin. These components include WAVE2, AbI1, Nckap1, Sra-1 [Ras-related C3 botulinum toxin substrate 1 (Rac1)-associated protein-1], and protein kinase C δ-binding protein. WAVE2 is a component of the Wiskott-Aldrich syndrome protein family and, through its C-terminal domain, mediates binding of actin monomers to the actin-related protein 2 (Arp)2/3 complex and consequent induction of Arp2/3 actin nucleating activity (34). The above-mentioned SPIN90 colocalizes with actin filaments at the leading edges of cells and promotes the activity of WAVE2 complexes by interacting with Arp2/3 (35). The WAVE2-ABI1-Nckap1-Sra-1 complex exists under basal conditions and is recruited via Rac interaction to lamellipodia, resulting in site-directed nucleation of actin filaments. ABI1 plays a role in connecting WAVE2 to Rac by translocating WAVE2 to the membrane and stabilizing the multiprotein complex (36, 37). ABI1 also allows Abl-mediated WAVE2 tyrosine phosphorylation (38), which is required for linking WAVE2 to activated Rac. Because Rac activation may be induced by growth factors, the WAVE2-ABI1-Nckap1-Sra-1 complex has an important role in connecting extracellular signals to actin remodeling (34).
These components of the WAVE2 multiprotein complex showed quantitative differences in recruitment to phosphoproteins after IGF-II or insulin, suggesting a differential role of these ligands in actin remodeling.
Two other molecules involved in membrane-cytoskeleton interactions, Myo10 and spectrin, were more strongly modulated by IGF-II than by insulin. Myo10 is an unconventional myosin and plays a crucial role in the formation of filopodia, structures with an important role in the regulation of wound healing, angiogenesis, and phagocytosis (39). Filopodial growth requires actin polymerization, which is stimulated by Arp2/3 activation by the GTPase Cdc42. Myo10 is highly concentrated at the distal tips of filopodia and can promote filopodia formation by a mechanism downstream of Cdc42 (39). Moreover, Myo10 has pleckstrin homology domains and is a potential downstream target of PI3K (40). Spectrin associates with ankyrin-G and E-cadherin in formation of the lateral membrane domain of both epithelial cells and early embryos (41). Loss/derangement of this structure is a characteristic of metastatic cancer cells (42).
Extracellular matrix receptors, namely, receptors for HA and for collagen, were also recruited to tyrosine phosphoproteins complexes after ligand stimulation. The HA receptor Rhamm was identified in our analysis. Rhamm is expressed at low levels in normal tissues, whereas it is commonly overexpressed in cancer (43). Upon HA binding, Rhamm activates multiple signaling pathways involved in cell motility, including Ras, c-Src, and ERK1/2 (44). In particular, Rhamm seems to be required for ERK1/2 sustained activation (44) and cooperates with CD44 antigen in promoting motility (45). For these reasons, Rhamm has been involved in cancer invasion, metastasis, and angiogenesis (46).
The collagen-binding receptors activated by IR-A stimulation belong to transmembrane tyrosine kinases DDR. Two different genes coding for DDR exist in human, DDR1 and DDR2, which are activated by different types of collagen (47). Activation of DDR1 regulates cell adhesion, motility, and proliferation by binding a number of different SH2- and phosphotyrosine binding domain-containing molecules and activating multiple signaling pathways. DDR play a crucial role in growth and vasculature development and are involved in the regulation of cell spreading and migration. In cancer, DDR play a key role in tumor epithelial-to-mesenchymal transition, by promoting a switch from E-cadherin to N-cadherin expression, and increasing invasion and metastasis (48) by stimulation of the tyrosine kinase pyruvate kinase and transcription factor AP-1 NH2-terminal kinase and cooperation with integrin-stimulated focal adhesion kinase (47). To the best of our knowledge, HA receptors and DDR have not been previously directly implicated in insulin signaling. However, both of them may undergo phosphorylation at tyrosine residues (49, 50).
Rhamm was recruited to phosphoproteins complexes by IGF-II and insulin with approximately similar potency. In contrast, DDR were predominantly activated by IGF-II.
Another new and intriguing finding is the activation of ephrin receptor B4 by IGF-II. Ephrin receptors are receptor tyrosine kinases that bind two distinct types of membrane-anchored ephrin ligands, which themselves act as transmembrane tyrosine kinase signaling molecules and have a crucial role in vascular morphogenesis (51). Eph receptors, including EphB4, are often overexpressed in a variety of malignancies (52). No cooperation between Eph receptors and IR has been described yet. Our finding, therefore, requires more work to elucidate the mechanisms by which IR-A may functionally interact with EphB in normal and cancer tissues.
In summary, by using engineered R−/IR-A cells, we performed an unbiased quantitative analysis of intracellular mediators recruited to tyrosine-phosphorylated protein complexes upon insulin or IGF-II binding to the IR-A. Several previously known and many newly discovered IR-A mediators were identified. Data strongly support the concept that IGF-II, upon binding to IR-A, activates a unique signaling pattern that partially differs from that of insulin. Although the IGF-II binding affinity for the IR-A is lower than that of insulin, the activation of several intracellular mediators is more strongly activated by IGF-II than by insulin. The preferential activation of IRS-2 by IGF-II and of IRS-1 by insulin may play a pivotal role in this differential signaling and biological effects of the two ligands through IR-A. Several of these newly identified substrates are involved in important biological effects, and their role in IR-A signaling needs to be extensively characterized both in normal and cancer cells. The present study opens the way for a better understanding of IGF-II signaling through the IR-A in development and in cancer.
Materials and Methods
SILAC labeling and cell cultures
R− cells, 3T3-like mouse fibroblasts with a targeted disruption of the igf-ir gene (kindly provided by Renato Baserga, Philadelphia, PA), were cotransfected with the pNTK2 expression vector containing the cDNA for the human IR-A (Ex11−) and the pPDV61 plasmid encoding the puromicin resistance gene, using the Lipofectamine reagent (GIBCO/BRL, Freiburg, Germany), as previously described (1). R−/IR-A cells were cultured in DMEM (4.5 g/liter glucose)-based medium.
To generate triple encoding SILAC conditions, medium deficient in arginine (Sigma-Aldrich, St. Louis, MO) was supplemented with stable isotope arginine (Cambridge Isotope Laboratories, Andover, MA). We used L-13C615N4-arginine (Arg10) for “heavy” labeling, L-13C6-arginine (Arg6) for “medium” labeling, and L-12C614N4-arginine (Arg0) for the “light” condition. The final arginine concentration in medium was 86.1 mg/liter (15). In each SILAC condition, medium was supplemented with 10% dialyzed fetal bovine serum, with 1% streptomycine/penicillin and 1% l-glutamine (all from Invitrogen). To achieve a complete labeling, cells were grown in parallel in light (L), medium (M), and heavy (H) SILAC medium for more than five generations.
NIH-3T3 mouse fibroblasts and MCF-7 breast cancer cell lines were from American Type Culture Collection (Manassas, VA).
Cell stimulation, harvest, and protein enrichment
To obtain 25 mg of starting material, 10 15-cm cell culture dishes with 90% confluent cells per condition were prepared for each triple SILAC experiment. R−/IR-A cells were serum starved for 12 h. H (Arg10) R−/IR-A cells were stimulated with 10 nm insulin; M (Arg6) R−/IR-A cells were stimulated with 10 nm IGF-II, and L (Arg0)-labeled R−/IRA cells were left untreated. Time of stimulation was 1 min. Cells were lysed in modified RIPA buffer (pH 7.4) and harvested. Cell lysates were centrifuged at 16,000 × g and 4 C for 15 min. Supernatant was collected and protein content measured by the Bradford assay. Equal amounts of proteins from the three samples were then mixed, resulting in 75-mg proteins in total.
Tyrosine-phosphorylated proteins were enriched using two different anti-pTyr monoclonal antibodies coupled to agarose beads, 4G10 (Upstate Biotechnology, Waltham, MA) at a dose of 300 μg and RC20 (Biomol, Plymouth Meeting, PA) at a dose of 130 μg. After an overnight incubation at 4 C, the precipitated immune complexes were washed three times with lysis buffer and incubated with 100 mm phenyl phosphate in PBS for 15 min. To remove phenyl phosphate, the eluate was dialyzed overnight at 4 C. The dialyzed eluate was concentrated in a vacuum centrifuge to 100–150 μl, boiled in sample buffer, and resolved by 15× 15-cm SDS-PAGE.
In-gel digestion
The gel was stained with 0.l% silver nitrate for 30 min at 4 C, the gel lanes were then excised and cut horizontally into 18 sections. Excised sections were resuspended in acetonitrile (ACN) and destained by using 50% ACN and 50% 50 mm ammonium bicarbonate solution. Proteins were reduced by adding 10 mm dithiothreitol in 100 mm ammonium bicarbonate solution for 30 min, followed by alkylation of cysteines by incubation with 55 mm iodoacetamide for 20 min. Digestion was started by adding 12.5 ng/μl MS grade trypsin solution. After 2 h, samples were diluted with 50 mm ammonium bicarbonate and 10% c and trypsin was added overnight. Peptides were extracted with 5% formic acid and 50% ACN, dried by vacuum centrifugation, and resuspended in loading pump solvent for LC-MS/MS analysis.
Nanoscale LC-MS/MS analysis
For the first experiment, a quadrupole-time-of-flight mass spectrometer was available for analysis. The second experiment was performed using a mass spectrometer providing higher performance (Orbitrap), in collaboration with M.R.L. of the proteomics group at University of Southern Denmark.
First experiment
Chromatography was performed on an Ultimate nano LC system from Dionex (Sunnyvale, CA), using a vented column-like setup (53, 54). The in-gel digests were reconstituted in 40 μl of loading pump solvent (see below), centrifuged at 13,000 × g for 10 min. The supernatant (10 μl) was loaded onto an in-house packed 100 μm inner diameter (i.d.), Integra Frit (New Objective, Cambridge, MA) trapping column packed with C18 silica particles, 5-μm particle size, from Maisch (Ammerbuch-Entringen, Germany). Trapping column packing bed length was 1.5 cm; loading flow rate was 10 μl/min of loading pump solvent, consisting of H2O, ACN, and trifluoroacetic acid (TFA) 97.95:2:0.05 (vol/vol/vol). After 4 min of column washing, the trapping column was switched on-line to the analytical column, an in-house packed 50 μm i.d., Pico Frit column (New Objective), 10 cm in length, filled with 3-μm C18 silica particles from Maisch. Peptide separation started at 100 nl/min using a binary gradient. Mobile phase A was H2O, ACN, formic acid, and TFA 97.9:2:0.09:0.01 (vol/vol/vol/vol); mobile phase B was H2O, ACN, formic acid, and TFA 29.9:70:0.09:0.01 (vol/vol/vol/vol). Gradient was from 5–40% B in 80 min. After 10 min at 95% B, the column was reequilibrated at 5% B for 15 min before the next injection.
MS detection was performed on a QSTAR XL hybrid LC-MS/MS from Applied Biosystems, Inc. (Foster City, CA) operating in positive ion mode, with nESI potential at 1300 V, curtain gas at 15 units, CAD gas at 3 units. Information-dependent acquisition was performed by selecting the two most abundant peaks for MS/MS analysis after a full time-of-flight-MS scan from 400 to 1400 m/z lasting 1 sec. Both MS/MS analyses were performed in enhanced mode (1.5 sec/scan). Threshold value for peak selection for MS/MS was 20 counts. Nano LC-MS/MS data files were internally recalibrated after acquisition by using background ions due to polymethylsiloxane traces, detected in the full scan MS spectrum at medium intensity in absence of eluting peptides. Calibration m/z values were: 445.1200, 519.1388, 593.1576, 667.1764, 741.1952, and 815.2140.
Data analysis
MS/MS spectra were converted in Mascot generic format by the Analyst software (version 1.1; Applied Biosystems, Inc.). A script running on Analyst was used to determine peptide charge state and to perform centroiding and deisotoping on MS/MS data. MS/MS data were searched on the Mascot search engine (www.matrixscience.com), version 2.2, against the International Protein Index database (mouse version 3.58; 56,619 sequences) using the following parameters. MS tolerance, 20 ppm; MS/MS tolerance, 0.1 Da; fixed modifications, carbamidomethyl; variable modifications, oxidation, phospho-Y; enzyme, trypsin; maximum missed cleavages, 1; and quantitation, SILAC R6 + R10.
Using a Mascot score threshold of 30, peptide false discovery rate was estimated to be 5.5% using the decoy search option on the Mascot search engine, which allows to perform an automated second search on a randomized database after having performed the first search on the forward database. Identifications with two peptides above Mascot score 30 were considered valid. Only 13 protein identifications among the 158 reported in the final list were based on a single peptide above the significance threshold. They were all subjected to validation by manual inspection of MS/MS data. Proteins identified by a single peptide are listed in Supplemental Table 1; their MS/MS spectra are reported in Supplemental Fig. 3. In case multiple proteins matched the same set of peptides, only one member of the protein group was reported in Tables 1–3.
Quantitative analysis was performed by MSQuant software version (II). Bold red peptides above Mascot score 30 were used for quantitation. Data were normalized on the median of the Log2 of M:L and H:L ratios, respectively. Whenever a protein was quantified by using two or more peptides, the median of M:L and H:L ratios was adopted. Proteins quantified by a single arginine-containing peptide were visually inspected. Significance thresholds for quantitative changes were chosen according to the values calculated by MaxQuant software for experiment 2 (see below). For Arg6 values (IGF-II stimulation), proteins were considered significantly underrepresented when their M:L ratio was below 0.74, whereas they were considered overrepresented when their M:L ratio was above 1.33. For Arg10 values (insulin stimulation), proteins were considered significantly underrepresented when their H:L ratio was below 0.73, whereas they were considered overrepresented when their H:L ratio was above 1.38. The complete list of identified and quantified proteins in experiment 1 is available as Supplemental Table 2.
Second experiment
Chromatography was performed on an Easy nano LC system from Proxeon (Odense, Denmark). In-gel digested peptides were purified by stage tips (55). The eluate was lyophilized, reconstituted in 0.3 μl of 100% formic acid, and diluted with 5 μl of mobile phase A (see below). The peptides were loaded onto a 20 cm long, 100 μm i.d., 360 μm outer diameter, ReproSil-Pur C18 AQ 3-μm (Maisch) reversed phase capillary column. The peptides were eluted using a gradient from 100% phase A (0.1% formic acid) to 40% phase B (0.1% formic acid and 80% MeCN) over 30 min at 200 nl/min directly into a LTQ-Orbitrap XL mass spectrometer (Thermo Scientific, San Jose CA). The LTQ-Orbitrap XL was operated in a data-independent mode automatically switching between MS and MSMS of the five most intense ions from the MS scan. The signal intensity threshold for selection for MSMS was sat to 30,000 NL, the activation time was 30 msec, and previous selected peptides were excluded for 20 sec.
Data analysis
Raw datafiles from the Orbitrap analysis were analyzed using MaxQuant software (56), version 1.0.13.8. Data were searched on the Mascot search engine (www.matrixscience.com), against the International Protein Index database (mouse version 3.52; 55,303 sequences) using the following parameters. Initial MS tolerance, 10 ppm; MS/MS tolerance, 0.6 Da; fixed modifications, carbamidomethyl; variable modifications, oxidation, acetyl (protein N terminus), Gln->pyro-Glu (N-terminal Q), and phospho-STY; enzyme, trypsin; maximum missed cleavages, 1; and quantitation, SILAC R6 + R10. False-discovery rate was set at 1%. Significance thresholds for quantitative changes were automatically calculated by the software (56). For Arg6 values (IGF-II stimulation), proteins were considered significantly underrepresented when their M:L ratio was below 0.74, whereas they were considered overrepresented when their M:L ratio was above 1.33. For Arg10 values (insulin stimulation), proteins were considered significantly underrepresented when their H:L ratio was below 0.73, whereas they were considered overrepresented when their H:L ratio was above 1.38. The complete list of identified and quantified proteins in experiment 2, together with the full set of corresponding peptides, is available as Supplemental Tables 3 and 4, respectively.
Western blot analysis
Subconfluent cell cultures were incubated in the presence or the absence of either insulin or IGF-II for 1 min.
R−/IR cells, in time-course experiments, were incubated whit insulin or IGF-II (10 nm) for 1, 5, 30 min, whereas dose-response experiments were carried out at 0.1, 1.0, and 10 nm for 1 min.
Cell lysates were then incubated with anti-p-Tyr monoclonal antibodies coupled with G-sepharose beads, as described above, to immunopurify protein complexes containing phosphorylated tyrosine residues, which were then subjected to SDS-PAGE. The resolved proteins were transferred to nitrocellulose membranes and subjected to immunoblotting analysis. Immunoblots were revealed by the enhanced chemiluminescence method (Amersham, Little Chalfont, UK), autoradiographed, and subjected to densitometric analysis. The following antibodies were used: anti-IRβ, anti-IGF-IRβ, anti-β-actin, anti-WAVE2, anti-ABI1, anti-EphB4, anti-DDR1, anti-DDR2, anti-Myo10 (Santa Cruz Biotechnology, Inc., Santa Cruz, CA), anti-PI3K (p85), anti-IRS-1, and anti-IRS-2 (Upstate Biotechnology).
Reverse transcription-polymerase chain reaction
RT-PCR for mouse IR isoforms was carried out with oligonucleotide primers spanning nucleotides 2147–2171 (5′-ATC AGA GTG AGT ATG ACG ACT CGG-3′) and 2349–2373 (5′-TCC TGA CTT GTG GGC ACA ATG GTA-3′) of the mouse IR. PCR amplification was carried out for 30 cycles of 30 sec at 94 C, 30 sec at 60 C, and 45 sec at 72 C in a DNA thermal cycler 9700 (Applied Biosystems, Inc.). After electrophoresis of the PCR products, the 286- and 250-bp DNA fragments represented Ex11+ and Ex11−, respectively. RT-PCR for human IR isoforms was carried out as previously described (1).
Densitometric analysis
Densitometric analysis was performed using ImageJ. Values are expressed as arbitrary units.
Statistical analysis
Experiments were repeated at least three times. Results are expressed as mean ± sem. All statistical analyses were carried out with GraphPad software (Prism, London, UK). Results were compared using the one-way ANOVA test. Differences were considered statistically significant at P < 0.05.
Protein network modeling
Network analysis of protein interaction was carried out using the database and web-tool STRING (http://string.embl.de). STRING is a metaresource that aggregates most of the available information on protein-protein associations, scores, and weights it (57). It includes not only functional associations but also physical interactions and information from genes that share similarities in their phylogenetic profiles or display a similar transcriptional response. Information from text mining and interaction transfer between organisms are also integrated probabilistically. Two separate analyses were carried out for either IGF-II or insulin, including all identified mediators that resulted significantly up- or down-modulated by the specific ligand.
Acknowledgments
This work was supported by grants from the Associazione Italiana per la Ricerca sul Cancro (A.B. and R.V.) and by Programmi di ricerca di Rilevante Interesse Nazionale -Ministero dell'Istruzione, dell'Università e della Ricerca, Grant 2008BKRFBH_005 (to A.B.).
Disclosure Summary: The authors have nothing to disclose.
Footnotes
- ABI1
- Abelson interactor 1
- ACN
- acetonitrile
- Arp
- actin-related protein 2
- Cdc42
- cell division control protein 42
- CIP4
- Cdc42-interacting protein 4
- DDR
- discoidin domain receptor
- EphB4
- ephrin type-B receptor 4
- H
- heavy
- HA
- hyaluronan
- i.d.
- inner diameter
- IGF-IR
- IGF receptor
- IR
- insulin receptor
- IR-A
- IR isoform A
- IRS
- IR substrate
- L
- light
- LC
- liquid chromatography
- M
- medium
- MS
- mass spectrometry
- Myo10
- myosin X
- Nckap
- Nck-associated protein
- PI3K
- phosphatidylinositol 3-kinase
- Rac
- Ras-related C3 botulinum toxin substrate 1
- Ras
- GTPase-activating protein Ras
- Rhamm
- receptor for HA-mediated motility
- Sra
- Rac1-associated protein-1
- SH
- Src homology
- SILAC
- stable isotope labeling with amino acids in cell culture
- SPIN90
- NCK interacting protein with SH3 domain
- Src
- proto-oncogene tyrosine-protein kinase Src
- STRING
- Search Tool for the Retrieval of Interacting Genes/Proteins
- TFA
- trifluoroacetic acid
- WAVE2
- Wiskott-Aldrich syndrome protein family member 2.
References
- 1. Frasca F , Pandini G , Scalia P , Sciacca L , Mineo R , Costantino A , Goldfine ID , Belfiore A , Vigneri R. 1999. Insulin receptor isoform A, a newly recognized, high-affinity insulin-like growth factor II receptor in fetal and cancer cells. Mol Cell Biol 19:3278–3288 [DOI] [PMC free article] [PubMed] [Google Scholar]
- 2. Louvi A , Accili D , Efstratiadis A. 1997. Growth-promoting interaction of IGF-II with the insulin receptor during mouse embryonic development. Dev Biol 189:33–48 [DOI] [PubMed] [Google Scholar]
- 3. Belfiore A , Frasca F , Pandini G , Sciacca L , Vigneri R. 2009. Insulin receptor isoforms and insulin receptor/insulin-like growth factor receptor hybrids in physiology and disease. Endocr Rev 30:586–623 [DOI] [PubMed] [Google Scholar]
- 4. Leibiger B , Leibiger IB , Moede T , Kemper S , Kulkarni RN , Kahn CR , de Vargas LM , Berggren PO. 2001. Selective insulin signaling through A and B insulin receptors regulates transcription of insulin and glucokinase genes in pancreatic β cells. Mol Cell 7:559–570 [DOI] [PubMed] [Google Scholar]
- 5. Uhles S , Moede T , Leibiger B , Berggren PO , Leibiger IB. 2003. Isoform-specific insulin receptor signaling involves different plasma membrane domains. J Cell Biol 163:1327–1337 [DOI] [PMC free article] [PubMed] [Google Scholar]
- 6. Liquori CL , Ricker K , Moseley ML , Jacobsen JF , Kress W , Naylor SL , Day JW , Ranum LP. 2001. Myotonic dystrophy type 2 caused by a CCTG expansion in intron 1 of ZNF9. Science 293:864–867 [DOI] [PubMed] [Google Scholar]
- 7. Sciacca L , Mineo R , Pandini G , Murabito A , Vigneri R , Belfiore A. 2002. In IGF-I receptor-deficient leiomyosarcoma cells autocrine IGF-II induces cell invasion and protection from apoptosis via the insulin receptor isoform A. Oncogene 21:8240–8250 [DOI] [PubMed] [Google Scholar]
- 8. Vella V , Pandini G , Sciacca L , Mineo R , Vigneri R , Pezzino V , Belfiore A. 2002. A novel autocrine loop involving IGF-II and the insulin receptor isoform-A stimulates growth of thyroid cancer. J Clin Endocrinol Metab 87:245–254 [DOI] [PubMed] [Google Scholar]
- 9. Belfiore A. 2007. The role of insulin receptor isoforms and hybrid insulin/IGF-I receptors in human cancer. Curr Pharm Des 13:671–686 [DOI] [PubMed] [Google Scholar]
- 10. Hofmann F , García-Echeverría C. 2005. Blocking the insulin-like growth factor-I receptor as a strategy for targeting cancer. Drug Discov Today 10:1041–1047 [DOI] [PubMed] [Google Scholar]
- 11. Pandini G , Medico E , Conte E , Sciacca L , Vigneri R , Belfiore A. 2003. Differential gene expression induced by insulin and insulin-like growth factor-II through the insulin receptor isoform A. J Biol Chem 278:42178–42189 [DOI] [PubMed] [Google Scholar]
- 12. Pandini G , Conte E , Medico E , Sciacca L , Vigneri R , Belfiore A. 2004. IGF-II binding to insulin receptor isoform A induces a partially different gene expression profile from insulin binding. Ann NY Acad Sci 1028:450–456 [DOI] [PubMed] [Google Scholar]
- 13. Sacco A , Morcavallo A , Pandini G , Vigneri R , Belfiore A. 2009. Differential signaling activation by insulin and insulin-like growth factors I and II upon binding to insulin receptor isoform A. Endocrinology 150:3594–3602 [DOI] [PubMed] [Google Scholar]
- 14. Ong SE , Blagoev B , Kratchmarova I , Kristensen DB , Steen H , Pandey A , Mann M. 2002. Stable isotope labeling by amino acids in cell culture, SILAC, as a simple and accurate approach to expression proteomics. Mol Cell Proteomics 1:376–386 [DOI] [PubMed] [Google Scholar]
- 15. Blagoev B , Mann M. 2006. Quantitative proteomics to study mitogen-activated protein kinases. Methods 40:243–250 [DOI] [PubMed] [Google Scholar]
- 16. Cohen P. 2006. The twentieth century struggle to decipher insulin signalling. Nat Rev Mol Cell Biol 7:867–873 [DOI] [PubMed] [Google Scholar]
- 17. Taniguchi CM , Emanuelli B , Kahn CR. 2006. Critical nodes in signalling pathways: insights into insulin action. Nat Rev Mol Cell Biol 7:85–96 [DOI] [PubMed] [Google Scholar]
- 18. Ibarrola N , Molina H , Iwahori A , Pandey A. 2004. A novel proteomic approach for specific identification of tyrosine kinase substrates using [13C]tyrosine. J Biol Chem 279:15805–15813 [DOI] [PubMed] [Google Scholar]
- 19. Schmelzle K , Kane S , Gridley S , Lienhard GE , White FM. 2006. Temporal dynamics of tyrosine phosphorylation in insulin signaling. Diabetes 55:2171–2179 [DOI] [PubMed] [Google Scholar]
- 20. Wang Y , Li R , Du D , Zhang C , Yuan H , Zeng R , Chen Z. 2006. Proteomic analysis reveals novel molecules involved in insulin signaling pathway. J Proteome Res 5:846–855 [DOI] [PubMed] [Google Scholar]
- 21. Saeki K , Yasugi E , Okuma E , Breit SN , Nakamura M , Toda T , Kaburagi Y , Yuo A. 2005. Proteomic analysis on insulin signaling in human hematopoietic cells: identification of CLIC1 and SRp20 as novel downstream effectors of insulin. Am J Physiol Endocrinol Metab 289:E419–E428 [DOI] [PubMed] [Google Scholar]
- 22. Soos MA , Whittaker J , Lammers R , Ullrich A , Siddle K. 1990. Receptors for insulin and insulin-like growth factor-I can form hybrid dimers. Characterisation of hybrid receptors in transfected cells. Biochem J 270:383–390 [DOI] [PMC free article] [PubMed] [Google Scholar]
- 23. Bailyes EM , Nave BT , Soos MA , Orr SR , Hayward AC , Siddle K. 1997. Insulin receptor/IGF-I receptor hybrids are widely distributed in mammalian tissues: quantification of individual receptor species by selective immunoprecipitation and immunoblotting. Biochem J 327(Pt 1):209–215 [DOI] [PMC free article] [PubMed] [Google Scholar]
- 24. Pandini G , Frasca F , Mineo R , Sciacca L , Vigneri R , Belfiore A. 2002. Insulin/insulin-like growth factor I hybrid receptors have different biological characteristics depending on the insulin receptor isoform involved. J Biol Chem 277:39684–39695 [DOI] [PubMed] [Google Scholar]
- 25. Jensen M , Hansen B , De Meyts P , Schäffer L , Ursø B. 2007. Activation of the insulin receptor by insulin and a synthetic peptide leads to divergent metabolic and mitogenic signaling and responses. J Biol Chem 282:35179–35186 [DOI] [PubMed] [Google Scholar]
- 26. Denley A , Carroll JM , Brierley GV , Cosgrove L , Wallace J , Forbes B , Roberts CT. 2007. Differential activation of insulin receptor substrates 1 and 2 by insulin-like growth factor-activated insulin receptors. Mol Cell Biol 27:3569–3577 [DOI] [PMC free article] [PubMed] [Google Scholar]
- 27. Lim CS , Kim SH , Jung JG , Kim JK , Song WK. 2003. Regulation of SPIN90 phosphorylation and interaction with Nck by ERK and cell adhesion. J Biol Chem 278:52116–52123 [DOI] [PubMed] [Google Scholar]
- 28. Foti M , Porcheron G , Fournier M , Maeder C , Carpentier JL. 2007. The neck of caveolae is a distinct plasma membrane subdomain that concentrates insulin receptors in 3T3-L1 adipocytes. Proc Natl Acad Sci USA 104:1242–1247 [DOI] [PMC free article] [PubMed] [Google Scholar]
- 29. Lee H , Park DS , Wang XB , Scherer PE , Schwartz PE , Lisanti MP. 2002. Src-induced phosphorylation of caveolin-2 on tyrosine 19. Phospho-caveolin-2 (Tyr(P)19) is localized near focal adhesions, remains associated with lipid rafts/caveolae, but no longer forms a high molecular mass hetero-oligomer with caveolin-1. J Biol Chem 277:34556–34567 [DOI] [PubMed] [Google Scholar]
- 30. Baumann CA , Ribon V , Kanzaki M , Thurmond DC , Mora S , Shigematsu S , Bickel PE , Pessin JE , Saltiel AR. 2000. CAP defines a second signalling pathway required for insulin-stimulated glucose transport. Nature 407:202–207 [DOI] [PubMed] [Google Scholar]
- 31. Chang L , Adams RD , Saltiel AR. 2002. The TC10-interacting protein CIP4/2 is required for insulin-stimulated Glut4 translocation in 3T3L1 adipocytes. Proc Natl Acad Sci USA 99:12835–12840 [DOI] [PMC free article] [PubMed] [Google Scholar]
- 32. Murray JT , Campbell DG , Peggie M , Mora A , Cohen P. 2004. Identification of filamin C as a new physiological substrate of PKBα using KESTREL. Biochem J 384:489–494 [DOI] [PMC free article] [PubMed] [Google Scholar]
- 33. Kanzaki M. 2006. Insulin receptor signals regulating GLUT4 translocation and actin dynamics. Endocr J 53:267–293 [DOI] [PubMed] [Google Scholar]
- 34. Steffen A , Rottner K , Ehinger J , Innocenti M , Scita G , Wehland J , Stradal TE. 2004. Sra-1 and Nap1 link Rac to actin assembly driving lamellipodia formation. EMBO J 23:749–759 [DOI] [PMC free article] [PubMed] [Google Scholar]
- 35. Kim DJ , Kim SH , Lim CS , Choi KY , Park CS , Sung BH , Yeo MG , Chang S , Kim JK , Song WK. 2006. Interaction of SPIN90 with the Arp2/3 complex mediates lamellipodia and actin comet tail formation. J Biol Chem 281:617–625 [DOI] [PubMed] [Google Scholar]
- 36. Leng Y , Zhang J , Badour K , Arpaia E , Freeman S , Cheung P , Siu M , Siminovitch K. 2005. Abelson-interactor-1 promotes WAVE2 membrane translocation and Abelson-mediated tyrosine phosphorylation required for WAVE2 activation. Proc Natl Acad Sci USA 102:1098–1103 [DOI] [PMC free article] [PubMed] [Google Scholar]
- 37. Innocenti M , Zucconi A , Disanza A , Frittoli E , Areces LB , Steffen A , Stradal TE , Di Fiore PP , Carlier MF , Scita G. 2004. Abi1 is essential for the formation and activation of a WAVE2 signalling complex. Nat Cell Biol 6:319–327 [DOI] [PubMed] [Google Scholar]
- 38. Stuart JR , Gonzalez FH , Kawai H , Yuan ZM. 2006. c-Abl interacts with the WAVE2 signaling complex to induce membrane ruffling and cell spreading. J Biol Chem 281:31290–31297 [DOI] [PubMed] [Google Scholar]
- 39. Bohil AB , Robertson BW , Cheney RE. 2006. Myosin-X is a molecular motor that functions in filopodia formation. Proc Natl Acad Sci USA 103:12411–12416 [DOI] [PMC free article] [PubMed] [Google Scholar]
- 40. Cox D , Berg JS , Cammer M , Chinegwundoh JO , Dale BM , Cheney RE , Greenberg S. 2002. Myosin X is a downstream effector of PI(3)K during phagocytosis. Nat Cell Biol 4:469–477 [DOI] [PubMed] [Google Scholar]
- 41. Kizhatil K , Davis JQ , Davis L , Hoffman J , Hogan BL , Bennett V. 2007. Ankyrin-G is a molecular partner of E-cadherin in epithelial cells and early embryos. J Biol Chem 282:26552–26561 [DOI] [PubMed] [Google Scholar]
- 42. Huber MA , Kraut N , Beug H. 2005. Molecular requirements for epithelial-mesenchymal transition during tumor progression. Curr Opin Cell Biol 17:548–558 [DOI] [PubMed] [Google Scholar]
- 43. Shigeishi H , Fujimoto S , Hiraoka M , Ono S , Taki M , Ohta K , Higashikawa K , Kamata N. 2009. Overexpression of the receptor for hyaluronan-mediated motility, correlates with expression of microtubule-associated protein in human oral squamous cell carcinomas. Int J Oncol 34:1565–1571 [DOI] [PubMed] [Google Scholar]
- 44. Hamilton SR , Fard SF , Paiwand FF , Tolg C , Veiseh M , Wang C , McCarthy JB , Bissell MJ , Koropatnick J , Turley EA. 2007. The hyaluronan receptors CD44 and Rhamm (CD168) form complexes with ERK1,2 that sustain high basal motility in breast cancer cells. J Biol Chem 282:16667–16680 [DOI] [PMC free article] [PubMed] [Google Scholar]
- 45. Maxwell CA , McCarthy J , Turley E. 2008. Cell-surface and mitotic-spindle RHAMM: moonlighting or dual oncogenic functions? J Cell Sci 121:925–932 [DOI] [PubMed] [Google Scholar]
- 46. Toole BP , Slomiany MG. 2008. Hyaluronan: a constitutive regulator of chemoresistance and malignancy in cancer cells. Semin Cancer Biol 18:244–250 [DOI] [PMC free article] [PubMed] [Google Scholar]
- 47. Vogel WF , Abdulhussein R , Ford CE. 2006. Sensing extracellular matrix: an update on discoidin domain receptor function. Cell Signal 18:1108–1116 [DOI] [PubMed] [Google Scholar]
- 48. Shintani Y , Fukumoto Y , Chaika N , Svoboda R , Wheelock MJ , Johnson KR. 2008. Collagen I-mediated up-regulation of N-cadherin requires cooperative signals from integrins and discoidin domain receptor 1. J Cell Biol 180:1277–1289 [DOI] [PMC free article] [PubMed] [Google Scholar]
- 49. Mertins P , Eberl HC , Renkawitz J , Olsen JV , Tremblay ML , Mann M , Ullrich A , Daub H. 2008. Investigation of protein-tyrosine phosphatase 1B function by quantitative proteomics. Mol Cell Proteomics 7:1763–1777 [DOI] [PMC free article] [PubMed] [Google Scholar]
- 50. Luo W , Slebos RJ , Hill S , Li M , Brábek J , Amanchy R , Chaerkady R , Pandey A , Ham AJ , Hanks SK. 2008. Global impact of oncogenic Src on a phosphotyrosine proteome. J Proteome Res 7:3447–3460 [DOI] [PMC free article] [PubMed] [Google Scholar]
- 51. Frisén J , Holmberg J , Barbacid M. 1999. Ephrins and their Eph receptors: multitalented directors of embryonic development. EMBO J 18:5159–5165 [DOI] [PMC free article] [PubMed] [Google Scholar]
- 52. Vaught D , Brantley-Sieders DM , Chen J. 2008. Eph receptors in breast cancer: roles in tumor promotion and tumor suppression. Breast Cancer Res 10:217. [DOI] [PMC free article] [PubMed] [Google Scholar]
- 53. Licklider LJ , Thoreen CC , Peng J , Gygi SP. 2002. Automation of nanoscale microcapillary liquid chromatography-tandem mass spectrometry with a vented column. Anal Chem 74:3076–3083 [DOI] [PubMed] [Google Scholar]
- 54. Gaspari M , Abbonante V , Cuda G. 2007. Gel-free sample preparation for the nanoscale LC-MS/MS analysis and identification of low-nanogram protein samples. J Sep Sci 30:2210–2216 [DOI] [PubMed] [Google Scholar]
- 55. Rappsilber J , Ishihama Y , Mann M. 2003. Stop and go extraction tips for matrix-assisted laser desorption/ionization, nanoelectrospray, and LC/MS sample pretreatment in proteomics. Anal Chem 75:663–670 [DOI] [PubMed] [Google Scholar]
- 56. Cox J , Mann M. 2008. MaxQuant enables high peptide identification rates, individualized p.p.b.-range mass accuracies and proteome-wide protein quantification. Nat Biotechnol 26:1367–1372 [DOI] [PubMed] [Google Scholar]
- 57. Jensen LJ , Kuhn M , Stark M , Chaffron S , Creevey C , Muller J , Doerks T , Julien P , Roth A , Simonovic M , Bork P , von Mering C. 2009. STRING 8—a global view on proteins and their functional interactions in 630 organisms. Nucleic Acids Res 37:D412–D416 [DOI] [PMC free article] [PubMed] [Google Scholar]
- 58. Ullrich A , Bell JR , Chen EY , Herrera R , Petruzzelli LM , Dull TJ , Gray A , Coussens L , Liao YC , Tsubokawa M , et al. 1985. Human insulin receptor and its relationship to the tyrosine kinase family of oncogenes. Nature 313:756–761 [DOI] [PubMed] [Google Scholar]
- 59. White MF. 1994. The IRS-1 signaling system. Curr Opin Genet Dev 4:47–54 [DOI] [PubMed] [Google Scholar]
- 60. Backer JM , Myers MG , Shoelson SE , Chin DJ , Sun XJ , Miralpeix M , Hu P , Margolis B , Skolnik EY , Schlessinger J. 1992. Phosphatidylinositol 3′-kinase is activated by association with IRS-1 during insulin stimulation. EMBO J 11:3469–3479 [DOI] [PMC free article] [PubMed] [Google Scholar]
- 61. Kwon H , Jeong K , Pak Y. 2009. Identification of pY19-caveolin-2 as a positive regulator of insulin-stimulated actin cytoskeleton-dependent mitogenesis. J Cell Mol Med 13:1549–1564 [DOI] [PMC free article] [PubMed] [Google Scholar]