

Abstract
Alternative splicing serves to increase biological diversity and adaptation. Many genes, including the glucocorticoid receptor (GR), contain multiple 5′-untranslated exons in their promoter regions that can give rise to various mRNA isoforms encoding the same protein. To date, information on the mouse GR promoter remains sparse. Here, we extensively characterize alternative first exons of the mouse GR to reveal homology to the rat and human. We further find that, although most promoters are broadly expressed in various tissues, transcription of individual promoters can be differentially regulated by growth factor- and depolarization-induced signaling. Moreover, in addition to selective promoter usage, the alternative first exon transcripts differentially control RNA stability and translation efficiency, indicative of their role in GR expression. In conclusion, the composite GR promoter enables multilayered adjustments in gene expression through transcriptional and posttranscriptional mechanisms that may serve varying physiological demands.
The transcription of multiple 5′-untranslated exons that give rise to alternate RNA isoforms is frequently observed in different classes of genes (1). For example, steroid hormone receptor genes, including both isoforms of the estrogen receptor (ER) [ERα and ERβ (2–4)], mineralocorticoid (5, 6), and glucocorticoid (GR) (7–9) receptors, encode composite untranslated first exons that are transcribed into mRNAs with alternative leader exons. The composite first exon structure of the GR exhibits similarity among humans, rats, and mice. At least 15 splice variants, derived from nine alternative first exons have been identified in the human gene, whereas 11 and five first exons have been found in the rat (7, 9–11) and mouse (8, 12), respectively. All these first exons are typically spliced to a common acceptor splice site of exon 2. Because exon 2 encodes an in-frame stop codon upstream of the translation start codon ATG, the first exons do not contribute to GR protein sequence. However, untranslated first exons are thought to fulfill regulatory roles in gene expression, e.g. by controlling translation efficiency and mRNA stability. These depend not only on the primary sequence of the 5′-untranslated region (5′-UTR), but also on the secondary structure of the RNA, which determines recognition and interaction with various factors controlling translation and stability (13, 14).
Insight into the regulation and function of the composite GR promoter and associated alternate RNA isoforms is limited (15, 16). In view of the high sequence homology between the human, rat, and mouse 5′-UTR, we systematically analyzed the mouse GR promoter for the existence of additional untranslated first exons. In addition, the response of the composite exon 1 promoter to growth factor- and depolarization-induced signaling was examined, and experiments were conducted to explore whether the alternate GR transcripts might fulfill a further role in posttranscriptional regulation of gene expression.
Results
Identification of GR first exon transcripts
Ten alternative untranslated first exons were identified in the mouse GR gene using 5′-rapid amplification of cDNA ends (5′-RACE). Based on their 5′-ends, the isolated clones were assigned to 10 groups that harbored sequences corresponding to five previously identified first exons (Supplemental Fig. 1 published on The Endocrine Society's Journals Online web site at http://mend.endojournals.org) and an additional five novel first exons; three of the latter showed high sequence homology with known rat exons previously designated as exons 1.4, 1.7, and 1.9 (Fig. 1). Two of the alternative first exons (1.3 and 1.12) detected in the mouse are apparently not conserved in the rat and human. Whereas earlier nomenclature for the mouse GR-exon 1 was alphabetical, we use numerical descriptors for the different exons, based on their distance from the translation start site; this terminology matches that used for the rat exon 1. Transcription-start sites of the alternative first exons were deduced from sequences of the 5′-RACE clones with the longest 5′-end extension. These clones contained variant first exon sequences spliced to a common exon 2 sequence acceptor site immediately upstream of the translation initiation codon in exon 2 (Table 1). Existence of the various first exons detected was verified by PCR in which forward primers at the 5′-ends of each exon were used with a common reverse primer that was specific to exon 2. The size of the resulting PCR products (data not shown) matched predictions based on spliced RNA, confirming the 5′-RACE data. Amplification of exon 1.4 and 1.12 yielded PCR products that suggested further 5′-UTR splicing variants; their existence, and use of alternative 3′-end boundaries, was demonstrated by subsequent sequencing (Table 1, Fig. 1, and Supplemental Fig. 2).
Fig. 1.

Scheme of human, rat, and mouse GR first exons. All identified mouse exon 1s were numbered according to the rat homologs and aligned to those of the rat and human. Homologous first exons are arranged one below the other. Sizes of exon 1s are shown to scale, but those of intronic regions are not due to variation in species-specific intron sizes. Vertical lines within exons represent splicing junctions. Exons are classified as distal and proximal first exons. Distal exonic regions are localized around −32 kb (mouse) and around −34 kb (human and rat). Sequences for proximal exons are ranged from approximately −4.5 to −1.1 kb (mouse), −4.5 to −1.8 kb (human), and −4.2 to −1.7 kb (rat). The adenine of the ATG start codon within exon 2 is considered as +1. a, Refs. 7, 10, and 11; b, Ref. 9; *, size of exon not published.
Table 1.
Synopsis of GR 5′-RACE data
| Exon 1s | Hip (98) | N6 (95) | N1E-115 (11) | Size (bp) | 3′-End boundary | 3′/5′-Splice position relative to ATG | Method |
|---|---|---|---|---|---|---|---|
| 1.1 | 17 | 578 | TGGGAGGAAGgt | −31930/−13 | 5′RACE | ||
| 1.3 | 2 | 115 | TCTCCAAGAGgt | −4418/−13 | 5′RACE | ||
| 1.4a | 134 | GCGGCGCGAGgt | −4205/−13 | RT-PCR | |||
| 1.4b | 3 | 3 | 1 | 486 | GGAAGGAGAGgt | −3853/−13 | 5′-RACE |
| 1.4c | 3 | 3 | 2 | 500 | GGAGTTTGGGgt | −3839/−13 | 5′-RACE |
| 1.5 | 13 | 22 | 4 | 178 | TCCTCCGAATgt | −3636/−13 | 5′-RACE |
| 1.6 | 9 | 7 | 98 | CGGGCTCACAgt | −3335/−13 | 5′-RACE | |
| 1.7 | 6 | 2 | 97 | CCCAGGCCAGgt | −2986/−13 | 5′-RACE | |
| 1.9 | 2 | 27 | 1 | 151 | CGGATTCTAAgt | −2512/−13 | 5′-RACE |
| 1.10 | 45 | 28 | 1 | 220 | CGGTGCTGAGgt | −2207/−13 | 5′-RACE |
| 1.11 | 2 | 319 | AACTCAACAGgt | −1707/−13 | 5′-RACE | ||
| 1.12a | 256 | CCTGGGCATGgt | −1441/−13 | RT-PCR | |||
| 1.12b | 404 | ATTCATTAAGgt | −1293/−13 | RT-PCR | |||
| 1.12c | 493 | GAAGCCTATGgc | −1203/−13 | RT-PCR | |||
| 1.12d | 1 | 565 | TAGTGTCTTGgt | −1134/−13 | 5′-RACE |
At least 10 alternatively spliced first exons of GR were detected in cDNA of hippocampus (Hip), N6, and N1E-115 cells. Further splicing variants of exon 1.4 and 1.12 were identified by cloning and sequencing of RT-PCR products. Numbers refer to the quantity of identified 5′-UTR variants with the total numbers of sequences obtained from each tissue shown in parenthesis. The size of each exon is indicated in base pairs (bp). Sequences in uppercase represent 3′-end of each first exon; sequences in lowercase and italics denote splicing sites within the intron. Positions of 3′- and 5′-splice sites of first exons and exon 2 are based on the genomic sequence of the mouse Nr3c1gene (MGI: 95824) and relative to the adenine of the start codon that starts at +1. Exon 2 starts at −13.
Quantification and tissue distribution of GR first exon transcripts
Quantitative PCR (qPCR) was used to investigate whether the GR transcript variants displayed tissue-specific patterns of expression; specifically, expression of each of the first exon transcripts was assayed in various central nervous system and peripheral tissues. We also determined the transcription of first exons in four clonal cell lines (corticotroph-derived AtT-20, hypothalamic N6, neuroblastoma N1E-115, and hippocampal progenitor HW3.5 cells) to avoid possible confounds arising from the fact that tissues are compromised of multiple cell types.
To determine absolute expression levels of exon 1 transcripts in the same tissue and cell line, calibration curves that are based on amplification of serial diluted recombinant DNA standards of known concentrations were used. The DNA standards contained partial sequences of corresponding transcripts. Because exon 1.4 and 1.12 yield several splicing variants, we selected the longest variant 1.4c for quantification by qPCR, the amplification of which produces one PCR product. Exon variants 1.12b-d were found to be specifically expressed in N6 cells (Table 1 and data not shown) and therefore excluded from our analysis. Whereas each forward primer was specific to an alternative exon 1, a common reverse primer against exon 2 was used. Total GR mRNA was quantified using primers targeting protein coding exons 2 and 3.
We identified exon 1.6 and 1.11 transcripts as generally the most abundant (∼10–50%) species in all tested tissues and cell lines, although exons 1.1 or 1.12a are also major transcripts (∼10–88%) in some tissues. Expression of some first exons varies strongly among tissues and cell lines, whereas others show less variation. For example, exon 1.1 transcript is only well expressed in pituitary, neuronal tissues, thymus, and spleen; exon 1.12a only shows high abundance in hippocampus, liver, and N1E-115 cells; transcripts 1.4c, 1.5, and 1.10 show moderate expression (∼5%), and exons 1.7, 1.9, and 1.3 are the least expressed (∼1% or less). Aside from the most distal and proximal exon 1s, we found similar exon 1 expression patterns in neuronal tissues that express all investigated alternative transcripts. Some peripheral tissues show greater variance but conform to the above-mentioned major, moderate, and minor transcript patterns. This is also true for analyzed cell lines, although they also express the moderately abundant exon 1.4c and 1.5 as well as 1.9 transcripts at slightly higher levels than tissues (Fig. 2).
Fig. 2.
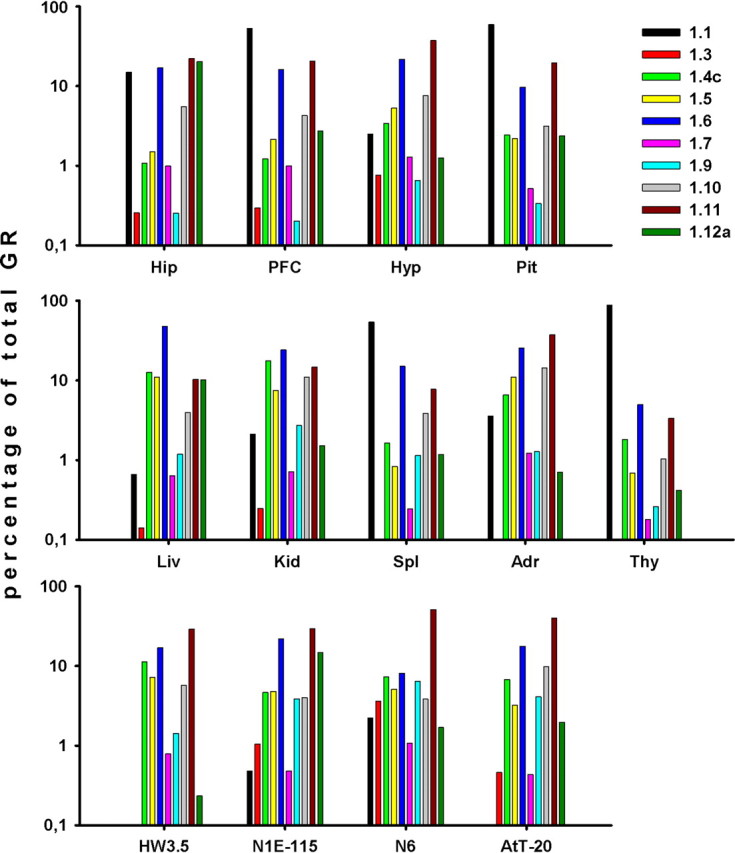
Expression and tissue distribution of GR first exon variants. Contribution of individual first exons in hippocampus (Hip), prefrontal cortex (PFC), hypothalamus (Hyp), pituitary (Pit), liver (Liv), kidney (Kid), spleen (Spl), adrenals (Adr), thymus (Thy), and cell lines (HW3.5, N1E-115, N6, AtT-20) to total GR mRNA. Copy numbers of each exon 1 were evaluated according to calibration curves and shown relative to the total copy number of total GR mRNA. Copy numbers were evaluated for each transcript from two independent qPCR runs using independent preparations of DNA standards.
Taken together, some GR alternative first exon transcript variants are preferentially expressed in certain tissues, although strict tissue-specific expression patterns are not evident. At the same time, the overall profile of coexpressed GR first exon transcript variants is characteristic of each tissue and cell line tested.
Regulation of GR transcript expression
Multiple first exon transcripts of the GR originate from specific promoters that could serve to selectively couple to different signaling pathways (7–9, 17). Because several first exon transcripts are broadly expressed under basal conditions, it was considered important to test their functional significance by examining the regulated expression of specific GR-exon 1 transcripts derived from proximal promoters by growth factors and membrane depolarization.
Basic fibroblast growth factor (bFGF) is found in the pituitary where it stimulates corticotroph proliferation, an effect that is counteracted by glucocorticoids (18). As shown in Fig. 3A, treatment of AtT-20 cells with bFGF strongly induced the expression of exon 1.5 and, to a lesser extent, those of exons 1.3, 1.4c, 1.6, 1.7, and 1.11; in contrast, expression of exons 1.9, 1.10, and 1.12a were not altered by the mitogen.
Fig. 3.

Cellular signaling regulates GR first exon transcripts. A, Treatment of AtT-20 cells with the growth factor bFGF for 24 h increases the transcription of some exon 1 transcripts, whereas others are repressed or unchanged. Expression of exon 1 transcripts was normalized to the internal standard Uros and Atp5j. Exon 1 transcripts of bFGF-treated cells are expressed as relative to expression of exon 1 transcripts in untreated cells. B, K+-induced depolarization of N6 cells for 30 min and 2 h differentially regulates exon 1 transcripts. Expression of exon 1 transcripts was normalized to the internal standard G6pdx. Exon 1 transcripts of KCl-treated cells are expressed as a function of expression of exon 1 transcripts in untreated cells. Data represent two independent experiments performed in triplicate (A) or duplicate (B). Error bars represent standard deviations from the mean (sem). Panel A, *, P < 0.04; **, P < 0.003. Panel B, *, P < 0.025; §, P <0.001.
Neuronal signals are propagated through the depolarization of cell membranes, and depolarizing stimuli can persistently alter gene expression patterns (19). Here, K+-induced depolarization of hypothalamic N6 cells for 30 min led to a minor up-regulation of exon 1.4c and 1.11 expression and a down-regulation of exon 1.9, without influencing the expression of exons 1.3, 1.5, 1.6, 1.7, 1.10, and 1.12a. Extended depolarization (2 h) further decreased exon 1.9 expression, down-regulated exon 1.6, and led to a substantial up-regulation of exon 1.1 (Fig. 3B) which, due to its relative low abundance in relation to other untranslated first exons, did not have an impact on total GR mRNA expression.
Secondary structure of GR first exons
Because all alternative first exon-containing GR transcript variants encode the same protein, we were prompted to investigate whether their 5′-UTR regulate translation of RNA. The length of the 5′-UTR, its thermal stability, GC content, secondary structure and location of stem-loops, presence of upstream open reading frames (uORF), and upstream AUG (uAUG) are all important factors (13, 14, 20–22). To this end, we applied an in silico tool (23, 24) to predict GR first exon secondary structures and the free energy released upon their folding. The principle of this approach is based on thermodynamic methods and the fact that single-stranded RNA folds in an exergonic process to release free energy; generally, the lower the free energy per nucleotide of a folded RNA, the more stable the mRNA structure. Our analysis predicted exon 1.10, 1.6, 1.11, and 1.4c RNAs to generate the most stable structures with similar free energies, whereas the RNA of exons 1.5, 1.3, and 1.12a appeared to form energetically less-stable structures. The predicted secondary structures and free energies of exon 1s are given in Fig. 4 and Supplemental Table 2. Long RNAs tend to form highly structured formations (21), as exemplified by exon 1.4c. However, untranslated first exons of comparable length can also adopt structures of differing stabilities. For instance, when comparing the similarly sized 5′-UTR containing exon 1.9 (164 nucleotides) and exon 1.5 (191 nucleotides), exon 1.9 is predicted to form an imperfect hairpin with a high degree of base pairing whereas the structure of exon 1.5 is predicted to contain a large loop of unpaired nucleotides resulting in much higher free energy (Fig. 4 and Supplemental Table 2).
Fig. 4.
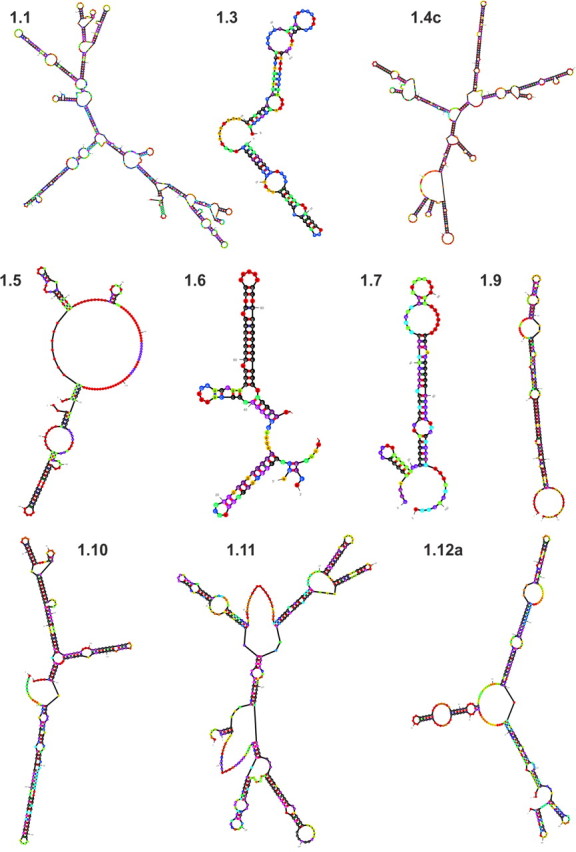
Secondary structures of GR first exon mRNA variants. Folding and hybridization of untranslated exon 1s were predicted by the program Mfold (23, 24). Shown are anticipated structures with lowest free energy (dG). The probabilities of base pairing are annotated by a color code ranging from black (highest probability) to purple, blue, green, yellow, and red (lowest probability).
RNA stability of GR first exons in vivo
Posttranscriptional regulation can occur by modulation of mRNA turnover or by repression of translational processes. The question of whether the alternative GR first exons influence mRNA stability was addressed by measuring the half-lives of a number of isoforms that are expressed in AtT-20 and N6 cells. These studies yielded half-lives ranging from 2.9–5.0 h and 4.4–6.0 h in AtT-20 and N6 cells, respectively (Fig. 5). The exon 1.4c transcript displayed the longest half-life in both cell types, whereas faster decay times were observed for exons 1.6, 1.7, 1.9, and 1.11 transcripts. Interestingly, the decay rates of exon 1.3, 1.5, 1.10, and 1.12a transcripts differed between the two cell lines, suggesting that the 5′-UTR of GR mRNAs can potentially determine mRNA stability in a cell context-dependent manner, supportive of a role of tissue-specific factors.
Fig. 5.
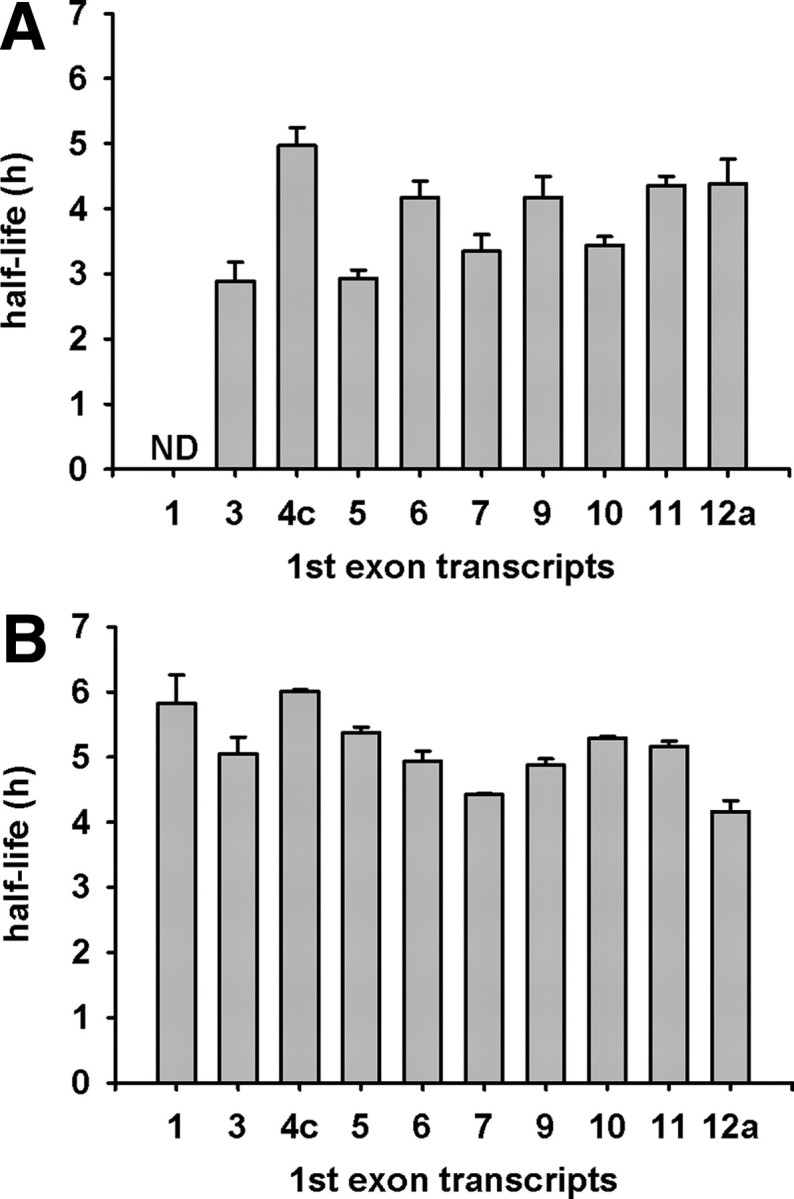
GR first exon mRNA half-lives in AtT-20 (A) and N6 (B) cells. Cells were treated with 5 μg/ml actinomycin D at 2-h intervals for up to 10 h. Half-lives were calculated using the equation (ln 0.5)/kd = t0,5 (48), where Kd = decay constant, derived from the slope of the semilogarithmic plot of relative first exon mRNA quantity vs. time. Results show a representative experiment in triplicate. Error bars are sem; ND, not detectable.
Translational efficiencies of GR first exons in vitro and in vivo
The above results and the presence of uAUG in some first untranslated exons (Supplemental Table 2) suggest that the various mRNA isoforms may differentially regulate GR synthesis. We therefore analyzed whether the different alternative first exons influence translational efficiency in vitro; for this, reporter constructs containing each of the various GR 5′-UTR fused upstream of the luciferase translation start codon were used. Results demonstrated that the exon 1.5-luciferase transcript is translated slightly more efficiently than that of the control luciferase transcript, 3-fold more than exon 1.3 transcript, and at least 5-fold more efficiently than the other first exons tested; the exon 1.4c transcript displayed the lowest translational efficiency, and exon 1.12a transcript was not at all translated (Fig. 6A). All results were highly reproducible with different RNA preparations. We next investigated whether the translational efficiencies of the GR first exon sequences measured in vitro correlated with results from AtT-20 cells that were transiently transfected with either the control vector (pGl3-Control-T7) or one of the luciferase constructs containing sequences of first exons. Translation efficiency indices for each GR first exon-luciferase transcript were inferred from relative luciferase activities and expression levels of the respective mRNA. Exon 1.5 was translated similarly in AtT-20 cells whereas exon 1.4c sequence exerted an inhibitory effect on translation. Exons 1.3, 1.6, 1.7, 1.9, 1.10, and 1.11 were translated more efficiently in cells, with exon 1.9 exhibiting the highest translational efficiency index, but exon 1.12a was again not translated (Fig. 6B).
Fig. 6.
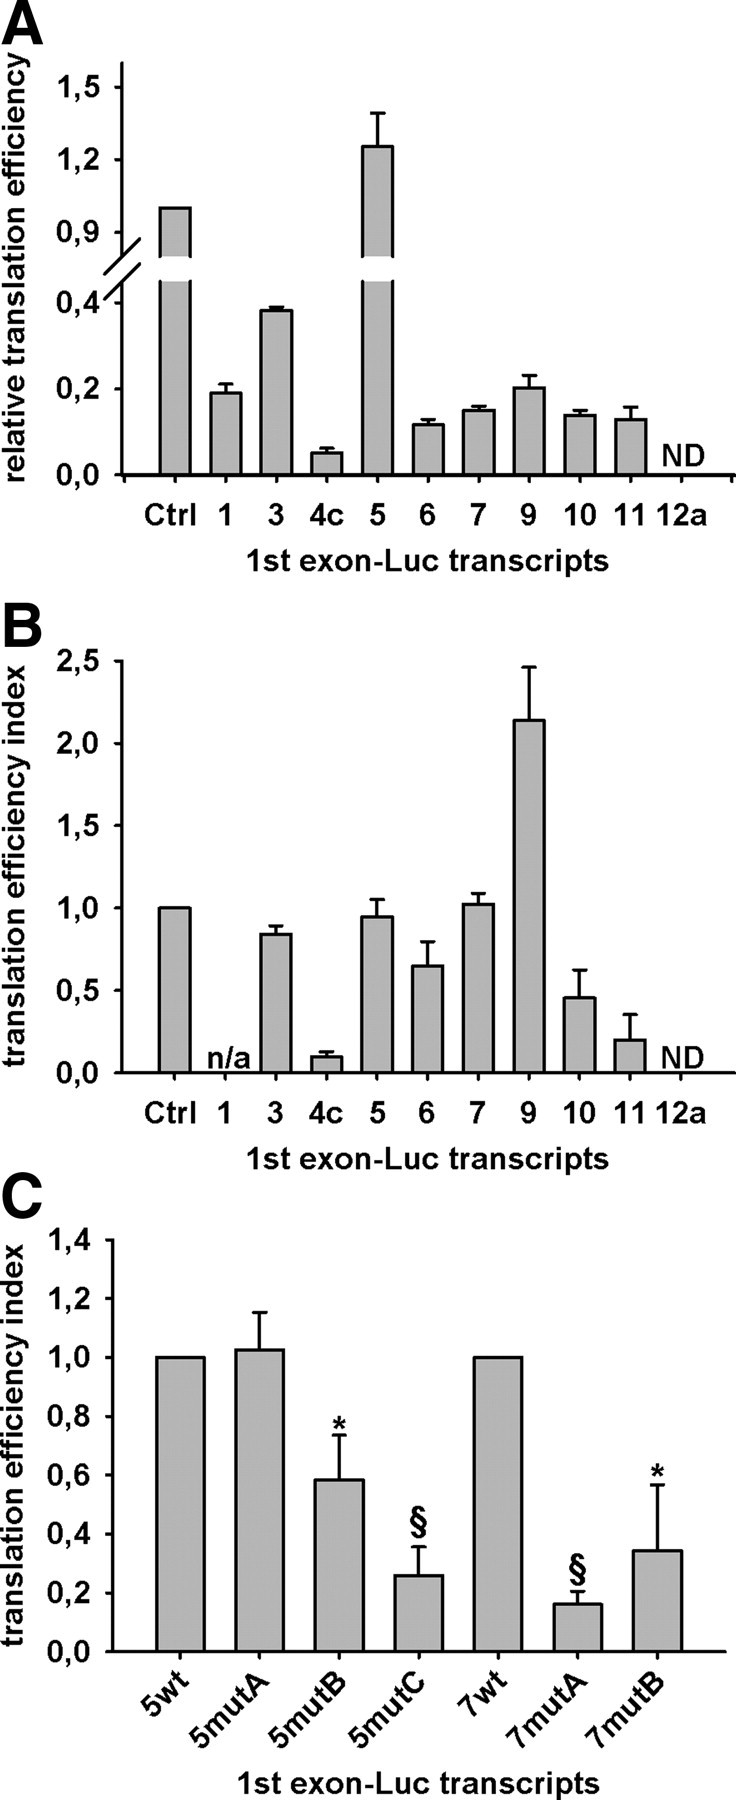
GR first exon-dependent translational efficiency. Results from in vitro translation (panel A) and transfection of AtT-20 cells (panel B) with exon 1-luciferase constructs. Luciferase activity of exonic constructs were normalized to respective mRNA levels and expressed relative to control vector. Panel C, Effect of predicted deleterious mutations on GR first exon-dependent translational efficiency. Luciferase activity of exonic constructs transfected into AtT-20 cells was normalized to respective mRNA levels and expressed relative to corresponding wild-type exon 1. Data represent three independent experiments. Error bars represent sem; *, P < 0.05; §, P <0.001; n/a, not applicable; ND, not detectable; wt, wild type; mut, mutant; Ctrl, control.
To confirm the above results demonstrating the importance of sequence-dependent secondary structure of the alternative untranslated first exons, we next tested whether point mutations, predicted to disrupt secondary structure, would impact translational efficiency. To this end we used programs for RNA mutational analyses that are structure based and rely on secondary structure prediction to determine the most deleterious mutations in exons 1.5 and 1.7, as examples. For exon 1.5 we tested the effect of increasing the number of deleterious point mutations from 1 to 3, and for exon 1.7 we used two separate programs to predict the three most crucial nucleotides (Supplemental Fig. 3). Although none of the mutations had any effect on transcription (data not shown), the effect on translation was highly significant: increasing the number of point mutations in exon 1.5 led to greater disruptions on translational efficiency, and each of two separate mutations in exon 1.7 led to heavily reduced translation (Fig. 6C). These results are consistent with the hypothesis that the structure of alternative 5′-UTR plays an important role in allowing access to either ribosomes or other components of the translational machinery (25).
Although fusion of untranslated first exons to reporter genes is a commonly used tool to measure their impact on translation efficiency (26–28), such constructs create an artificial hybrid mRNA. To overcome this limitation, we performed a recently developed assay, TrIP (translationally active RNA immunoprecipitation), which allows detecting selectively active translated endogenous mRNA (29). Translationally active mRNA is associated with polyribosomes, and nascent polypeptides are coupled with chaperones of the heat shock cognate 70 protein family (30). By targeting HSC70, translationally active mRNA is cocaptured (29) (Fig. 7A). Puromycin terminates translation and consequently disrupts the ribosomal complex formation (31). Therefore, puromycin-treated AtT-20 cells serve as a negative control in the TrIP assay.
Fig. 7.
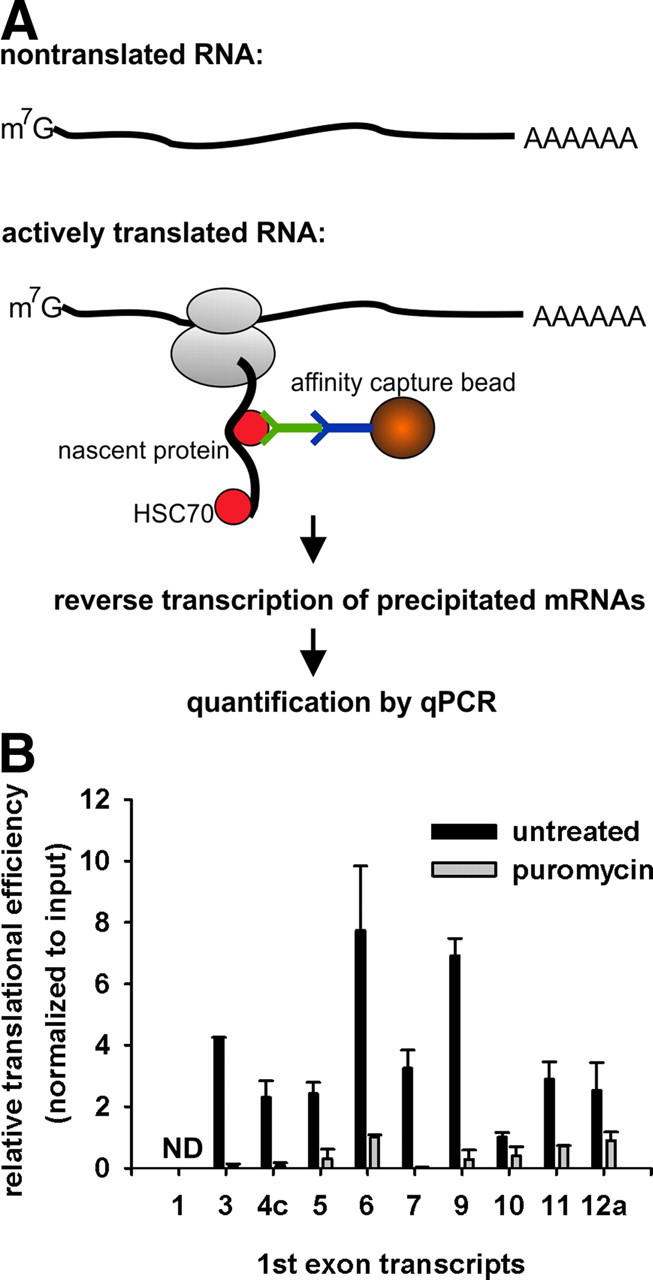
Translational efficiency of endogenous GR-transcripts. A, Schematic diagram of TrIP assay. Magnetic affinity capture beads covalently bound to a secondary antibody (blue) bind HSC70 antibody (green) and immunoprecipitate actively translated mRNA to form a cross-linked complex consisting of polyribosomes, nascent peptides, and HSC70 (red circles). Nontranslated mRNAs are separated from actively translated mRNAs that are purified after TrIP, reverse transcribed, and quantified by qPCR. B, TrIP was performed in duplicate in two independent experiments in AtT-20 cells. The amount of extracted and reverse translated bead-captured exon 1 transcripts was normalized to its corresponding input and expressed as fold change, relative to translational efficiency of the exon 1.10 transcript. ND, Not detectable.
The pattern of translation efficiencies of exon 1.3, 1.5, 1.7, 1.9, and 1.10 GR transcripts strongly resemble their related exon 1-luciferase transcripts in AtT-20 cells. Because AtT-20 cells lack exon 1.1 GR-transcript, this transcript was not detectable by TrIP. The poorly translated exon 1 transcripts 1.4c and 1.12a exhibited moderate translation efficiency, comparable to that of the 1.5 and 1.7 transcripts. Exon 1.6 and 1.11 transcripts are translationally more active than seen in the luciferase assay. When cells were treated with puromycin, the amount of captured GR transcripts was strongly reduced, confirming that HSC70-antibody-associated beads bind actively translated GR-exon 1 transcripts (Fig. 7B).
Discussion
Although incompletely characterized, the composite structure of the mouse GR promoter is closely related to that of rat and human (Fig. 1); it comprises multiple first exons that confer gene regulation through transcriptional and posttranscriptional mechanisms. The present comprehensive analysis of the 5′-UTR of the mouse GR revealed 10 untranslated first exons in addition to six splice variants derived from exons 1.4 and 1.12; these potentially add diversity to the number of transcript isoforms. Nine of the exon 1s were found to be located in close proximity to the translation start site (−4.5 kb to −1.1 kb), whereas one exon (1.1) mapped approximately 32 kb upstream. Previous work based on RNA protection assays in a S-49 mouse T-lymphoma cell line identified one single clone containing the sequence of exon 1C and 1E including the intronic sequence (12) (Supplemental Fig. 1). Neither our 5′-RACE and RT-PCR analysis in tissues and cell lines nor mouse expressed sequence tag (EST) libraries revealed such an exon 1 variant (Table 1 and Supplemental Table 1); it is likely that this variant is unique to S-49 cells. Based on sequence homology, all identified exon 1s, apart from exons 1.3 and 1.12, were found to have counterparts in the human and rat GR promoters (Fig. 1); exons 1.3 and 1.12 appear to be either specific to the mouse promoter or remain to be identified in other species. Because several EST clones reportedly contain both exons 1.9 and 1.10, including the intronic sequence (Supplemental Table 1), it appears that exons 1.9 and 1.10 are either splice variants of one first exon or that splicing of exon 1.9 does not occur in the tissues from which the EST libraries were generated. In the present work, we failed to identify 5′-RACE or PCR products that reflected transcription of exon 1.9 and 1.10 in a single transcript. Additional 5′-RACE analysis of liver RNA did not reveal any further first exon transcripts (data not shown). However, we cannot exclude the presence of further exon 1s or splice variants in other tissues.
GR expression is thought to result from ubiquitously expressed transcripts under the modulatory influence of tissue or cell-specific transcripts and splice variants (7, 9, 11). In this study we found expression of most of the proximal first exons in a diverse set of cells and tissues. However, we also observed between-species differences in individual first exon transcript expression. For example, whereas exon 1.7 and exon 1-F transcripts are expressed broadly in mouse (Fig. 2) and human (7, 11, 32) tissues, respectively, exon 1.7 expression in the rat is reportedly confined to the hippocampus (9). Alternatively, differences in the sensitivity of the detection methods (ribonuclease-protection assays vs. PCR) or the screened tissues could explain these apparently discrepant reports. For example, Turner and Muller (7) reported that exon 1-D is exclusively expressed in hippocampus whereas Presul et al. (11) detected exon 1-D expression in thymus, testis, cerebellum, and various cell lines. Expression of the distal exon 1 was previously reported only in mouse T-lymphocytes (8) and human and rat hematopoietic cell lines and thymocytes (9, 10). The present work shows that the distal mouse exon 1.1 is also well expressed in the mouse pituitary, hippocampus, prefrontal cortex, spleen, and thymus (Fig. 2 and Table 1), findings that are supported by the results of a search for EST transcripts derived from this distal exon (Supplemental Table 1). Other than the strong expression of exon 1.1 in few tissues and the strong expression of exon 1.12a in hippocampus, quantification of exon 1 transcripts revealed that exon 1.6 and 1.11 are the most abundantly expressed exons. In contrast, the mouse exon 1.7 transcript is expressed in only about 1% of total GR mRNA (Fig. 2), similar to that seen in human tissues (32).
The existence of alternative promoters, each with different levels of expression, suggests potential plasticity in GR regulation, in addition to that provided by transcript diversity (1). Given the relatively wide expression of most exon 1 transcripts, we hypothesized that the multiple transcripts might be differentially responsive to cellular signals. This hypothesis was supported insofar as bFGF treatment of AtT-20 corticotrophic cells led to a strong up-regulation of exon 1.5 transcripts and, to a lesser extent, that of exon 1.3, 1.4c, 1.6, and 1.7 (no effects on exon 1.9, 1.10, and 1.12a expression); in contrast, exon 1.4c and 1.11 transcripts were up-regulated and exon 1.9 expression was down-regulated (no effects on exon 1.3, 1.5, 1.6, 1.7, 1.10, and 1.12a) when N6 were depolarized with K+ for 30 min (Fig. 3). Despite strong up-regulation of some first exon transcripts, e.g. 1.4c, 1.5, 1.6, and 1.7 in AtT-20 cells, the mRNA of total GR was only weakly up-regulated, possibly reflecting the regulation of transcripts (1.6, 1.10, and 1.11) known to make major contributions to total GR mRNA levels (Fig. 3A and Fig. 2). Although extended depolarization (up to 2 h) strongly up-regulated exon 1.1, no changes in total GR expression were detected (Fig. 3B). We detected low level (∼2%) expression of the exon 1.1 transcript in N6 cells (Fig. 2), explaining its insignificant effect on total GR mRNA levels. On the other hand, the increase seen in the amount of total GR transcript after 30-min depolarization probably results from up-regulation of the most abundant exon 1.11 transcript. Nevertheless, the regulation and biological revelance of minor transcripts that might have subtle effects on total GR transcripts still needs clarification.
It is speculated that alternative promoters driving expression of the untranslated first exons may allow differential coupling to cellular signals to fine tune the regulation of GR expression (17). Untranslated first exons may then add a further level of fine tuning of GR expression through posttranscriptional mechanisms (Supplemental Fig. 4). Growing evidence supports the view that 5′-UTR can modulate RNA stability (33–36), translation efficiency (26, 28), and subcellular localization (37–39). Posttranscriptional regulation of protein synthesis can be controlled by sequence elements in 5′-UTR regulating RNA stability and translational efficiency. We here demonstrated that point mutations to alter in silico-predicted secondary structures dramatically reduced translation (Fig. 6C and Supplemental Fig. 3). These findings are consistent with observations that nucleotide polymorphisms in 5′-UTR can associate with various diseases (40).
uORF are sequence elements of 5′-UTR that are often reported to mediate translational inhibition and to trigger mRNA decay (41). However, our analysis did not reveal any correlation between RNA stability and number of uORF, i.e. the RNA stabilities of exon 1 transcripts containing multiple uORF did not dramatically differ from those exon 1 transcripts that lack uORF. Interestingly, however, our results demonstrate that the alternative untranslated first exons of the mouse GR are translated with differing efficiencies, irrespective of transcript abundance. For example, the exon 1.9 transcript was shown to be one of the most efficiently translated in AtT-20 cells (Figs. 6B and 7B). Therefore, such low expressed transcripts might contribute to GR protein levels to a higher degree than expected from studies that only monitor transcription. Translational initiation is a critical determinant of efficient mRNA translation into protein (22), the efficiency of which depends on the presence of a relatively short 5′-UTR, a lack of uAUG, low CG content, and a low free energy (13, 14, 20–22). Compared with other first exons, exon 1.5 fulfils these criteria most closely; thus, it would be predicted to display high translational efficiency (Supplemental Table 2). Conversely, exon 1.4c would be expected to lie at the opposite end of the spectrum: its size, extensive secondary structure, high energetic stability, and the presence of uORF predict interference with efficient translation into full-length protein (42, 43). These in silico predictions were proven to hold true in both in vitro and in vivo reporter gene assays. Notably, however, with the exception of exon 1.5, all other tested first exons were more efficiently translated in a cell line than in vitro, supporting the view that cells translate moderately structured leader sequences more efficiently than cellular lysates (27).
We determined translation levels for the first exons using TrIP assays in the context of the entire endogenous GR mRNA sequence. uORF can also be translated and thus might also be targeted by TrIP; ribosomes that encounter uORF can reinitiate at the main ORF, stall after translating an uORF, or scan through the uORF (41). The fact that relative translation efficiencies directed by the majority of analyzed GR exon 1s fused to luciferase resemble those of endogenous GR-exon 1 transcripts measured by TrIP assay validates both methods to measure translational efficiency, albeit with two exceptions: the sequences of exons 1.4c and 1.12a were found to be moderately translated in the TrIP assay but proved to be inhibitory when fused to a luciferase gene. This may be explained by the fact that these exons encode uORF that overlap out-of-frame with the luciferase-coding sequence in the reporter construct, consequently leading to reduced luciferase levels (Supplemental Table 2).
In summary, we have shown that the 5′-UTR of the mouse GR exhibits similarities to the highly homologous human and rat alternative first exons in terms of number and structure. We report on the differential cell/tissue-specific expression profiles of the various exon 1 transcripts and suggest that coexpression of different exon 1 transcripts from multiple promoters provides the plasticity necessary for integrating diverse physiological states and demands. Furthermore, our results strengthen previous reports that different 5′-UTR isoforms determine mRNA stability and translational efficiency in different cell types; this feature adds another mechanism through which GR protein expression can be finely regulated, with the multiple transcripts serving to facilitate cell-specific responses (44, 45).
Materials and Methods
RNA isolation and 5′rapid amplification of cDNA ends (5′RACE)
A pool of tissues was prepared from 2-month-old C57/Bl6N male mice (n = 5). RNA was extracted from this pool, N1E-115 [American Type Culture Collection (Manassas, VA) no. CRL-2263] and N6 (46) cell lines using TRIzol (Invitrogen, Eggenstein, Germany). Total RNA (3.5 μg) from hippocampus, N6, and N1E-115 cells was used for 5′-RACE (GeneRacer kit, Invitrogen) experiments. Products were amplified using the forward GeneRacer 5′-primer and a reverse primer (5′-GTGAAGACGCAGAAACCTTGACTGTAG-3′) targeting exon 2 of the mouse GR cDNA. PCR was performed with Taq DNA Polymerase (Fermentas, St. Leon-Rot, Germany), products were purified (QIAquick Gel Extraction Kit; QIAGEN, Hilden, Germany) and subjected to a further seminested PCR using the Gene Racer 5′-nested primer and the same GR-specific reverse primer. The purified nested PCR products were cloned (TOPO TA cloning Kit, Invitrogen) and a total of 204 independent 5′-RACE clones, derived from the above-mentioned RNA sources, were sequenced to determine differential transcriptional start sites.
Cloning of GR 5′-UTR into the luciferase reporter plasmid
Two phosphorylated oligonucleotides containing the T7 promoter sequence were annealed to generate an oligonucleotide with a 5′-HindIII and 3′-NcoI overhang and a nested HindIII restriction site at the 3′-end (the 5′-HindIII overhang is not reconstituted after ligation). Oligonucleotides were 5′-AGCTAATACGACTCACTATAGGGAAGCTTC-3′ and 5′-CATGGAAGCTTCCCTATAGTGAGTCGTATT-3′ with HindIII and NcoI overhangs and a nested HindIII restriction site (underlined). The annealed oligonucleotide was cloned into a HindIII/NcoI digested pGl3-Control vector (Promega, Heidelberg, Germany) to generate pGl3-Control-T7.
GR-exon 1 variants were PCR amplified from cDNA using alterative forward primers containing a HindIII restriction site (underlined) 5′-AGAGAAGCTTCCTCTCGTGCATGATGCAACACCTG (1.1), 5′-AGAGAAGCTTAAAGAGCACCTCTGCCAAAATGG (1.3), 5′-AGAGAAGCTTCCTCAGCTCCGATCAGAAGTG (1.4c), 5′-AGAGAAGCTTCAACTTACTATTCCGTCTGCAACTTG (1.5), 5′-AGAGAAGCTTCCGAGCGGTTCCAAGCCG (1.7), 5′-AGAGAAGCTTCCCTCGCTCGGTCCCGCTCG (1.9), 5′-AGAGAAGCTTAGAACGCGCGCGGGGAGACG (1.10), 5′-AGAGAAGCTTATCCCTGGCCCAGCGCGCTGC (1.11), 5′-AGAGAAGCTTACATTTCTCCCTTCACCTCGCAC (1.12a) and a common reverse primer containing an NcoI restriction site (underlined) 5′-GACTCCAAAGAATCCTTAGCTCCCATGGAGAG-3′. The amplified products contained the variant 5′-UTR sequences including nucleotides from position +1 to +27 from the initiator ATG. The PCR products were subcloned into the pGEM-T vector (Promega). Colony-PCR and subsequent sequencing identified clones containing the correct sequence. Exon 1.6 and mutated exon 1.5 and 1.7 sequences flanked by HindIII and NcoI restriction sites were synthesized and cloned into pMA vector by Geneart (Regensburg, Germany). Exon 1s, including the downstream start codon, were cloned in frame to the firefly luciferase gene using the HindIII and NcoI restriction sites of pGl3-Control-T7 to obtain pGl3-Control-T7-exon1 constructs.
Cloning of recombinant DNA standards
The sequence for GR exon 2 containing the target region for qPCR reverse primer (Supplemental Table 3) was PCR amplified using forward primer 5′-CTAATCGGATCAGAGATAATGTGG and reverse primer 5′-AGAGGATCCTCTGCTGCTTGGAATCTG. PCR product was cloned into pCR2.1 (Invitrogen), obtaining pCR2.1-exon2, and its correct sequence was verified by sequencing. The vector was digested by HindIII and SspI and ligated with HindIII-SspI exon 1-fragments derived from pGl3-Control-T7-exon 1 vectors. The cloning product pCR2.1-exon2-1 serves as external standard for exon 1 transcript quantification. qPCR standard for total GR was obtained by TOPO TA Cloning the PCR product that was amplified by total GR primers (Supplemental Table 3) into pCR2.1 vector.
Reverse transcription and qPCR
RNA samples (1.5 μg) from different tissues and cell types were reverse transcribed (RevertAid Premium Reverse Transcriptase and oligo(dT)primer, Fermentas) to analyze exon 1 transcript levels. qPCR was performed using the Roche LightCycler and LightCycler FastStart DNA Master plus SYBR GreenI Kit (Roche, Mannheim, Germany).
Absolute quantification of exon 1 transcripts
Recombinant DNA standards, pCR2.1-exon2–1, were linearized by HindIII, and DNA concentration was measured in triplicate by NanoPhotometer (Implen, Munich, Germany). The plasmid was serially diluted (1:10) to serve as an external homologous DNA standard of known copy number. Plasmid concentrations of 10−5 to 10−10 μg/μl were used, within the range of cDNA samples, to provide calibration curves for each exon 1 transcript. Copy numbers of each exon 1 transcript were extrapolated from the calibration curve. Molecules per gram plasmid standard were calculated using the formula: NA × MW−1; NA = Avogadro constant; MW = molecular weight of plasmid. Primer sequences are listed in Supplemental Table 3.
Cell culture
AtT-20 (American Type Culture Collection no. CCL-89), N1E-115, HW3.5 (47), and N6 cells were grown in DMEM (no. 41965-062, Invitrogen) supplemented with 10% fetal bovine serum (Invitrogen) and penicillin/streptomycin. For depolarization experiments in N6 cells, KCl was added to the medium at a final concentration of 50 mm. AtT-20 cells were maintained in DMEM without phenol red (DMEM, no. 31053-044, Invitrogen) containing 10% charcoal-treated serum before treatment with 20 ng/ml bFGF (no. 450-33, PreproTech, Hamburg, Germany) for 24 h. Serum was depleted of steroids by overnight incubation with active charcoal and subsequent filtration.
RNA stability assay
AtT-20 and N6 cells (1–1.5 × 10⁴ per cm2) were seeded 1 d before treatment with actinomycin D (5 μg/ml; Sigma, Munich, Germany) for 0, 2, 4, 6, 8, and 10 h. Cells were harvested for extraction of RNA that was reverse transcribed using random hexamers. GR-exon 1 cDNA transcripts were quantified by qPCR using 18s RNA as an internal control. RNA degradation was plotted semilogarithmically, and RNA half-life was calculated according to the following equation: (ln 0.5)/kd = t0.5 (48).
In vitro RNA synthesis and translation
For in vitro transcription pGl3-Control-T7-exon 1 vectors were linearized by XbaI and pGl3-Control-T7-exon 1.1 by FseI digestion, phenol/chloroform purified, and 1 μg was used for large-scale RNA synthesis (RiboMAX, Promega). RNA concentrations were measured spectrophotometrically and visualized on an agarose gel after deoxyribonuclease treatment and phenol/chloroform purification. RNA (2 μg) was used for translation (rabbit reticulocyte lysate system, Promega) and luciferase activity was subsequently measured.
Transient transfection and reporter assay
AtT-20 cells (1 × 10⁴ per cm2) were seeded 1 d before transfection onto six-well plates. The pGl3-Control-T7-exon 1 vectors (2 μg each) together with the transfection control pRK7βGal (0.5 μg) were transfected using 12 μl Lipofectamine reagent (Invitrogen). Cells were harvested after 24 h and assayed for luciferase activity; values were normalized against β-galactosidase levels. To establish luciferase activity as a function of translational, but not of transcriptional, regulation, reverse transcribed luciferase mRNA was quantified (qPCR) relative to β-galactosidase mRNA from deoxyribonuclease-(QIAGEN) treated RNA extracts to derive a translation efficiency index (relative luciferase activity/relative mRNA).
Immunoprecipitation of actively translated mRNA (TrIP)
Antibody affinity capture beads were prepared from Dynabeads Sheep anti-Rat (Invitrogen) and rat monoclonal Hsc/HSP73 antibody (Enzo Life Science, Lörrach, Germany), as described elsewhere (29). AtT-20 cells were incubated with either vehicle or 400 μm puromycin (Sigma) for 1 h. Cytoplasmic extracts were prepared from 5 × 10⁴ to 105 AtT-20 cells, and one tenth of the extract was added to antibody affinity capture beads (2.5 × 10⁷). Actively translated mRNA was isolated by TRIzol, reverse transcribed, and quantified by qPCR.
Software and statistical analysis
The public-accessible bioinfomatic software program Mfold (http://www.bioinfo.rpi.edu/applications/mfold) (23, 24) was used to predict the secondary structure of the 5′-UTR and to calculate free energy (dG) released upon folding. To predict mutations deleterious for RNA secondary structure RDMAS (http:/biotech.bmi.ac.cn/rdmas/index.php) (49) and RNAmute (http:/www.cs.bgu.ac.il/∼RNAMute/Efficient) (50) software were used. All data were expressed as mean ± sem. Statistical analyses were performed by t test using SigmaStat (Erkrath, Germany); a value of P < 0.05 was considered to denote statistical significance.
Acknowledgments
We thank Alexandre Patchev for providing tissues; Dieter Fischer and Anke Hoffmann (Max Planck Institute of Psychiatry, Munich, Germany) for technical advice; and Danny Barash (Ben-Gurion University, Beer-Sheva, Israel) for advice regarding RNA secondary structure predictions.
This work was funded by the European Union (Crescendo-European Union contract no. LSHM-CT-2005-018652) (to O.F.X.A and D.S).
Disclosure Summary: The authors have nothing to disclose.
NURSA Molecule Pages†:
Nuclear Receptors: GR.
Footnotes
- bFGF
- Basic fibroblast growth factor
- ER
- estrogen receptor
- EST
- expressed sequence tag
- GR
- glucocorticoid receptor
- qPCR
- quantitative PCR
- RACE
- rapid amplification of cDNA ends
- TrIP
- translationally active RNA immunoprecipitation
- uAUG
- upstream AUG
- uORF
- upstream open reading frames
- UTR
- untranslated regions.
References
- 1. Ayoubi TA , Van De Ven WJ. 1996. Regulation of gene expression by alternative promoters. FASEB J 10:453–460 [PubMed] [Google Scholar]
- 2. Hirata S , Shoda T , Kato J , Hoshi K. 2001. The multiple untranslated first exons system of the human estrogen receptor β (ER β) gene. J Steroid Biochem Mol Biol 78:33–40 [DOI] [PubMed] [Google Scholar]
- 3. Iwamoto H , Hirata S , Shoda T , Kato J , Hoshi K. 2003. The novel 5′-untranslated first exon, exon 0H, of the rat estrogen receptor β gene. Endocr Res 29:157–168 [DOI] [PubMed] [Google Scholar]
- 4. Kos M , Reid G , Denger S , Gannon F. 2001. Minireview: genomic organization of the human ERα gene promoter region. Mol Endocrinol 15:2057–2063 [DOI] [PubMed] [Google Scholar]
- 5. Kwak SP , Patel PD , Thompson RC , Akil H , Watson SJ. 1993. 5′-Heterogeneity of the mineralocorticoid receptor messenger ribonucleic acid: differential expression and regulation of splice variants within the rat hippocampus. Endocrinology 133:2344–2350 [DOI] [PubMed] [Google Scholar]
- 6. Zennaro MC , Le Menuet D , Lombès M. 1996. Characterization of the human mineralocorticoid receptor gene 5′-regulatory region: evidence for differential hormonal regulation of two alternative promoters via nonclassical mechanisms. Mol Endocrinol 10:1549–1560 [DOI] [PubMed] [Google Scholar]
- 7. Turner JD , Muller CP. 2005. Structure of the glucocorticoid receptor (NR3C1) gene 5′ untranslated region: identification, and tissue distribution of multiple new human exon 1. J Mol Endocrinol 35:283–292 [DOI] [PubMed] [Google Scholar]
- 8. Strähle U , Schmidt A , Kelsey G , Stewart AF , Cole TJ , Schmid W , Schütz G. 1992. At least three promoters direct expression of the mouse glucocorticoid receptor gene. Proc Natl Acad Sci USA 89:6731–6735 [DOI] [PMC free article] [PubMed] [Google Scholar]
- 9. McCormick JA , Lyons V , Jacobson MD , Noble J , Diorio J , Nyirenda M , Weaver S , Ester W , Yau JL , Meaney MJ , Seckl JR , Chapman KE. 2000. 5′-heterogeneity of glucocorticoid receptor messenger RNA is tissue specific: differential regulation of variant transcripts by early-life events. Mol Endocrinol 14:506–517 [DOI] [PubMed] [Google Scholar]
- 10. Breslin MB , Geng CD , Vedeckis WV. 2001. Multiple promoters exist in the human GR gene, one of which is activated by glucocorticoids. Mol Endocrinol 15:1381–1395 [DOI] [PubMed] [Google Scholar]
- 11. Presul E , Schmidt S , Kofler R , Helmberg A. 2007. Identification, tissue expression, and glucocorticoid responsiveness of alternative first exons of the human glucocorticoid receptor. J Mol Endocrinol 38:79–90 [DOI] [PubMed] [Google Scholar]
- 12. Chen F , Watson CS , Gametchu B. 1999. Multiple glucocorticoid receptor transcripts in membrane glucocorticoid receptor-enriched S-49 mouse lymphoma cells. J Cell Biochem 74:418–429 [PubMed] [Google Scholar]
- 13. Babendure JR , Babendure JL , Ding JH , Tsien RY. 2006. Control of mammalian translation by mRNA structure near caps. RNA 12:851–861 [DOI] [PMC free article] [PubMed] [Google Scholar]
- 14. Pickering BM , Willis AE. 2005. The implications of structured 5′ untranslated regions on translation and disease. Semin Cell Dev Biol 16:39–47 [DOI] [PubMed] [Google Scholar]
- 15. Turner JD , Schote AB , Macedo JA , Pelascini LP , Muller CP. 2006. Tissue specific glucocorticoid receptor expression, a role for alternative first usage? Biochem Pharmacol 72:1529–1537 [DOI] [PubMed] [Google Scholar]
- 16. Turner JD , Alt SR , Cao L , Vernocchi S , Trifonova S , Battello N , Muller CP. 2010. Transcriptional control of the glucocorticoid receptor: CpG islands, epigenetics and more. Biochem Pharmacol 80:1860–1868 [DOI] [PubMed] [Google Scholar]
- 17. Cao-Lei L , Leija SC , Kumsta R , Wust S , Meyer J , Turner JD , Muller CP. 2011. Transcriptional control of the human glucocorticoid receptor: identification and analysis of alternative promoter regions. Hum Genet 129:533–543 [DOI] [PubMed] [Google Scholar]
- 18. van Wijk PA , van Neck JW , Rijnberk A , Croughs RJ , Mol JA. 1995. Proliferation of the murine corticotropic tumour cell line AtT20 is affected by hypophysiotrophic hormones, growth factors and glucocorticoids. Mol Cell Endocrinol 111:13–19 [DOI] [PubMed] [Google Scholar]
- 19. Flavell SW , Greenberg ME. 2008. Signaling mechanisms linking neuronal activity to gene expression and plasticity of the nervous system. Annu Rev Neurosci 31:563–590 [DOI] [PMC free article] [PubMed] [Google Scholar]
- 20. Kochetov AV , Ischenko IV , Vorobiev DG , Kel AE , Babenko VN , Kisselev LL , Kolchanov NA. 1998. Eukaryotic mRNAs encoding abundant and scarce proteins are statistically dissimilar in many structural features. FEBS Lett 440:351–355 [DOI] [PubMed] [Google Scholar]
- 21. Kozak M. 1991. An analysis of vertebrate mRNA sequences: intimations of translational control. J Cell Biol 115:887–903 [DOI] [PMC free article] [PubMed] [Google Scholar]
- 22. Gray NK , Wickens M. 1998. Control of translation initiation in animals. Annu Rev Cell Dev Biol 14:399–458 [DOI] [PubMed] [Google Scholar]
- 23. Zuker M. 2003. Mfold web server for nucleic acid folding and hybridization prediction. Nucleic Acids Res 31:3406–3415 [DOI] [PMC free article] [PubMed] [Google Scholar]
- 24. Mathews DH , Sabina J , Zuker M , Turner DH. 1999. Expanded sequence dependence of thermodynamic parameters improves prediction of RNA secondary structure. J Mol Biol 288:911–940 [DOI] [PubMed] [Google Scholar]
- 25. Kozak M. 2005. Regulation of translation via mRNA structure in prokaryotes and eukaryotes. Gene 361:13–37 [DOI] [PubMed] [Google Scholar]
- 26. Wang G , Guo X , Floros J. 2005. Differences in the translation efficiency and mRNA stability mediated by 5′-UTR splice variants of human SP-A1 and SP-A2 genes. Am J Physiol Lung Cell Mol Physiol 289:L497–L508 [DOI] [PubMed] [Google Scholar]
- 27. De Moor CH , Jansen M , Bonte EJ , Thomas AA , Sussenbach JS , Van den Brande JL. 1994. Influence of the four leader sequences of the human insulin-like-growth-factor-2 on the expression of reporter genes. Eur J Biochem 226:1039–1047 [DOI] [PubMed] [Google Scholar]
- 28. Gauss KA , Bunger PL , Crawford MA , McDermott BE , Swearingen R , Nelson-Overton LK , Siemsen DW , Kobayashi SD , Deleo FR , Quinn MT. 2006. Variants of the 5′-untranslated region of human NCF2: expression and translational efficiency. Gene 366:169–179 [DOI] [PubMed] [Google Scholar]
- 29. Kudo K , Xi Y , Wang Y , Song B , Chu E , Ju J , Russo JJ , Ju J. 2010. Translational control analysis by translationally active RNA capture/microarray analysis (TrIP-Chip). Nucleic Acids Res 38:e104. [DOI] [PMC free article] [PubMed] [Google Scholar]
- 30. Eggers DK , Welch WJ , Hansen WJ. 1997. Complexes between nascent polypeptides and their molecular chaperones in the cytosol of mammalian cells. Mol Biol Cell 8:1559–1573 [DOI] [PMC free article] [PubMed] [Google Scholar]
- 31. Azzam ME , Algranati ID. 1973. Mechanism of puromycin action: fate of ribosomes after release of nascent protein chains from polysomes. Proc Natl Acad Sci USA 70:3866–3869 [DOI] [PMC free article] [PubMed] [Google Scholar]
- 32. Alt SR , Turner JD , Klok MD , Meijer OC , Lakke EA , Derijk RH , Muller CP. 2010. Differential expression of glucocorticoid receptor transcripts in major depressive disorder is not epigenetically programmed. Psychoneuroendocrinology 35:544–556 [DOI] [PubMed] [Google Scholar]
- 33. Pavithra L , Sreenath K , Singh S , Chattopadhyay S. 2010. Heat-shock protein 70 binds to a novel sequence in 5′ UTR of tumor suppressor SMAR1 and regulates its mRNA stability upon prostaglandin A2 treatment. FEBS Lett 584:1187–1192 [DOI] [PubMed] [Google Scholar]
- 34. Zhao X , Chen J , Lei L , Hu G , Xiong Y , Xu J , Li Q , Yang X , Chang CC , Song B , Chang T , Li B. 2009. The optional long 5′-untranslated region of human ACAT1 mRNAs impairs the production of ACAT1 protein by promoting its mRNA decay. Acta Biochim Biophys Sin (Shanghai) 41:30–41 [DOI] [PubMed] [Google Scholar]
- 35. Payton SG , Haska CL , Flatley RM , Ge Y , Matherly LH. 2007. Effects of 5′ untranslated region diversity on the posttranscriptional regulation of the human reduced folate carrier. Biochim Biophys Acta 1769:131–138 [DOI] [PMC free article] [PubMed] [Google Scholar]
- 36. Vilela C , Ramirez CV , Linz B , Rodrigues-Pousada C , McCarthy JE. 1999. Post-termination ribosome interactions with the 5′UTR modulate yeast mRNA stability. EMBO J 18:3139–3152 [DOI] [PMC free article] [PubMed] [Google Scholar]
- 37. Capri M , Santoni MJ , Thomas-Delaage M , Aït-Ahmed O. 1997. Implication of a 5′ coding sequence in targeting maternal mRNA to the Drosophila oocyte. Mech Dev 68:91–100 [DOI] [PubMed] [Google Scholar]
- 38. Saunders C , Cohen RS. 1999. The role of oocyte transcription, the 5′UTR, and translation repression and derepression in Drosophila gurken mRNA and protein localization. Mol Cell 3:43–54 [DOI] [PubMed] [Google Scholar]
- 39. Thio GL , Ray RP , Barcelo G , Schüpbach T. 2000. Localization of gurken RNA in Drosophila oogenesis requires elements in the 5′ and 3′ regions of the transcript. Dev Biol 221:435–446 [DOI] [PubMed] [Google Scholar]
- 40. Chatterjee S , Pal JK. 2009. Role of 5′- and 3′-untranslated regions of mRNAs in human diseases. Biol Cell 101:251–262 [DOI] [PubMed] [Google Scholar]
- 41. Morris DR , Geballe AP. 2000. Upstream open reading frames as regulators of mRNA translation. Mol Cell Biol 20:8635–8642 [DOI] [PMC free article] [PubMed] [Google Scholar]
- 42. Kos M , Denger S , Reid G , Gannon F. 2002. Upstream open reading frames regulate the translation of the multiple mRNA variants of the estrogen receptor α. J Biol Chem 277:37131–37138 [DOI] [PubMed] [Google Scholar]
- 43. Kozak M. 1987. Effects of intercistronic length on the efficiency of reinitiation by eucaryotic ribosomes. Mol Cell Biol 7:3438–3445 [DOI] [PMC free article] [PubMed] [Google Scholar]
- 44. Imataka H , Nakayama K , Yasumoto K , Mizuno A , Fujii-Kuriyama Y , Hayami M. 1994. Cell-specific translational control of transcription factor BTEB expression. The role of an upstream AUG in the 5′-untranslated region. J Biol Chem 269:20668–20673 [PubMed] [Google Scholar]
- 45. Hill JR , Morris DR. 1992. Cell-specific translation of S-adenosylmethionine decarboxylase mRNA. Regulation by the 5′ transcript leader. J Biol Chem 267:21886–21893 [PubMed] [Google Scholar]
- 46. Belsham DD , Cai F , Cui H , Smukler SR , Salapatek AM , Shkreta L. 2004. Generation of a phenotypic array of hypothalamic neuronal cell models to study complex neuroendocrine disorders. Endocrinology 145:393–400 [DOI] [PubMed] [Google Scholar]
- 47. Baj A , Bettaccini A , Nishimura T , Onodera T , Toniolo A. 2005. Poliovirus type 1 infection of murine PRNP-knockout neuronal cells. J Neurovirol 11:237–246 [DOI] [PubMed] [Google Scholar]
- 48. Ross J. 1995. mRNA stability in mammalian cells. Microbiol Rev 59:423–450 [DOI] [PMC free article] [PubMed] [Google Scholar]
- 49. Shu W , Bo X , Liu R , Zhao D , Zheng Z , Wang S. 2006. RDMAS: a web server for RNA deleterious mutation analysis. BMC Bioinformatics 7:404. [DOI] [PMC free article] [PubMed] [Google Scholar]
- 50. Churkin A , Barash D. 2006. RNAmute: RNA secondary structure mutation analysis tool. BMC Bioinformatics 7:221. [DOI] [PMC free article] [PubMed] [Google Scholar]