

Selective attenuation of α-MSH regulated gene expression upon siRNA ablation of Nr4a1 expression demonstrates a novel mechanism of cross-talk between α-MSH and Nr4a signaling in adipose.
Abstract
Several recent investigations have underscored the growing role of melanocortin signaling in the peripheral regulation of lipid, glucose, and energy homeostasis. In addition, the melanocortins play a critical role in the central control of satiety. These observations, and the latest reports highlighting the emerging role of the nuclear hormone receptor (NR) 4A subgroup in metabolism, have prompted us to investigate the cross talk between [Nle4, d-Phe7] (NDP)-α-MSH and Nr4a signaling in adipose. We have shown that NDP-MSH strikingly and preferentially induces the expression of the NR4A subgroup (but not any other members of the NR superfamily) in differentiated 3T3-L1 adipocytes. Utilization of quantitative PCR on custom-designed metabolic TaqMan low-density arrays identified the concomitant and marked induction of the mRNAs encoding Il-6, Cox2, Pdk4, and Pck-1 after NDP-MSH treatment. Similar experiments demonstrated that the mRNA expression profile induced by cAMP and NDP-MSH treatment displayed unique but also overlapping properties and suggested that melanocortin-mediated induction of gene expression involves cAMP-dependent and -independent signaling. Nr4a1/Nur77 small interfering RNA (siRNA) expression suppressed NDP-MSH-mediated induction of Nr4a1/Nur77 and Nr4a3/Nor-1 (but not Nr4a2/Nurr1). Moreover, expression of the siRNA-attenuated NDP-MSH mediated induction of the mRNAs encoding Il-6, Cox2/Ptgs2, and Pck-1 expression. In addition, Nur77 siRNA expression attenuated NDP-MSH-mediated glucose uptake. In vivo, ip administration of NDP-MSH to C57 BL/6J (male) mice significantly induced the expression of the mRNA encoding Nur77 and increased IL-6, Cox2, Pck1, and Pdk4 mRNA expression in (inguinal) adipose tissue. We conclude that Nur77 expression is necessary for MSH-mediated induction of gene expression in differentiated adipocytes. Furthermore, this study demonstrates cross talk between MSH and Nr4a signaling in adipocytes.
The Nr4a subfamily of orphan nuclear receptors consists of three well-characterized members that include Nur77 (Nr4a1), Nurr1 (Nr4a2), and Nor-1 (Nr4a3) (1). Notably, the Nr4a's are identified as early-response genes and are rapidly expressed in response to a number of physiological and pathophysiological stimuli including stress, fatty acids, neurotransmitters, growth factors, and cytokines (2). Moreover, the Nr4as are implicated in a number of biological processes including DNA repair (3), atherosclerotic vascular disease (4), cell apoptosis and carcinogenesis (5), and metabolism (1, 2, 6–9).
Several groups have demonstrated that β-adrenergic stimulation and/or cAMP signaling markedly and transiently activates the Nr4a subgroup in skeletal muscle, primary hepatocytes and liver, and 3T3-L1 adipocyte cells. Moreover, this was concomitant with the modulation of several genes implicated in lipid, glucose, and energy expenditure (6, 9–13). More recently it was identified that the anorectic neuropeptide α-MSH could also induce the Nr4a family in B16 mouse melanoma cells and primary human melanocytes (14). This is particularly interesting, given that the melanocortins also play a major role in the regulation of feeding behavior and energy expenditure. Furthermore, these melanocortins exert lipogenic effects on peripheral tissue via melanocortin receptor subtypes (15, 16).
To date α-MSH has been mostly studied in skin pigmentation and the regulation of energy homeostasis (17). For example, in the context of metabolism, peripheral administration of α-MSH decreases weight gain in diet-induced obese mice (18) and Pomc-deficient mice (19). In 3T3-L1 adipocyte cells, melanocortin receptors, MC2R and MC5R, are the most abundantly expressed melanocortin receptors (20). ACTH can induce the activity of MC1–5R; however, α-MSH activates all the melanocortin receptors, with the exception of MC2R. Moreover, studies have shown that α-MSH treatment results in lipolysis and the release of free fatty acids in 3T3-L1 adipocyte and isolated mouse adipocytes (20, 21).
Recent reports have underscored the metabolic role of the Nr4as in a number of tissue- and cell-based systems and the induction of this subgroup of nuclear receptors by the anorectic neuropeptide α-MSH. We were interested in examining the functional role of this subgroup in the in vitro adipogenic 3T3-L1 cell line in the context of α-MSH signaling in adipose.
In this study, we have identified that the mRNAs encoding the Nr4a subgroup are strikingly and transiently induced by [Nle4, d-Phe7] (NDP)-α-MSH, a synthetic α-MSH analog (22, 23) in differentiated 3T3-L1 adipocytes concomitant with the induction of several genes (with important roles in inflammatory signaling and metabolism) including, Il6, Cox2/Ptgs2, Pck-1, and Pdk4. Furthermore, Nur77 small interfering RNA (siRNA) expression attenuated the NDP-MSH-mediated induction of the Nr4a subgroup and Il6, Cox2/Ptgs2, and Pck-1, suggesting a role for cross talk between α-MSH and Nr4a signaling in the modulation of glucose homeostasis in differentiated 3T3-L1 adipocytes.
Results
NDP-MSH strikingly and selectively activates the expression of the Nr4a subgroup
To ascertain whether regulatory cross talk between NDP-MSH and nuclear hormone receptor (NR) signaling occurs in differentiated adipocytes, we used a custom-designed ABI microfluidic TaqMan low-density array (TLDA). This TLDA microfluidic card encoded TaqMan primer sets targeting the entire mouse gene superfamily of NRs that are implicated in the regulation of systems that control endocrine physiology, metabolism, development, and reproduction. These microfluidic cards also incorporate the following five normalization controls: 18S rRNA, Gapdh, Gusb, Hprt1, and 36b4 that span the cycle threshold (Ct) range of the target genes. Three of these controls, 18S rRNA, Gapdh, and 36b4, have been validated as robust normalization controls by the Nuclear Receptor Signaling Atlas (NURSA) consortium for large-scale quantitative real-time PCR (qPCR) mediated NR profiling in several cell culture models, and mouse tissues (24, 25).
Intriguingly, qPCR on the TLDA platform revealed the significant differential expression of several NRs (see Fig. 1A and Table 1). Significance was assigned by the application of the empirical Bayes statistic. Moreover, the assignment of significance was very conservatively refined by the filtering of data using Benjamini-Hochberg analysis to control the P value false discovery rate (FDR), and the application of the Bayes B statistic [which considers and ranks a proportion of differentially expressed genes (P < 0.01)]. FDR, coupled to ranking with the B statistic, resulted in the elimination of the target genes with negative B scores (which suggested < 50:50 chance of differential expression). NDP-MSH treatment (2 h) of 3T3-L1 adipocytes [relative to vehicle (PBS) treatment] resulted in the very significant (adjusted P < 0.001, positive B-statistic scores 1.7–8.2), striking, and selective induction (∼30- to 100-fold) of the three members of the Nr4a subgroup when normalized against the StatMiner-Genorm selected most stable controls, with the least expression variation (18S rRNA, Gapdh, and Gusb). To a markedly lesser extent, only one other NR, Vdr (3.9-fold), was significantly induced. Surprisingly, NDP-MSH did not significantly induce the other members of the NR family (Fig. 1A and Table 1). In summary, the TLDA analysis of the NR superfamily revealed the distinctly selective (and striking) cross talk between MSH and Nr4a signaling in differentiated adipocytes.
Fig. 1.

NDP-MSH selectively activates the expression of Nr4a nuclear receptor subgroup. A, Graph showing relative quantification (log10), i.e. calculated fold differences of nuclear receptor genes after NDP-MSH-treated adipocytes (relative to vehicle, PBS/calibrator). B, Graph showing relative quantification (log10), i.e. fold differences of nuclear receptor genes after 8-Br cAMP treatment (relative to vehicle, PBS/calibrator). Data are derived from Tables 1 and 2, respectively, expressed as fold changes normalized to the mean/median of the most stable Genorm selected controls (18S rRNA, Gapdh, and GusB) with the least expression variation. Differentially expressed genes were identified by linear models (contained in the LIMMA package for Bioconductor R embedded in StatMiner). The relative quantification log 10, i.e. the calculated fold differences [between the target (NDP-MSH and 8-Br cAMP treatment) and the calibrator/reference (vehicle treatment) sample] are displayed in Tables 1 and Table 2, respectively. Data are presented as valid when the Ct values of the gene in the calibrator/reference and target samples (i.e. before and after treatment, respectively) are less than 35 cycles. Moreover, fold differences are flagged as target not detected, calibrator not detected, and no detection when the Ct value of the gene(s) in the target (NDP-MSH or cAMP treated), calibrator (vehicle), and/or both samples are 35 cycles or greater (than the threshold limit). Hence, the reported quantitative “fold change of a gene that is not expressed in some of the biological conditions may not be reliable” (47); however, it does reflect a qualitative difference. The Applied Biosystems SDS software utilized with the ABI7900 instrument assigns Ct values beyond the arbitrarily set threshold (Ct 35) up to a maximum Ct 40, which are utilized to calculate expression (in the calibrator and target not detected genes). Significance is assigned after the application of the empirical Bayes statistic, and Benjamini-Hochberg false detection rate analysis, adjusted P values, and the B scores (>0) are considered for the final assignments (see Materials and Methods). *, P < 0.05; **, P < 0.01; ***, P < 0.001.
Table 1.
Analysis of mouse NR gene expression in 3T3-L1 adipocytes treated with NDP-MSH
| Detector | B value | t value | P value | Adjusted P value (FDR) | Log10 RQ | Linear RQ | Ct status |
|---|---|---|---|---|---|---|---|
| Ar-Mm00442688_m1 | −7.22399868158938 | 0.73208 | 0.49669 | 0.73078 | −0.064420419072092 | 0.86214 | Valid |
| Esr1-Mm00433149_m1 | −7.24969871166557 | 0.69895 | 0.51547 | 0.73078 | −0.254771719663615 | 0.55620 | No detection |
| Esr2-Mm00599819_m1 | −7.48900909552998 | 0.25705 | 0.80729 | 0.88068 | −0.142688217944727 | 0.71997 | Target not detected |
| Esrra-Mm00433143_m1 | −7.42996 | −0.408922825843263 | 0.69937 | 0.83127 | 0.04114 | 1.09936 | Valid |
| Esrrb-Mm00442411_m1 | −7.1667471587223 | 0.80187 | 0.45870 | 0.73078 | −0.382809811152694 | 0.41418 | No detection |
| Esrrg-Mm00516267_m1 | −6.80068 | −1.17387867497104 | 0.29284 | 0.56322 | 0.97273 | 9.39136 | Calibrator not detected |
| Hnf4a-Mm00433964_m1 | −7.09361679187359 | −0.884738688556906 | 0.41645 | 0.73078 | 0.17359 | 1.49140 | Valid |
| Hnf4g-Mm00443563_m1 | −4.94556729942662 | −2.61847886950877 | 0.04676 | 0.17264 | 0.15112 | 1.41618 | No detection |
| Dax-Mm00431729_m1 | −4.94557 | −2.61847886950877 | 0.04676 | 0.17264 | 0.15112 | 1.41618 | No detection |
| Shp-Mm00442278_m1 | −7.22980712143738 | 0.72470 | 0.50083 | 0.73078 | −0.280660299290717 | 0.52401 | No detection |
| Rev-erba-Mm00520708_m1 | −4.03480 | −3.32846032259584 | 0.02052 | 0.16418 | 0.16818 | 1.47291 | Valid |
| Rev-erb-Mm00441730_m1 | −7.38390470987611 | −0.497475417556279 | 0.63977 | 0.80813 | 0.04144 | 1.10012 | Valid |
| Lxrb-Mm00437262_m1 | −7.44585 | 0.37389 | 0.72368 | 0.83127 | −0.0349194794970221 | 0.92274 | Valid |
| Lxra-Mm00443454_m1 | −7.44176015428787 | −0.383196999385467 | 0.71718 | 0.83127 | 0.02669 | 1.06339 | Valid |
| Fxra-Mm00436419_m1 | −7.19653 | 0.76620 | 0.47784 | 0.73078 | −0.307451968904812 | 0.49266 | No detection |
| Fxrb-Mm01308716_m1 | −4.94556729942662 | −2.61847886950877 | 0.04676 | 0.17264 | 0.15112 | 1.41618 | No detection |
| Pxr-Mm00803092_m1 | −6.20661469567789 | −1.66706424293002 | 0.15583 | 0.41926 | 0.62303 | 4.19790 | No detection |
| Car-Mm00437986_m1 | −6.15168390378067 | 1.70975 | 0.14746 | 0.41926 | −0.566337765175836 | 0.27143 | No detection |
| Tr2-Mm00449123_m1 | −7.52801490090376 | 0.01864 | 0.98584 | 0.99802 | −0.00150514997832014 | 0.99654 | Valid |
| Tlx-Mm00455855_m1 | −4.94556729942662 | −2.61847886950877 | 0.04676 | 0.17264 | 0.15112 | 1.41618 | No detection |
| Pnr-Mm00443299_m1 | −4.94556729942662 | −2.61847886950877 | 0.04676 | 0.17264 | 0.15112 | 1.41618 | No detection |
| COUP-TF1-Mm00657937_m1 | −2.27214 | −4.90398041511805 | 0.00435 | 0.04173 | 0.17520 | 1.49692 | Valid |
| COUP-TF2-Mm00772789_m1 | −7.33692467922958 | 0.57502 | 0.58996 | 0.76536 | −0.0309057462215019 | 0.93131 | Valid |
| Ear2-Mm00438762_m1 | −7.51584 | 0.14413 | 0.89098 | 0.95038 | −0.00872986987425464 | 0.98010 | Valid |
| Gr-Mm00433832_m1 | −6.71352460251767 | −1.25164027630488 | 0.26558 | 0.56322 | 0.04154 | 1.10038 | Valid |
| Mr-Mm01241595_m1 | −6.68485477267374 | −1.27665610100014 | 0.25731 | 0.56322 | 0.16296 | 1.45532 | Valid |
| Nur77-Mm00439358_m1 | 8.21414 | −43.5475587664681 | 1.06825E-07 | 0.00001 | 1.50224 | 31.78630 | Valid |
| Nurr1-Mm00443056_m1 | 1.72159 | −10.4452421876562 | 0.00013 | 0.00192 | 1.88806 | 77.27876 | Valid |
| Nor-1-Mm00450074_m1 | 6.90613 | −29.8588159527 | 7.12918E-07 | 0.00002 | 2.00948 | 102.20581 | Valid |
| Sf-1-Mm00446826_m1 | −7.52050115581881 | −0.113763265382575 | 0.91381 | 0.95354 | 0.08208 | 1.20804 | Valid |
| Lrh-1-Mm00446088_m1 | −4.94556729942662 | −2.61847886950877 | 0.04676 | 0.17264 | 0.15112 | 1.41618 | No detection |
| Gcnf-Mm00599848_m1 | −7.18346812239051 | −0.78199782533274 | 0.46930 | 0.73078 | 0.09412 | 1.24200 | Valid |
| Pgr-Mm00435625_m1 | −6.3847189015981 | −1.52628688212191 | 0.18693 | 0.46694 | 0.77124 | 5.90526 | No detection |
| Ppara-Mm00440939_m1 | −7.29437689329319 | 0.63803 | 0.55127 | 0.73503 | −0.122418864903352 | 0.75436 | Valid |
| Ppard-Mm00803186_g1 | −6.75885243212593 | −1.2115411614176 | 0.27934 | 0.56322 | 0.04475 | 1.10854 | Valid |
| Pparg-Mm00440945_m1 | −5.18066 | −2.44140307841398 | 0.05809 | 0.19916 | 0.07817 | 1.19720 | Valid |
| Rara-Mm00436264_m1 | −6.21541383789805 | 1.66020 | 0.15722 | 0.41926 | −0.0782677988726348 | 0.83509 | Valid |
| Rarb-Mm01319676_m1 | −6.80219 | 1.17251 | 0.29334 | 0.56322 | −0.518373652533376 | 0.30313 | Valid |
| Rarg-Mm00441083_m1 | −7.27150349322754 | −0.669801501139277 | 0.53240 | 0.73078 | 0.09111 | 1.23342 | Valid |
| Rora-Mm00443103_m1 | −5.85406 | −1.93695242609036 | 0.10996 | 0.35188 | 0.09141 | 1.23428 | Valid |
| Rorb-Mm00524993_m1 | −7.46572615251607 | 0.32514 | 0.75812 | 0.84628 | −0.145999547897031 | 0.71450 | Calibrator not detected |
| Rorc-Mm00441139_m1 | −7.27208 | −0.6690192569434 | 0.53286 | 0.73078 | 0.02639 | 1.06265 | Valid |
| Rxra-Mm00441182_m1 | −7.52821835574711 | 0.00261 | 0.99802 | 0.99802 | −0.00010034333188812 | 0.99977 | Valid |
| Rxrb-Mm00441193_m1 | −6.42324698260015 | −1.49524809558933 | 0.19456 | 0.46694 | 0.05780 | 1.14235 | Valid |
| Rxrg-Mm00436410_m1 | −4.94556729942662 | −2.61847886950877 | 0.04676 | 0.17264 | 0.15112 | 1.41618 | No detection |
| Thra-Mm00617505_m1 | −7.24746389971597 | 0.70188 | 0.51379 | 0.73078 | −0.0276947596010864 | 0.93822 | Valid |
| Thrb-Mm00437044_m1 | −7.44812283948188 | 0.36863 | 0.72736 | 0.83127 | −0.0499709792802206 | 0.89131 | Valid |
| Vdr-Mm00437297_m1 | 1.50169 | −10.0309216281866 | 0.00016 | 0.00192 | 0.59734 | 3.95680 | Valid |
Table displays the P values, and adjusted P values of target genes before and after the application of FDR, respectively. Please note that genes with adjusted P values less than 0.05, after FDR, are differentially expressed in a significant manner. However, some of these genes have a negative B score because Bayes analysis stringently considers a proportion of differentially expressed genes with P < 0.01, and providesinformation about their ranking (Integromics Technical Support, Joaquin Panadero, personal communication). Analysis also includes t, the empirical Bayes moderated t statistic (a variant t test), an empirically moderated estimate of standard error. The relative quantification (RQ) linear and log10 denotes the calculated fold differences [between the target (NDP-MSH treatment) and the calibrator/ reference (vehicle treatment) in a linear and log scale, respectively], normalized against the mean of the Genorm selected controls, 18S rRNA, Gapdh, and GusB. Bold indicates genes differentially expressed in a significant manner.
α-MSH and the synthetic analog, NDP-MSH, induces the activity of all the melanocortin receptors, with the exception of MC2R (20, 23). We observed NDP-MSH mediated induction occurred in the absence of any significant changes in Mc1–5r expression. In addition, and as previously described (26), Mc2-r and Mc5-r were the most abundantly expressed melanocortin receptors in 3T3-L1 adipocytes (data not shown). MSH signaling involves the induction of the cAMP signaling cascade; however, it also involves several other pathways including calcium, p38 MAPK, Ras-Raf-MAPK kinase-ERK, the human homolog of agouti, the agouti signaling protein, c-Jun N-terminal kinase, and AMP-activated protein kinase (AMPK) (20, 27). Therefore, we compared and contrasted the effects of NDP-MSH and cAMP treatment on NR expression and induction in 3T3-L1 adipocytes. There were clear differences in the pattern of differential expression of nuclear receptors (after NDP-MSH and cAMP treatment; see Fig. 1A vs. Fig. 1B, Table 1, and Table 2). However, after application of stringent empirical Bayes statistic and FDR analysis to assign and rank significance, only NR4A1/Nur77 and NR4A3/Nor-1 (not Nr4A2/Nurr1) survived the statistical filtering. Although similar to the effects of MSH, the induction of Nur77 and Nor-1 mRNA after cAMP treatment was less striking. Similarly, Vdr was also significantly induced by cAMP treatment.
Table 2.
Analysis of mouse NR gene expression in 3T3-L1 adipocytes treated with 8-Br cAMP
| Detector | B value | t value | P value | Adjusted P value (FDR) | Linear RQ | Log10 RQ | Ct status |
|---|---|---|---|---|---|---|---|
| Ar-Mm00442688_m1 | −5.50815910969828 | −2.06127430689319 | 0.08006 | 0.23451 | 1.21734 | 0.08541 | Valid |
| Esr1-Mm00433149_m1 | −7.16414789581768 | 0.63706 | 0.54525 | 0.69985 | 0.33602 | −0.473629813834067 | No detection |
| Esr2-Mm00599819_m1 | −6.89807178228891 | 0.95731 | 0.37170 | 0.51395 | 0.35595 | −0.448607232279201 | No detection |
| Esrra-Mm00433143_m1 | −3.36143339759365 | −3.53756751220189 | 0.01023 | 0.05455 | 1.55960 | 0.19301 | Valid |
| Esrrb-Mm00442411_m1 | −6.90430427917529 | −0.95082824889651 | 0.37475 | 0.51395 | 2.55661 | 0.40766 | No detection |
| Esrrg-Mm00516267_m1 | −6.60152603856742 | 1.23657 | 0.25787 | 0.44207 | 0.01479 | −1.83010138686091 | No detection |
| Hnf4a-Mm00433964_m1 | −6.68937839287154 | −1.15871326825719 | 0.28624 | 0.45798 | 8.12679 | 0.90992 | No detection |
| Hnf4g-Mm00443563_m1 | −7.31435735063327 | −0.364596090821052 | 0.72666 | 0.85072 | 4.77107 | 0.67862 | No detection |
| Dax-Mm00431729_m1 | −7.35133976805405 | −0.259555666630404 | 0.80301 | 0.86184 | 2.42171 | 0.38412 | No detection |
| Shp-Mm00442278_m1 | −2.4278730568011 | −4.2264890643207 | 0.00432 | 0.02963 | 1.51736 | 0.18109 | No detection |
| Rev-erba-Mm00520708_m1 | −3.82501365643782 | −3.21134620267899 | 0.01577 | 0.06880 | 2.04760 | 0.31124 | Valid |
| Rev-erb-Mm00441730_m1 | −6.13037922426972 | −1.61433639488875 | 0.15245 | 0.31296 | 1.17608 | 0.07044 | Valid |
| Lxrb-Mm00437262 m1 | −4.16445516930638 | −2.97721453714941 | 0.02171 | 0.08683 | 1.61585 | 0.20840 | Valid |
| Lxra-Mm00443454_m1 | −4.45056120265712 | −2.7820187892694 | 0.02849 | 0.10519 | 1.89310 | 0.27717 | Valid |
| Fxra-Mm00436419_m1 | −7.32856213923481 | −0.3281362355285 | 0.75283 | 0.85294 | 4.34285 | 0.63777 | No detection |
| Fxrb-Mm01308716_m1 | −7.38903203164852 | 0.03464 | 0.97338 | 0.97338 | 0.98431 | −0.0068687547461857 | No detection |
| Pxr-Mm00803092_m1 | −6.65977958751272 | −1.18531466761614 | 0.27627 | 0.45727 | 1.94267 | 0.28840 | No detection |
| Car-Mm00437986_m1 | −6.04637542559818 | −1.677049098388 | 0.13940 | 0.30706 | 2.80196 | 0.44746 | No detection |
| Tr2-Mm00449123_m1 | −7.36808364421238 | −0.194664866121818 | 0.85143 | 0.87759 | 1.02214 | 0.00951 | valid |
| Tlx-Mm00455855_m1 | −7.20639983844706 | −0.572702160560403 | 0.58556 | 0.70267 | 9.75238 | 0.98911 | No detection |
| Pnr-Mm00443299_m1 | −6.02373694581711 | 1.69378 | 0.13610 | 0.30706 | 0.00196 | −2.70690643149241 | No detection |
| COUP-TF1-Mm00657937_m1 | −7.35328741921095 | −0.252851713322791 | 0.80797 | 0.86184 | 1.03747 | 0.01597 | Valid |
| COUP-TF2-Mm00772789_m1 | −2.74562517816694 | 3.98642 | 0.00579 | 0.03472 | 0.61922 | −0.208154019219964 | Valid |
| Ear2-Mm00438762_m1 | −6.82584930950438 | −1.03019381520536 | 0.33870 | 0.50583 | 9.25667 | 0.96645 | Valid |
| Gr-Mm00433832_m1 | −7.12140114605729 | 0.69677 | 0.50941 | 0.67922 | 0.87390 | −0.0585394236119403 | Valid |
| Mr-Mm01241595_m1 | −3.55486444776139 | −3.40040019457488 | 0.01225 | 0.05878 | 1.40592 | 0.14796 | Valid |
| Nur77-Mm00439358_m1 | 2.42773 | −9.12247662370858 | 0.00005 | 0.00082 | 20.36119 | 1.30880 | Valid |
| Nurr1-Mm00443056_m1 | −1.44142027891247 | −5.01700686577354 | 0.00175 | 0.01683 | 13.43164 | 1.12813 | Valid |
| Nor-1-Mm00450074_m1 | 5.28930 | −13.9160642456297 | 3.45733E-06 | 0.00008 | 48.30491 | 1.68399 | Valid |
| Sf-1-Mm00446826_m1 | −6.24872295010379 | 1.52411 | 0.17324 | 0.33185 | 0.24698 | −0.607346168148251 | Target not detected |
| Lrh-1-Mm00446088_m1 | −5.45657647907438 | −2.09701999724985 | 0.07602 | 0.23451 | 41.29905 | 1.61594 | No detection |
| Gcnf-Mm00599848_m1 | −6.15468486948772 | −1.59599612353876 | 0.15648 | 0.31296 | 1.23803 | 0.09273 | Valid |
| Pgr-Mm00435625_m1 | −6.74926847107076 | 1.10359 | 0.30786 | 0.47669 | 0.00702 | −2.1539605492309 | Target not detected |
| Ppara-Mm00440939_m1 | −7.17387235644548 | −0.622774614560883 | 0.55405 | 0.69985 | 2.90760 | 0.46353 | Calibrator not detected |
| Ppard-Mm00803186_g1 | −2.09474976017492 | −4.48532268747428 | 0.00318 | 0.02547 | 1.29866 | 0.11350 | Valid |
| Pparg-Mm00440945_m1 | −6.84659191386124 | −1.00966121064585 | 0.34776 | 0.50583 | 1.10077 | 0.04169 | Valid |
| Rara-Mm00436264_m1 | −6.5853537787917 | 1.25057 | 0.25304 | 0.44207 | 0.91555 | −0.0383181760003797 | Valid |
| Rarb-Mm01319676_m1 | −6.04522938763052 | −1.67789788368001 | 0.13923 | 0.30706 | 1.55085 | 0.19057 | Valid |
| Rarg-Mm00441083_m1 | −5.2501355189843 | 2.23897 | 0.06189 | 0.21219 | 0.62312 | −0.205428131010783 | Valid |
| Rora-Mm00443103_m1 | −0.496484443125155 | −5.8521001017043 | 0.00074 | 0.00890 | 1.74168 | 0.24097 | Valid |
| Rorb-Mm00524993_m1 | −7.33417192099774 | 0.31261 | 0.76409 | 0.85294 | 0.31798 | −0.497600401827364 | No detection |
| Rorc-Mm00441139_m1 | −7.19257362686531 | 0.59445 | 0.57175 | 0.70267 | 0.76215 | −0.117957620853958 | Valid |
| Rxra-Mm00441182_m1 | −6.28245060225431 | −1.49793456548665 | 0.17975 | 0.33185 | 1.10146 | 0.04197 | Valid |
| Rxrb-Mm00441193_m1 | −6.05537947610065 | −1.67037438314544 | 0.14074 | 0.30706 | 1.20127 | 0.07964 | Valid |
| Rxrg-Mm00436410_m1 | −5.60115826533221 | −1.99647435193074 | 0.08794 | 0.23451 | 46.89210 | 1.67110 | No detection |
| Thra-Mm00617505_m1 | −7.37034034396781 | −0.184205733984194 | 0.85931 | 0.87759 | 1.01527 | 0.00658 | Valid |
| Thrb-Mm00437044_m1 | −5.5595194952694 | 2.02555 | 0.08431 | 0.23451 | 0.14235 | −0.846640682768079 | Target not detected |
| Vdr-Mm00437297_m1 | 5.71306 | −14.8309173674091 | 2.28468E-06 | 0.00008 | 2.99596 | 0.47654 | Valid |
Table displays the P values, and adjusted P values of target genes before and after the application of FDR. Statistical analysis as detailed in Table 1. Bold indicates genes differentially expressed in a significant manner.
The Nr4a genes are rapidly and transiently induced after 30–60 min NDP-MSH treatment
To rigorously assess the temporal response of mRNAs encoding the Nr4a subgroup to NDP-MSH, 3T3-L1 adipocyte cells were differentiated until they acquired the adipocyte phenotype (assessed by oil-red O staining; data not shown) followed by treatment with NDP-MSH over a 15-min to 8-h time period. Expression of the mRNAs was monitored by qPCR. As observed above on NR TLDA analysis, the strongest NDP-MSH-mediated induction was the mRNA encoding Nor-1 (∼200-fold at 2 h after NDP-MSH treatment, normalized against 36b4). The maximal induction of Nur77 and Nurr1 (∼10- to 30-fold, respectively) was also observed at 2 h after NDP-MSH treatment. Induction of mRNA expression was observed within 15 min for Nur77 (Nr4a1) mRNA and within 60 min for Nurr1 and Nor-1 (Nr4a2 and Nr4a3, respectively). Moreover, all the mRNA transcripts encoding the Nr4a1–3 genes rapidly returned to basal levels within 4 and 8 h after NDP-MSH treatment. In summary, NDP-MSH treatment, strikingly, rapidly (15–60 min), and transiently induced the expression of the mRNAs encoding all three Nr4as (Fig. 2, A–C).
Fig. 2.
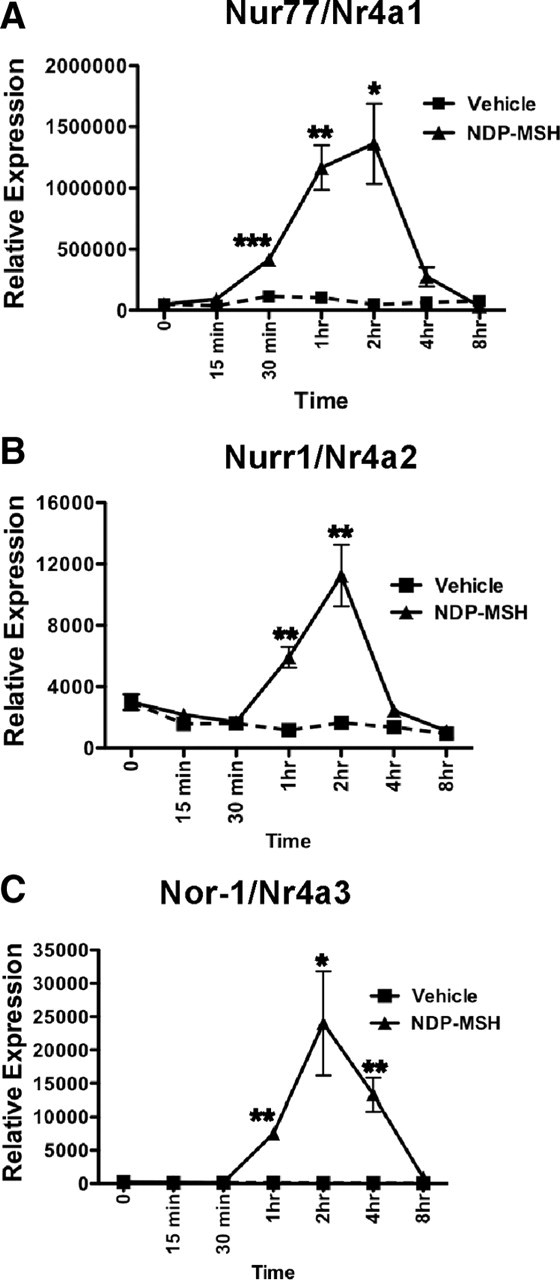
The Nr4a genes are rapidly and transiently induced after 30–60 min NDP-MSH treatment. Total RNA from 3T3-L1 adipocytes treated with 10 nm NDP-MSH from 15 min to 8 h were analyzed by qPCR for the expression of Nr4a1/Nur77 (A), Nr4a2/Nurr1 (B), and Nr4a3/Nor-1 (C). Results were normalized against 36b4 at each time point and expressed as mean ± sem (n = 3). Statistical significance was calculated using the Student's unpaired t test, where *, P < 0.05; **, P < 0.01; ***, P < 0.001.
The NUR77 protein is induced by NDP-MSH in differentiated 3T3-L1 adipocytes
To assess whether the induction of the mRNAs (encoding the Nr4a genes) translated to changes in protein expression, Western blot analysis was performed. Nuclear protein extracts were obtained from preadipocyte 3T3-L1 cells along with differentiated 3T3-L1 adipocytes after 0, 2, and 4 h treatments with vehicle (PBS/BSA) or NDP-MSH.
We identified an immunoreactive response for NUR77 expression relative to the nuclear loading control, TATA binding protein (TBP) in untreated cells 2 and 4 h after NDP-MSH in differentiated 3T3-L1 cells but not in preadipocytes (Fig. 3). We observed no change in immunoreactivity for NURR1 expression upon NDP-MSH treatment (data not shown). Furthermore, the availability of antibodies for NOR-1 at this time was not suitable for robust and reproducible Western analysis.
Fig. 3.

The NUR77 protein is induced by NDP-MSH in differentiated 3T3-L1 adipocytes. Western blot analysis of NUR77 and TBP in preadipocytes and adipocytes treated with vehicle (PBS) and 10 nm NDP-MSH for 2 and 4 h. Nuclear protein was extracted from the cells as described in Materials and Methods. Thirty micrograms of nuclear protein from cells were resolved.
The induction of the Nr4a subgroup by NDP-MSH is concomitant with the significant differential expression of genes involved in metabolism
In the context of α-MSH in the peripheral regulation of lipid, glucose, and energy homeostasis, we examined the effect of NDP-MSH treatment on metabolic gene expression. Vehicle and NDP-MSH (2 h)-treated 3T3-L1 differentiated adipocytes were analyzed on custom-designed TLDAs targeting 93 critical genes that are involved in (and control) lipid, glucose, and energy metabolism and incorporated several normalization controls, including 18S rRNA, 36b4, Gapdh, GusB, Hprt, and Arbp. FDR, coupled with the ranking with the B statistic, identified five significant changes in gene expression after conservative filtering of data for several genes implicated in metabolism normalized against the Genorm controls (18S rRNA, 36b4, and Gapdh). These included genes implicated in metabolic processes such as inflammation and lipid metabolism; IL-6 (Il-6), glucose metabolism; phosphoenolpyruvate carboxykinase 1 (Pck-1), pyruvate dehydrogenase kinase 4 (Pdk-4), prostaglandin synthase 2/cyclooxygenase 2 (Ptgs2/Cox2), and CCAAT/enhancer-binding protein-β (C/ebp-β) (Fig. 4A and Table 3). Table 3 lists many more genes with adjusted P < 0.05, after FDR, and differentially expressed in a significant manner (involved in lipid and glucose homeostasis). However, these genes had a negative B score because Bayes ranks the differentially expressed genes with P < 0.01 [Integromics (Granada, Spain) technical support, Panadero, J., personal communication].
Fig. 4.

Comparison of effects on the expression of genes involved in metabolic processes between NDP-MSH- and cAMP-treated adipocytes. 3T3-L1 adipocytes were treated with either 10 nm NDP-MSH or 1 mm 8-Br cAMP for 2 h. A, Graph showing relative quantification of metabolic genes in NDP-MSH-treated adipocytes (relative to vehicle, PBS). B, Graph showing relative quantification of metabolic genes of 8-Br cAMP-treated adipocytes (relative to vehicle, PBS). Data are derived from Tables 3 and 4, respectively, expressed as fold changes normalized to the mean of Genorm-selected controls (18S rRNA, Gapdh, and GusB). Statistical analysis was performed as detailed in Fig. 1 and in Materials and Methods.
Table 3.
Analysis of mouse metabolic gene expression in 3T3-L1 adipocytes treated with NDP-MSH
| Detector | B value | t value | P value | Adjusted P value (FDR) | Linear RQ | Log10 RQ | Ct status |
|---|---|---|---|---|---|---|---|
| Abca1-Mm00442646_m1 | −7.27570074547357 | 1.05356 | 0.33923 | 0.44865 | 0.83980 | −0.0758261111300267 | Valid |
| Abcg1-Mm00437390_m1 | −6.82380564029731 | 1.45031 | 0.20532 | 0.29013 | 0.86640 | −0.0622797613251481 | Valid |
| Acadm-Mm00431611_m1 | −5.42425918743045 | 2.51099 | 0.05262 | 0.11043 | 0.74318 | −0.128907733698776 | Valid |
| Acsl4-Mm00490331_m1 | −7.86711961853159 | −0.116300930841545 | 0.91184 | 0.92608 | 1.02701 | 0.01157 | Valid |
| Akt2-Mm00545827_m1 | −5.37606210054846 | 2.54696 | 0.05033 | 0.11043 | 0.60982 | −0.214801625794898 | Valid |
| Apoe-Mm00437573_m1 | −5.42524950676269 | 2.51025 | 0.05267 | 0.11043 | 0.80969 | −0.0916803575683298 | Valid |
| Cav1-Mm00483057_m1 | −6.49018146075984 | 1.71385 | 0.14583 | 0.23119 | 0.77509 | −0.110645247295161 | Valid |
| Cav3-Mm01182632_m1 | −7.84243423426412 | 0.23488 | 0.82341 | 0.87740 | 0.32846 | −0.483521068590945 | Valid |
| Cd36-Mm00432403_m1 | −5.59583051046963 | 2.38334 | 0.06170 | 0.12533 | 0.82062 | −0.0858604443188263 | Valid |
| Cebpa-Mm00514283_s1 | −7.7722294963989 | −0.418873446254798 | 0.69230 | 0.77585 | 1.09387 | 0.03897 | Valid |
| Cebpb-Mm00843434_s1 | 0.65933 | −8.94204065039986 | 0.00026 | 0.00335 | 2.09523 | 0.32123 | Valid |
| Cebpd-Mm00786711_s1 | −7.86068754697112 | 0.15603 | 0.88198 | 0.92465 | 0.94920 | −0.0226441452293905 | Valid |
| Cox5a-Mm00432638_m1 | −4.39610301250635 | 3.29953 | 0.02073 | 0.07093 | 0.78247 | −0.106531170687753 | Valid |
| Cpt1b-Mm00487200_m1 | −7.38764155524402 | 0.94119 | 0.38885 | 0.47689 | 0.79065 | −0.102015720752793 | Valid |
| Cpt2-Mm00487202_m1 | −3.36423414156762 | 4.16470 | 0.00834 | 0.03189 | 0.67695 | −0.169446439781525 | Valid |
| Cs-Mm00466043_m1 | −6.005817498354 | 2.07909 | 0.09084 | 0.16870 | 0.71472 | −0.145865756787847 | Valid |
| Fabp4-Mm00445880_m1 | −7.37245852747716 | 0.95695 | 0.38155 | 0.47689 | 0.91729 | −0.0374949583488132 | Valid |
| Fasn-Mm00662319_m1 | −2.20027191613071 | 5.27582 | 0.00303 | 0.01791 | 0.55214 | −0.257949258506736 | Valid |
| Foxo1-Mm00490672_m1 | −7.31008243947882 | 1.01993 | 0.35349 | 0.45053 | 0.83921 | −0.076127141125691 | Valid |
| Gys1-Mm00472712_m1 | −6.22698294888562 | 1.91381 | 0.11245 | 0.19235 | 0.67382 | −0.171453306419285 | Valid |
| Hif1a-Mm00468875_m1 | −7.81212279072606 | −0.326746985613668 | 0.75679 | 0.83375 | 1.02677 | 0.01147 | Valid |
| Hk2-Mm00443385_m1 | −7.66526536852216 | −0.603429832318206 | 0.57195 | 0.66387 | 1.14481 | 0.05873 | Valid |
| Il6-Mm00446190_m1 | 0.75508 | −9.095579743778 | 0.00024 | 0.00335 | 5.77883 | 0.76184 | Valid |
| Insr-Mm00439693_m1 | −5.2315109317577 | 2.65524 | 0.04407 | 0.11043 | 0.79615 | −0.0990054207961538 | Valid |
| Irs1-Mm00439720_s1 | −4.91149933409588 | 2.89772 | 0.03294 | 0.09398 | 0.84936 | −0.0709092878675154 | Valid |
| Lep-Mm00434759_m1 | −7.05689010206662 | −1.25404886457099 | 0.26402 | 0.36513 | 1.38522 | 0.14152 | Valid |
| Lepr-Mm00440181_m1 | −7.19973427849448 | 1.12555 | 0.31032 | 0.42022 | 0.10943 | −0.960854298382132 | Valid |
| Lipe-Mm00495359_m1 | −0.981165175224435 | 6.64671 | 0.00106 | 0.00860 | 0.68307 | −0.165533049837893 | Valid |
| Lpin1-Mm00550511_m1 | −7.29012162119624 | −1.03954237168589 | 0.34512 | 0.44865 | 1.08106 | 0.03385 | Valid |
| Lpl-Mm00434764_m1 | −3.27343373949192 | 4.24564 | 0.00770 | 0.03130 | 0.74887 | −0.125596403746472 | Valid |
| Ndufa5-Mm00471676_g1 | −5.85515327216234 | 2.19099 | 0.07871 | 0.15503 | 0.78719 | −0.103922244058665 | Valid |
| Ndufb5-Mm00452592_m1 | −5.33108511005886 | 2.58058 | 0.04829 | 0.11043 | 0.75268 | −0.123388850444936 | Valid |
| Npy-Mm00445771_m1 | −7.47182022954594 | −0.850059038036528 | 0.43322 | 0.51199 | 42.23726 | 1.62570 | Valid |
| Npy2r-Mm01956783_s1 | −6.40970549209452 | −1.77551759126077 | 0.13458 | 0.21870 | 1.40780 | 0.14854 | Valid |
| Pck1-Mm00440636_m1 | 3.42708 | −14.5798042878768 | 0.00002 | 0.00074 | 5.28332 | 0.72291 | Valid |
| Pdk1-Mm00554306_m1 | −2.03606996345871 | 5.44683 | 0.00263 | 0.01709 | 0.59246 | −0.227344542280898 | Valid |
| Pdk2-Mm00446681_m1 | −3.63381953315276 | 3.92935 | 0.01056 | 0.03815 | 0.63792 | −0.19523467607674 | Valid |
| Pdk3-Mm00455220_m1 | −6.20574800517979 | 1.92976 | 0.11015 | 0.19235 | 0.72923 | −0.137135886913592 | Valid |
| Pdk4-Mm00443325_m1 | 2.01954 | −11.3726813856132 | 0.00008 | 0.00171 | 2.59628 | 0.41435 | Valid |
| Pfkm-Mm00445461_m1 | −6.1713180653542 | 1.95558 | 0.10653 | 0.19235 | 0.75025 | −0.124793657091368 | Valid |
| Pnpla2-Mm00503040_m1 | −3.12134126930238 | 4.38322 | 0.00675 | 0.02923 | 0.64772 | −0.188612016172131 | Valid |
| Ppargc1a-Mm00447183_m1 | −6.27897749572296 | −1.87466450180387 | 0.11831 | 0.19719 | 1.31748 | 0.11974 | Valid |
| Ppargc1b-Mm00504720_m1 | −2.88406524116243 | −4.6030786876865 | 0.00549 | 0.02547 | 1.37947 | 0.13971 | Valid |
| Ptgs2-Mm00478374_m1 | 0.43497 | −8.59158033764606 | 0.00031 | 0.00338 | 5.10689 | 0.70816 | Valid |
| Pygm-Mm00478582_m1 | −6.56969069433489 | 1.65233 | 0.15799 | 0.24450 | 0.75199 | −0.123790223772489 | Valid |
| Rab18-Mm00441057_m1 | −6.68724133206513 | 1.56004 | 0.17812 | 0.26313 | 0.80857 | −0.0922824175596581 | Valid |
| Retn-Mm00445641_m1 | −2.85602538248978 | 4.62950 | 0.00535 | 0.02547 | 0.68055 | −0.167138543148101 | Valid |
| Rock1-Mm00485745_m1 | −7.43850817776515 | 0.88694 | 0.41481 | 0.49931 | 0.87364 | −0.0586674013771801 | Valid |
| Rock2-Mm00485761_m1 | −7.73161657107397 | −0.496300232853125 | 0.64025 | 0.73011 | 1.13376 | 0.05452 | Valid |
| Scd1-Mm00772290_m1 | −4.92220154241346 | 2.88953 | 0.03326 | 0.09398 | 0.72520 | −0.139544126878903 | Valid |
| Scd2-Mm00485951_g1 | −0.80611290013729 | 6.86458 | 0.00091 | 0.00845 | 0.56309 | −0.249420075296256 | Valid |
| Slc2a2-Mm00446224_m1 | −6.71920501062666 | 1.53463 | 0.18409 | 0.26591 | 0.00803 | −2.09543635203968 | Valid |
| Slc2a4-Mm00436615_m1 | −5.34032309258773 | 2.57367 | 0.04870 | 0.11043 | 0.60574 | −0.21771158241965 | Valid |
| Slc2a8-Mm00444634_m1 | −5.0247953539966 | 2.81136 | 0.03650 | 0.09885 | 0.66240 | −0.178878712978997 | Valid |
| Socs3-Mm00545913_s1 | −7.86633233490374 | −0.121855621550162 | 0.90765 | 0.92608 | 1.00960 | 0.00415 | Valid |
| Srebf1-Mm00550338_m1 | −1.6250135810549 | 5.89266 | 0.00184 | 0.01332 | 0.59948 | −0.22222703235461 | Valid |
| Stat3-Mm00456961_m1 | −4.85967303649837 | 2.93743 | 0.03143 | 0.09398 | 0.81138 | −0.0907772675813385 | Valid |
| Stat5b-Mm00839889_m1 | −2.60569999996316 | 4.86962 | 0.00431 | 0.02333 | 0.69533 | −0.157806613282517 | Valid |
| Ucp1-Mm00494069_m1 | 9.14953 | −45.86660894569 | 6.77314E-08 | 4.40254E-06 | 3025.82138 | 3.48084 | Calibrator not detected |
| Ucp2-Mm00495907_g1 | −4.84322557838101 | 2.95006 | 0.03096 | 0.09398 | 0.81589 | −0.0883690276160257 | Valid |
| Ucp3-Mm00494074_m1 | −5.30949498813775 | −2.59674255152187 | 0.04734 | 0.11043 | 1.57110 | 0.19620 | Valid |
Table displays the P values, and adjusted P values of target genes before and after the application of FDR. Relative quantification (RQ) linear and log10 were normalized against the mean of the Genorm selected controls 18S rRNA, Gapdh, and 36b4. Statistical analysis is as detailed in Table 1. Bold indicates genes differentially expressed in a significant manner.
Our analysis focused on the subset of genes that survived stringent statistical filtering and displayed very high odds of differential expression. We rigorously assessed the temporal response of mRNAs encoding the genes identified above after NDP-MSH treatment. 3T3-L1 adipocyte cells were treated with 10 nm NDP-MSH over a 15-min to 8-h time period, and expression of the mRNAs was monitored by qPCR. Interestingly, we observed maximal induction of Il-6, Ptgs2/Cox2, Pck-1, and Pdk4 after 1, 2, and 4 h (respectively), after NDP-MSH treatment (Fig. 5). In addition, the increase in IL-6 mRNA expression translated to a significant induction of secreted IL-6 measured by ELISA (Fig. 5E).
Fig. 5.

The NDP-MSH induction of the Nr4a subgroup is concomitant with significant differential expression genes involved in metabolism. Total RNA from 3T3-L1 adipocytes treated with 10 nM NDP-MSH from 15 min to 8 h were analyzed by qPCR for the expression of Il6 (A), Cox2/Ptgs2 (B), Pck1 (C), and Pdk4 (D). Results were normalized against 36b4 at each time point and expressed as mean ± sem (n = 3). E, IL-6 secretion to medium (pictograms per milliliter). Medium from 3T3-L1 adipocytes treated for 2 h with 10 nm NDP-MSH and/or vehicle was collected and measured. Results are mean ± sem of three independent experiments performed in quadruplet. Statistical significance was calculated using the Student's unpaired t test, where *, P < 0.05; **, P < 0.01; ***, P < 0.001.
Subsequently we compared and contrasted the effects of NDP-MSH and cAMP treatment on metabolic gene expression and induction in 3T3-L1 adipocytes. There were distinct differences, and some overlap in the pattern of differential expression of metabolic genes (after NDP-MSH and cAMP treatment, Fig. 4B vs. Fig. 4A and Table 3 vs. Table 4). After application of stringent empirical Bayes B statistic and FDR analysis to assign and rank significance, only C/ebpβ, Pck1, and PGC-1α and -β survived the statistical filtering. Similarly, after the application of FDR analysis (without the B score filtering based on P < 0.01), additional genes are identified, and this subset of differentially expressed genes induced by 8-bromoadenosine cAMP (8-Br cAMP) (Fig. 4B and Table 4) are clearly different to the subset induced by NDP-MSH. In summary, this underscores the importance of examining both signaling compounds and that the NDP-MSH-mediated induction of gene expression involves cAMP and cAMP-independent signaling.
Table 4.
Analysis of mouse metabolic gene expression in 3T3-L1 adipocytes treated with 8-Br cAMP
| Detector | B value | t value | P value | Adjusted P value (FDR) | Linear RQ | Log10 RQ | Ct status |
|---|---|---|---|---|---|---|---|
| Abca1-Mm00442646_m1 | −6.47203270416448 | −0.983136965483622 | 0.35911 | 0.58168 | 1.05340 | 0.02260 | Valid |
| Abcg1-Mm00437390_m1 | −6.94866431433544 | −0.255521028063199 | 0.80585 | 0.89376 | 1.04779 | 0.02028 | Valid |
| Acadm-Mm00431611_m1 | −6.95730730202809 | −0.223512091415063 | 0.82968 | 0.90376 | 1.02976 | 0.01274 | Valid |
| Acsl4-Mm00490331_m1 | −2.99892919267858 | −3.51728759197849 | 0.01018 | 0.05644 | 2.41953 | 0.38373 | Valid |
| Akt2-Mm00545827_m1 | −5.99484250094875 | −1.41007012605418 | 0.20244 | 0.41631 | 1.23313 | 0.09101 | Valid |
| Apoe-Mm00437573_m1 | −5.9960202210425 | −1.40911893801009 | 0.20271 | 0.41631 | 1.21792 | 0.08562 | Valid |
| Cav1-Mm00483057_m1 | −6.4253521928257 | −1.03004427920842 | 0.33811 | 0.57291 | 31.77646 | 1.50211 | Valid |
| Cav3-Mm01182632_m1 | −6.58672998372099 | −0.859854864267424 | 0.41905 | 0.60862 | 40.62194 | 1.60876 | No detection |
| Cd36-Mm00432403_m1 | −6.00486578483379 | −1.40196357076678 | 0.20474 | 0.41631 | 1.12745 | 0.05210 | Valid |
| Cebpa-Mm00514283_s1 | −5.30471603316879 | −1.92631942576746 | 0.09652 | 0.26762 | 1.39442 | 0.14439 | Valid |
| Cebpb-Mm00843434_s1 | 0.77510 | −6.75103121847619 | 0.00030 | 0.00603 | 2.02460 | 0.30634 | Valid |
| Cebpd-Mm00786711_s1 | −3.65958645529927 | −3.05428013704486 | 0.01906 | 0.08200 | 1.56833 | 0.19544 | Valid |
| Cox5a-Mm00432638_m1 | −5.22622058282471 | − | 0.08903 | 0.26023 | 1.28389 | 0.10853 | Valid |
| Cpt1b-Mm00487200_m1 | −6.12619850864466 | 1.30163 | 0.23527 | 0.46294 | 0.10928 | −0.96145793125541 | Target not detected |
| Cpt2-Mm00487202_m1 | −6.51347921922502 | −0.940037726418302 | 0.37928 | 0.58586 | 1.09284 | 0.03856 | Valid |
| Cs-Mm00466043_m1 | −6.22855102872073 | 1.21326 | 0.26536 | 0.50584 | 0.91042 | −0.0407596072971188 | Valid |
| Fabp4-Mm00445880_m1 | −4.4826065167765 | −2.49285759987093 | 0.04228 | 0.13936 | 1.35951 | 0.13338 | Valid |
| Fasn-Mm00662319_m1 | −6.9701887124759 | −0.164829827780038 | 0.87385 | 0.93518 | 1.01482 | 0.00639 | Valid |
| Foxo1-Mm00490672_m1 | −5.68269700553692 | 1.65195 | 0.14364 | 0.35048 | 0.83745 | −0.0770421500450454 | Valid |
| Gys1-Mm00472712_m1 | −5.65091641789539 | −1.67564891864883 | 0.13883 | 0.35048 | 1.15577 | 0.06287 | Valid |
| Hif1a-Mm00468875_m1 | −0.529115798487438 | −5.48088372472817 | 0.00101 | 0.01025 | 1.59144 | 0.20179 | Valid |
| Hk2-Mm00443385_m1 | −0.132955099353836 | −5.84542007115945 | 0.00070 | 0.00849 | 2.17440 | 0.33734 | Valid |
| Il6-Mm00446190_m1 | −6.52307398754988 | −0.929844051263675 | 0.38417 | 0.58586 | 4.11340 | 0.61420 | Valid |
| Insr-Mm00439693_m1 | −5.7412347069987 | −1.60791890248564 | 0.15300 | 0.35896 | 1.16573 | 0.06660 | Valid |
| Irs1-Mm00439720_s1 | −5.60423389368891 | −1.71021227014467 | 0.13208 | 0.35030 | 1.14670 | 0.05945 | Valid |
| Lep-Mm00434759_m1 | −6.47892150309319 | 0.97607 | 0.36236 | 0.58168 | 0.88855 | −0.0513194155804653 | Valid |
| Lepr-Mm00440181_m1 | −5.23233463895439 | −1.97738797918858 | 0.08959 | 0.26023 | 2.38960 | 0.37833 | No detection |
| Lipe-Mm00495359_m1 | −3.71816685794912 | −3.01393427787688 | 0.02016 | 0.08200 | 1.31521 | 0.11900 | Valid |
| Lpin1-Mm00550511_m1 | −1.80312364585439 | −4.41121255918593 | 0.00331 | 0.02526 | 1.78729 | 0.25220 | Valid |
| Lpl-Mm00434764_m1 | −4.50941649424105 | −2.47464242692057 | 0.04341 | 0.13936 | 1.22113 | 0.08676 | Valid |
| Ndufa5-Mm00471676_g1 | −4.04833801951533 | −2.78799300323631 | 0.02770 | 0.10243 | 1.23020 | 0.08997 | Valid |
| Ndufb5-Mm00452592_m1 | −6.55152761517444 | −0.899090279456486 | 0.39922 | 0.59396 | 1.11127 | 0.04582 | Valid |
| Npy-Mm00445771_m1 | −6.98517697252056 | −0.0273625061673953 | 0.97895 | 0.98896 | 1.11408 | 0.04691 | No detection |
| Npy2r-Mm01956783_s1 | −6.60884715447981 | 0.83445 | 0.43227 | 0.60866 | 0.03293 | −1.48243364236616 | Target not detected |
| Pck1-Mm00440636_m1 | 1.79158 | −7.90330823645043 | 0.00011 | 0.00603 | 3.73391 | 0.57216 | Valid |
| Pdk1-Mm00554306_m1 | −6.71401786122737 | −0.70357736013987 | 0.50499 | 0.66966 | 1.05464 | 0.02311 | Valid |
| Pdk2-Mm00446681_m1 | −2.68222632945434 | −3.74592162059326 | 0.00755 | 0.04996 | 1.39402 | 0.14427 | Valid |
| Pdk3-Mm00455220_m1 | −6.85057901261473 | −0.491669112042786 | 0.63837 | 0.81127 | 1.03864 | 0.01647 | Valid |
| Pdk4-Mm00443325_m1 | −2.76858195305639 | −3.6830748059515 | 0.00819 | 0.04996 | 1.45149 | 0.16182 | Valid |
| Pfkm-Mm00445461_m1 | −6.31725965485071 | −1.13319036867258 | 0.29538 | 0.52994 | 11.56542 | 1.06316 | Valid |
| Pnpla2-Mm00503040_m1 | −6.9842209070256 | −0.0493042992031737 | 0.96209 | 0.98896 | 1.01255 | 0.00541 | Valid |
| Ppargc1a-Mm00447183_m1 | 0.81440 | −6.79266553187554 | 0.00029 | 0.00603 | 1.71710 | 0.23480 | Valid |
| Ppargc1b-Mm00504720_m1 | 0.29347 | −6.25776701118953 | 0.00047 | 0.00711 | 2.31327 | 0.36423 | Valid |
| Ptgs2-Mm00478374_m1 | −6.887285384296 | −0.418544035436358 | 0.68841 | 0.83964 | 2.25203 | 0.35257 | Valid |
| Pygm-Mm00478582_m1 | −6.78200615886998 | −0.606462579597974 | 0.56383 | 0.73178 | 1.12981 | 0.05300 | Valid |
| Rab18-Mm00441057_m1 | −6.29048302233768 | −1.15774464650995 | 0.28588 | 0.52845 | 8.89780 | 0.94928 | Valid |
| Retn-Mm00445641_m1 | −3.3695485144151 | −3.25555636819725 | 0.01446 | 0.06785 | 1.38660 | 0.14195 | Valid |
| Rock1-Mm00485745_m1 | −6.98548553682099 | −0.0143483063672784 | 0.98896 | 0.98896 | 1.00123 | 0.00053 | Valid |
| Rock2-Mm00485761_m1 | −3.26541588310136 | −3.32853000857313 | 0.01310 | 0.06658 | 1.32339 | 0.12169 | Valid |
| Scd1-Mm00772290_m1 | −6.90752779559935 | −0.372484398662658 | 0.72083 | 0.83964 | 1.03855 | 0.01643 | Valid |
| Scd2-Mm00485951_g1 | −6.87819738040745 | −0.437720434408795 | 0.67511 | 0.83964 | 1.04912 | 0.02082 | Valid |
| Slc2a2-Mm00446224_m1 | −6.93605143481426 | −0.821666151576023 | 0.43903 | 0.60866 | 21.59963 | 1.33445 | Calibrator not detected |
| Slc2a4-Mm00436615_m1 | 0.29619 | 0.77590 | 0.87647 | 0.96984 | −0.0133017511643106 | Valid | |
| Slc2a8-Mm00444634_m1 | −5.93755681705318 | −1.45593067223172 | 0.18983 | 0.41631 | 1.11031 | 0.04544 | Valid |
| Socs3-Mm00545913_s1 | −6.98087310901216 | 0.09124 | 0.92992 | 0.97802 | 0.99436 | −0.00245751920288478 | Valid |
| Srebf1-Mm00550338_m1 | −6.90082006732795 | 0.38833 | 0.70961 | 0.83964 | 0.95199 | −0.0213659988995519 | Valid |
| Stat3-Mm00456961_m1 | −6.91250683871165 | −0.360294547303217 | 0.72952 | 0.83964 | 1.09045 | 0.03761 | Valid |
| Stat5b-Mm00839889_m1 | −6.38906309223622 | 1.06546 | 0.32291 | 0.56279 | 0.89213 | −0.0495705205996298 | Valid |
| Ucp1-Mm00494069_m1 | −6.71353806416891 | 0.70422 | 0.50461 | 0.66966 | 0.02429 | −1.61448796705966 | No detection |
| Ucp2-Mm00495907_g1 | −1.30242634524268 | −4.81470379568001 | 0.00208 | 0.01809 | 1.49891 | 0.17577 | Valid |
| Ucp3-Mm00494074_m1 | −4.0794328594065 | −2.76681380479372 | 0.02854 | 0.10243 | 1.29796 | 0.11326 | Valid |
Table displays the P values, and adjusted P values of target genes, before and after the application of FDR. Relative quantification (RQ) linear and log10 were normalized against the mean of the Genorm selected controls 18S rRNA, Gapdh, and 36b4. Statistical analysis as detailed in Table 1. Bold indicates genes differentially expressed in a significant manner.
Nur77 siRNA expression significantly attenuates Nur77 expression
Nur77 mRNA expression has been shown to be induced during the early phase of 3T3-L1 cell differentiation (28, 29). Therefore, to identify the effect of attenuating Nur77 expression on Nr4a gene expression, we transiently transfected and expressed a siRNA (30 nm) targeting Nur77 (relative to a negative control siRNA) in 3T3-L1 cells and induced to differentiate for 2 h. Expression of the Nur77 siRNA (but not the negative control) significantly and preferentially attenuated Nur77 mRNA expression (∼5-fold; Fig. 6). Although the Nur77 siRNA did not repress Nurr1 mRNA expression, we observed an approximately 2.5 fold attenuation of Nor-1 (Fig. 6).
Fig. 6.

Nur77 siRNA expression significantly attenuates Nur77 expression. 3T3-L1 cells were transfected with 30 nm Nur77 siRNA or negative siRNA (control) for 48 h and differentiated for a further 1 h. qPCR was used to assay the expression of Nur77/Nr4a1, Nurr1/Nr4a2, and Nor-1/Nr4a3. Results were normalized against 36b4 and expressed as mean ± sem (n = 3). Statistical significance was calculated using the Student's unpaired t test, where **, P < 0.01 and ***, P < 0.001.
Stable Nur77 siRNA expression significantly attenuates the NDP-MSH-mediated induction of Nur77: Il6, Cox2, and Pck-1 induction are dependent on activation of Nur77 expression
We next examined NDP-MSH-mediated induction of the Nr4a subgroup and subsequent Il-6, Cox2, Pdk-4, and Pck-1 gene expression in stable 3T3-L1 cells expressing a previously characterized Nur77 siRNA (10, 11) cloned into the pSilencer 3.1 vector. The Nur77 siRNA and negative control-transfected 3T3-L1 cells, were isolated as polyclonal pools (to avoid clonal variation) after 8–10 d of G418 selection. NDP-MSH-mediated induction of Nur77 mRNA was completely ablated in the Nur77 siRNA but not the negative control siRNA transfected/expressing cells (Fig. 7A). In contrast, Nurr1 and Nor-1 remained significantly induced by NDP-MSH in the negative control stable cells; however, the siRNA targeting Nur77 attenuated the NDP-MSH induction of Nurr1 but not Nor-1 (Fig. 7, B and C).
Fig. 7.
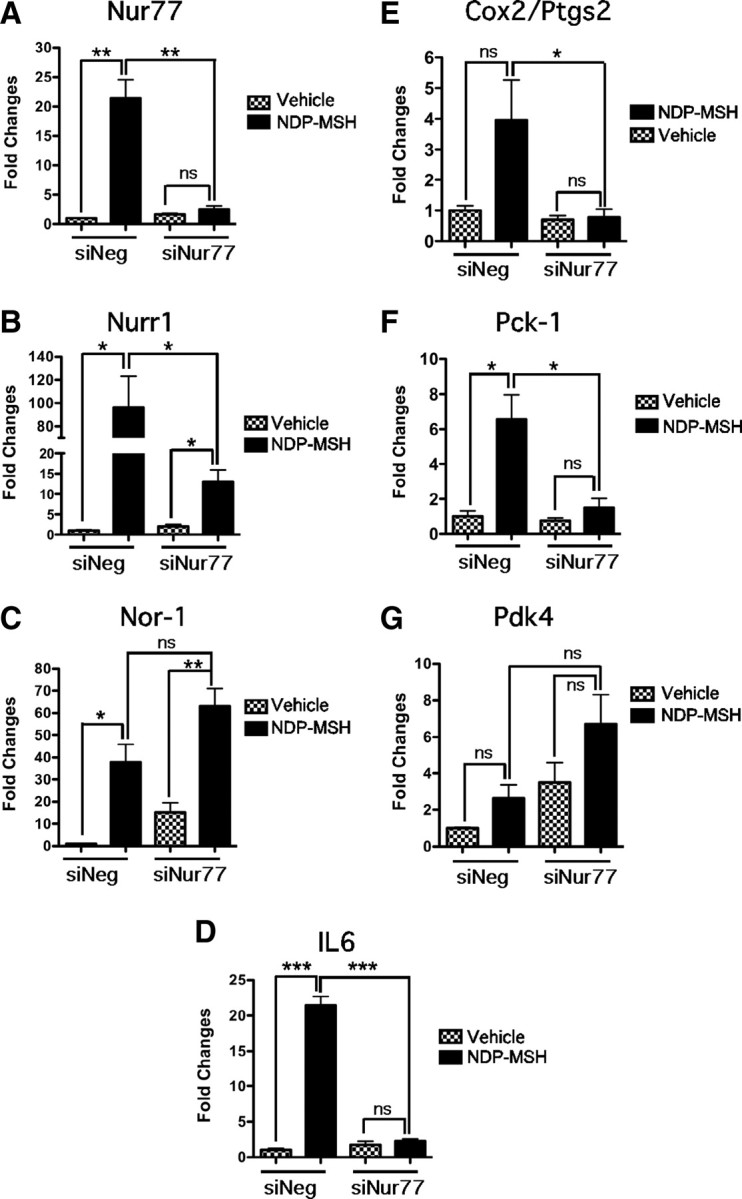
Nur77 siRNA stable expression significantly attenuates the NDP-MSH-mediated induction of Nr4a subgroup and metabolic genes. 3T3-L1 Nur77 siRNA (siNur77) and negative siRNA (siNeg) stable cells were differentiated and treated with 10 nm NDP-MSH or vehicle for 2 h. qPCR was used to assay the expression of Nur77/Nr4a1 (A), Nurr1/Nr4a2 (B), Nor-1/Nr4a3 (C), Il6 (D), Cox2/Ptgs2 (E), Pck1 (F), and Pdk4 (G). Results were normalized against 36b4 and expressed as fold changes (n = 3). Statistical significance was calculated using the Student's unpaired t test, where *, P < 0.05; **, P < 0.01; ***, P < 0.001.
Importantly, the stable expression of the Nur77 siRNA in 3T3-L1 cells inhibited the NDP-MSH mediated induction of several metabolic genes including Il-6, Pck-1, and Cox2/Ptgs2 (Fig. 7, D–F). Although NDP-MSH induced the expression of the Pdk-4 transcript in the negative control stable cells, this induction was not significant (Fig. 7G). Moreover, there was no attenuation of the Pdk-4 transcript (in the presence of NDP-MSH) in the cells expressing the Nur77 siRNA (Fig. 7G). In summary, this demonstrated that the NDP-MSH-mediated induction of these important metabolic genes is dependent on the concomitant induction and expression of Nur77.
The MSH-inducible genes identified in this study have all been linked to different aspects of glucose homeostasis and in particular increased Il-6 expression (mRNA and protein) has been demonstrated to enhance glucose transport in 3T3-L1 cells and adipose tissue (30, 31). Moreover, MSH has been demonstrated to induce glucose uptake in hypothalamic cells in the presence of insulin (32). Consequently, we transiently transfected 3T3-L1 cells with siRNA-negative (negative control) and siRNA-Nur77 and grew the cells to confluence. Differentiation medium (which includes insulin) was added with either NDP-MSH or vehicle for 2 h. To examine the effect of siRNA expression, glucose uptake was measured (during the peak of Nur77 expression). We observed that NDP-MSH significantly (P < 0.01) induced glucose uptake (∼1.4 fold). Interestingly, we observed nonsignificant (20%) increase in the basal (vehicle mediated) glucose uptake in the siRNA Nur77-transfected cells [normalized against the siRNA-negative (negative control) transfected cells]; however, transfection of the siRNA-Nur77-attenuated NDP-MSH stimulated glucose uptake (Fig. 8).
Fig. 8.

Effect of Nur77 siRNA on glucose uptake in 3T3-L1 by NDP-MSH. 3T3-L1 transfected with Nur77 siRNA (siNur77) and control (siNeg) for 48 h, followed by 2 h treatment with 10 nm NDP-MSH or vehicle in adipocyte differentiation media. Glucose uptake was measured. Data are expressed as fold changes of 2-deoxyglucose uptake ± se from four independent experiments performed in triplicate. Statistical significance was calculated using the Student's unpaired t test, where *, P < 0.05.
In vivo (ip) administration of NDP-MSH induces expression of the mRNAs encoding Nur77, Il6, Cox2, Pck1, and Pdk4 in (inguinal) adipose tissue
We went on to examine whether NDP-MSH administration induced similar changes in vivo. Seven-week-old C57 BL/6J (male) mice were ip injected with saline (n = 7) and NDP-MSH [1 mg/kg (n = 8)]. Inguinal adipose tissue was collected 4 h after ip injection, RNA was isolated, and qPCR was used to measure the expression of the mRNAs encoding Nur77, IL6, Cox2, Pck1, and Pdk4. We observed that the mRNA encoding Nur77 was very significantly (P < 0.001) induced after 4 h NDP-MSH treatment, relative to saline treatment (Fig. 9). We further examined the expression of the mRNAs encoding Il6, Cox2, Pck1, and Pdk4. We observed 2- to 5-fold increases in the expression of these mRNAs; however, only the approximately 2-fold increase Pck1 mRNA expression attained significance. This suggests that NDP-MSH administration recapitulates similar changes in vivo.
Fig. 9.

NDP-MSH induces Nur77, Il6, Cox2, Pck1, and Pdk4 gene expressions in mouse adipose tissue. Mice were ip injected with vehicle (saline) or 1 mg/kg of NDP-MSH and inguinal adipose tissue collected after 4 h. qPCR was used to assay the mRNA levels, and results were normalized against 36b4 and expressed as fold changes (n = 7–8). Statistical significance was calculated using the Mann-Whitney U test, where *, P < 0.05 and ***, P < 0.001.
Discussion
α-MSHs are important anorectic signaling molecules derived from proopiomelanocortin (POMC), expressed in the hypothalamus, pituitary, skin, and hair follicle. The complexity of melanocortin signaling involves tissue-specific expression of melanocortin receptors and cell specific posttranslational processing of POMC. This complexity drives additional research to elucidate the peripheral actions of α-MSH, which are coordinated, and act in concert with the central nervous system-mediated pathways that control satiety and energy expenditure. Further study of the peripheral action of melanocortins will provide insights into the signaling network controlling feeding, energy expenditure, and body mass (Refs. 15, 26, and 33–35 and references therein).
In this context our study highlights the specific and selective activation of one subgroup of NRs by NDP-MSH in adipocytes. The rapid, striking, and selective nature of this cross talk between Nr4a and MSH signaling is underscored by the observation that other members of the entire NR superfamily of ligand/hormone-dependent DNA binding proteins are refractory to the MSH treatment. Interestingly, this NDP-MSH-mediated activation was associated with the parallel (Nur77 dependent) induction of the mRNAs encoding Il6, Cox2, and Pck1. These data suggest that specific cross talk between Nur77 and MSH play an essential role in the modulation of these metabolic target genes. However, we cannot comment on whether there are primary or secondary targets of Nur77 signaling in 3T3-L1 cells.
The observations from these studies are also consistent with an emerging role and an increasing number of reports that have implicated the Nr4as and MSH action in peripheral tissues in the context of insulin signaling, glucose disposal, oxidative metabolism, adiposity, fatty acid oxidation, leptin expression, etc. For example, the Nur77 orphan nuclear receptor has been demonstrated to regulate Glut4 (mRNA and protein) expression in skeletal muscle (in vitro and in vivo) (10, 11, 36). Moreover, insulin-resistant mouse and rat models, and attenuated expression of genes involved in glucose consumption, are associated with reduced expression of Nur77 and Nor-1 in both skeletal muscle and adipose tissue (7, 10, 36). Furthermore, insulin and thiazolidinedione-peroxisomal proliferator-activated receptor-γ agonists in 3T3-L1 adipocytes markedly induce both Nur77 and Nor-1, and similarly, Nor-1 siRNA expression impairs the insulin-stimulated glucose transport and Akt phosphorylation in adipocytes (6, 7). Finally, Nur77 expression in hepatic tissue activates gluconeogenesis (9).
These roles of the Nr4a subgroup overlap with the emerging role of NDP-MSH in the regulation of lipid metabolism, adiposity, insulin signaling, and glucose metabolism and are in concordance with the associated changes in gene expression observed in these studies (16, 35, 37). For example, the concomitant (Nur77 dependent) induction of the mRNAs encoding IL-6 (Il6), Cox2, and Pck1 are implicated in a number of metabolic functions including insulin signaling, glucose disposal, inducible prostanoid biosynthesis, body fat regulation, adipogenesis, glyceroneogenesis, oxidative metabolism, diabetes, and obesity.
Specifically, Il6 enhances insulin-mediated signaling (in a TNF independent manner) (38), insulin-stimulated glucose disposal, glucose absorption, and lipid oxidation via AMPK-dependent mechanisms (31) and have been implicated in the development of insulin resistance. Moreover, aberrant Il6 expression and function have been shown to increase the risk of obesity. Furthermore, Catania et al. (39) reported iv injections of NDP-MSH in rodent cardiac tissue induced early increases in IL 6 (Il6) mRNA, coupled to increases in Nur77. This is consistent in our study that demonstrated an increase in IL-6 secretion by the 3T3-L1 cells when treated with NDP-MSH.
Another target metabolic gene Cox2, an inducible cyclooxygenase isoform catalyzes an important step in prostanoid synthesis (40). Interestingly, heterozygous (Cox2+/−) lines of mice display increased fat pad sizes, increased body weight, increased serum leptin, and susceptibility to obesity relative to the homozygous Cox2−/− mice. These studies are consistent with a putative role for Cox2 in the regulation of adiposity and body mass (41).
Pck-1 is implicated in glyceroneogenesis, impacting on both the storage and the regulated release of fatty acids via a triglyceride-fatty acid cycle in adipose tissue (42, 43). Moreover, the rate of lipid release is a balance between lipolysis and esterification. Notwithstanding, dysfunctional adipogenic Pck1 expression leads to obesity (due to an increase in triglyceride storage) and insulin resistance (due to a decrease in triglyceride storage) in association with increased and decreased Pck1 activity, respectively (44). Previously Beale et al. (45) discussed a novel hypothesis suggesting that dysfunctional regulation of Pck1 in adipose would be a causal factor in type 2 diabetes and obesity. They argued that Pepck1/Pck1 synthesis is primarily controlled at the transcriptional level, and the promoter functions as a sensor for multiple dietary, nutritional, and signaling pathways. Furthermore, mutations that increase Pepck1/Pck1 activity would increase blood glucose, in association with compromised insulin-mediated control of hepatic gluconeogenesis. In contrast, mutations associated with impaired hepatic Pck1 expression have been discussed to induce hypoglycemia.
In the context of Pdk4, it has been suggested that the pyruvate dehydrogenase complex (attenuated by PDK4) functions as the metabolic switch operating between lipid and carbohydrate utilization, competing for the same substrate (pyruvate) as glyceroneogenesis in adipose tissue (46). In this study, although we clearly identified that NDP-MSH induces the expression of Pdk4, we could not demonstrate that this result was dependent on Nur77 expression. Notwithstanding, studies by Pearen et al. (6) demonstrated that β-adrenergic signaling in skeletal muscle concomitantly induced Nor-1 and Pdk4. These authors also identified that NOR-1 was recruited to the Pdk4 promoter, suggesting that perhaps this member of the Nr4a subgroup regulated Pdk4.
CCAAT/enhancer-binding protein-β came up as differentially expressed in a significant manner, after the 2 h NDP-MSH and cAMP treatment. However, the extent of induction was weak (<3-fold). However, when we examined the temporal response of this member of the CCAAT/enhancer-binding protein-β family of transcription factors to (15 min to 8 h) NDP-MSH treatment, we did not observe consistent and/or robust induction during the time course, in contrast to the other identified target genes (data not shown).
As discussed, the MSH signaling involves the induction of the cAMP signaling cascade; however, melanocortin signaling pathway also involves several other (cAMP independent) pathways including calcium, p38 MAPK, Ras-Raf-MAPK kinase-ERK, the human homolog of agouti, the agouti signaling protein, c-Jun N-terminal kinase, and AMPK (20, 27, 47). Our data indicated that NDP-MSH and cAMP treatment displayed some overlap in the differential expression profile (after treatment) in 3T3-L1 adipocytes. However, we observed distinct and unique effects of NDP-MSH (relative to cAMP) treatment both in the overall pattern of differential expression and the stringently filtered significant hits. For example, NDP-MSH treatment resulted in the very significant induction of Il6, Pck1, Pdk4, and Cox2. In contrast, cAMP treatment did not produce significant differential expression/induction of the mRNAs encoding Il6, Pdk4, and Cox2. This underscores the importance of examining both signaling compounds and that the NDP-MSH-mediated induction of gene expression involves cAMP and cAMP-independent signaling.
Finally, we demonstrated that ip administration of NDP-MSH (in C57 BL/6J male) mice increases the in vivo expression of the mRNAs encoding Nur77, Il6, Cox2, Pck1, and Pdk4 in (inguinal) adipose tissue. As discussed, this is consistent with the observation of Catania et al. (39) that showed iv injections of NDP-MSH in rodent cardiac tissue induced early increases in IL-6 (Il6) mRNA, and Jun et al. (47) demonstrated that tail vein injection of α-MSH induced IL-6 mRNA expression. This suggests that NDP-MSH administration recapitulates similar changes in vivo.
In conclusion, our study clearly demonstrates the cross talk between MSH signaling, Nr4a induction, and the subsequent concomitant regulation of metabolic gene expression. Moreover, we demonstrate that Nur77 mRNA expression is necessary for many aspects of MSH-dependent effects on the expression of metabolic genes (involved in glucose homeostasis). Furthermore, we conclude that α-MSH signaling preferentially targets the Nr4a subfamily because other members of the NR superfamily were refractory to the anorectic hormone. Accordingly, these studies provide novel information in the context of MSH signaling, Nr4a regulation, and subsequent metabolic profiling of target genes in the framework of adipocyte biology.
Materials and Methods
Cell culture
3T3-L1 cells (American Type Culture Collection, Manassas, VA) were cultured and maintained in DMEM medium supplemented with 10% heat-inactivated fetal bovine serum (FBS). Preadipocytes were induced to differentiate at 2 d after confluence in DMEM supplemented with 10% FBS, 0.1 μg/ml dexamethasone (Sigma, St Louis, MO), 4 μg/ml insulin (Sigma), and 115 μg/ml isobutylmethylxanthine (Sigma) for 3 d and then back to DMEM with 10% FBS in which the cells were maintained and refed every 2–3 d. Approximately 80–90% of cells displayed adipocyte phenotype. The 3T3-L1 adipocytes used were further treated with either vehicle (PBS) and a synthetic and more potent analog of α-MSH NDP-MSH or 8-Br cAMP.
Animal procedures
C57BL/6J male mice (7 wk old) were obtained from colony at The University of Queensland and housed in the Queensland Bioscience Precinct vivarium (University of Queensland, St. Lucia, Australia) with a 12 h light, 12-h dark cycle. Mice were injected with vehicle (saline) or 1 mg/kg NDP-MSH ip for 4 h and killed by cervical dislocation. Inguinal fat pads were taken out immediately afterward. Total RNA was extracted from inguinal fat pads using QIAzol reagent (QIAGEN, Clifton Hill, Victoria, Australia) according to the manufacturer's protocol. All aspects of the animal experimentation were approved by The University of Queensland Animal Ethics Committee.
RNA extraction and cDNA synthesis
Total RNA was extracted from 3T3-L1 cells using Tri-Reagent (Sigma) according to the manufacturer's protocol. After treatment with Turbo deoxyribonuclease I (Ambion, Austin, TX) for 30 min at 37 C, RNA was further purified through RNeasy column (QIAGEN). RNA was electrophoresed to determine the integrity of the preparation. Superscript III was used in the synthesis of cDNA from 2 μg of total RNA with random hexamers according to the manufacturer's instruction (Invitrogen, Carlsbad, CA). The cDNA was diluted to 300 μl in nuclease-free water.
Quantitative real-time PCR
qPCR was performed as previously described (1, 12). SYBR primers used are: 36b4 forward, 5′-AGATGCAGCAGATCCGCA-3′, reverse, 5′-GTTCTTGCCCATCAGCACC-3′; Nor-1 forward, 5′-GATCACAGAGCGACATGGGTTA-3′, reverse, 5′-GAGCCTGTCCCTTCCTCTGG-3′; Nur77 forward, 5′-TGATGTTCCCGCCTTTGC-3′, reverse, 5′-CAATGCGATTCTGCAGCTCTT-3′; Nurr1 forward, 5′-GCACTTCGGCGGAGTTG-3′, reverse, 5′-GGAATCCAGCCCGTCAGA-3′; Il6 forward, 5′-AGCCAGAGTCCTTCAGA-3′, reverse, 5′-GGTCCTTAGCCACTCCT-3′; Pdk4 forward, 5′-AAAGGACAGGATGGAAGGAATCA-3′, reverse, 5′-TTTTCCTCTGGGTTTGCACAT-3′; and Pck-1 forward, 5′-GGGAAATCACCGCATAGTCTCT-3′, reverse, 5′-TAACTGCTACAGCTAACGTGAAGAACT-3′. All SYBR primers were designed using Primer Express (Applied Biosystems, Foster City, CA). Commercially available TaqMan gene expression assays (Applied Biosystems) were used to assay expression of Pgts2/Cox2. Statistical analysis was performed on the average of three to four independent assays using unpaired Student's t tests.
TaqMan low-density array
cDNA synthesized from 3T3-L1 cells treated with NDP-MSH, 8-Br cAMP, or vehicle were loaded onto a custom-designed ABI microfluidic TLDAs to analyze the expression of genes involved in metabolism (lipid, carbohydrate, and energy homeostasis). Five internal control genes were used, including the mandatory control (18S rRNA) and four other controls: Gapdh, GusB, Hprt1, and 36b4/Arbp. These controls span the relative abundance/Ct range of the genes on the card, and three (18S rRNA, Gapdh, and 36b4) are validated real-time PCR controls from NURSA-supported nuclear receptor studies (29, 48). The Genorm software imbedded within the ABI/Integromics StatMiner version 4.1 software package was used to compute least expression variation and select the appropriate (and most stable) combination of internal control genes with which to normalize the expression data (against the mean of the most stable controls). However, data can also be normalized against a specific selected control of choice, for example, NURSA used controls. Briefly, significant changes in expression relative were analyzed using the ABI/Integromics StatMiner software package. Differentially expressed genes were identified by linear models (contained in the LIMMA package for Bioconductor R embedded in StatMiner).
Significance is assigned by the application of the empirical Bayes statistic, described as equivalent to shrinkage of the estimated sample variances toward a pooled estimate, resulting in far more stable inference when the number of arrays is small. It returns the empirical Bayes log odds of differential expression (i.e. the probability) that a gene is differentially expressed (a higher score represents a more significant result). For example, the B statistic of zero indicates a 50:50 chance of differential expression, B scores greater than 0 indicate greater than 50:50 chance of differential expression, B less than 0 (negative scores) reflect odds that a gene is more than likely, not differentially expressed. The B statistic considers and ranks a proportion of differentially expressed genes (P < 0.01). Analysis also includes t, the empirical Bayes moderated t statistic (a variant t test), an empirically moderated estimate of standard error (49, 50). Furthermore, we perform conservative data filtering (Benjamini-Hochberg) to control for FDR and correct/adjust the P values. The adjusted P values (after FDR), coupled to the B score, enable stringent refinement the subset of differentially expressed genes.
Relative quantification, i.e. the calculated fold differences [between the target (MSH or cAMP treated) and the calibrator/reference sample/tissue (vehicle treated)] are displayed as valid, when the Ct values of the gene in the target and calibrator/reference samples is less than 35 cycles. Moreover, fold differences are flagged as target not detected, calibrator not detected, and no detection when the Ct value of the gene(s) in the target, calibrator, and/or both tissues/samples are 35 cycles or greater, respectively (than the arbitrarily set threshold limit). Hence, the reported quantitative “fold change of a gene that is not expressed in some of the biological conditions may not be reliable” (50); however, it does reflect a qualitative difference. The data generated by the ABI SDS software from the ABI7900 instrument do not normally contain missing Ct values, and Ct values are assigned beyond the arbitrarily set threshold (Ct 35) up to a maximum Ct 40. In situations in which the sample is undetected and the Ct values are beyond the maximum Ct 40, the StatMiner software imputes a value, set to the maximum Ct.
Protein extraction and Western blotting
Nuclear protein was isolated as previously described (51) from 3T3-L1 adipocytes and concentration determined with BCA protein assay reagent (Pierce, Rockford, IL). Nuclear protein extracted were resolved on 10% SDS-PAGE gels and transferred to polyvinyl difluoride membranes (Milipore, Bedford, MA). The membranes were blocked for 1 h in Tris-buffered saline containing 0.5% Tween 20 and 5% skim milk, followed by an overnight incubation with either Nur77 or TBP antibodies (Santa Cruz Biotechnologies, Santa Cruz, CA). The membranes were further incubated with peroxidase-conjugated secondary antibody for 1 h at room temperature. After being washed with Tris-buffered saline containing 0.5% Tween 20 four times, the signals were detected with ECL Plus Western blotting detection system (GE Healthcare, Little Chalfont, Buckinghamshire, UK), and visualized by autoradiography.
Transfection and generation of siRNA-Nur77 stable cell line
Transient transfection of 3T3-L1 cells were performed in a six-well plate (∼70% confluence) with 30 nm Nur77 siRNA on target plus SMARTpool (Dharmacon, Lafayette, CO) or negative SMARTpool control (Dharmacon). Cells were transfected with Lipofectamine 2000 (Invitrogen) as described in the manufacturer's protocol. Twenty-four hours after transfection, the growth medium was replaced and cells grown for another day until confluent. Differentiation medium (as described above) were added and cells harvested after 1 h. For generation of 3T3-L1, stable cells were transfected with 4 μg of pSilencer 3.1 neomycin Nur77 (11) or 4 μg pSilencer 3.1 neomycin negative in 25-cm2 flasks at approximately 40% confluence using Lipofectamine 2000(Invitrogen). Twenty-four hours after transfection, cells were selected for neomycin resistance expression by treatment with 600 mg/ml G418 (Astral Scientific, Caringbah, Australia). G418-resistant cells were maintained in growth medium supplemented with 300 mg/ml G418. The pool of polyclonal cells selected were passaged into three replicates and differentiated into adipocytes and further treated with NDP-MSH or vehicle as described above. RNA was extracted from each replicate independently.
Measurement of secreted IL-6
Medium from differentiated 3T3-L1 adipocytes treated for 2 h with either NDP-MSH or vehicle was collected and analyzed for IL-6 using a mouse IL-6 ELISA kit (BD Biosciences, San Diego, CA) as per manufacturer's instruction.
Glucose uptake
3T3-L1 cells were transiently transfected with Nur77 siRNA or negative control in six-well plates as described above. NDP-MSH or vehicle was added onto the cells together with differentiation medium and assayed after 2 h. Assays were performed as described (52). Briefly, cells were washed twice with Krebs Ringer HEPES buffer (KRH; 121 mm NaCl; 4.9 mm KCl; 1.2 mm MgSO4; 0.33 mm CaCl2; 12 mm HEPES, pH 7.4) followed by 13 min incubation at 37 C with either insulin (100 nm) or carrier in 900 μl of KRH. One hundred microliters of working radioactive glucose cocktail, 3H-2-deoxy-d-glucose (final specific activity, 6.7 μCi; Amersham Biosciences, Piscataway, NJ) was added for an additional 15 min. Uptake was terminated with three quick ice-cold washes with KRH, and cells were lysed in 400 μl of 0.1% sodium dodecyl sulfate in KRH. Radioactivity was determined by liquid scintillation counting.
Acknowledgments
Address all correspondence and requests for reprints to: George E. O. Muscat, M.D., Institute for Molecular Bioscience, The University of Queensland, St. Lucia, Queensland 4072, Australia. E-mail: g.muscat@imb.uq.edu.au.
This work was supported by a research project grant from the National Health and Medical Research Council (NHMRC) of Australia. G.E.O.M. is a principal research fellow of the NHMRC.
Disclosure Summary: The authors have nothing to disclose.
S.-C.M.W. and S.M. jointly contributed to the experiments and analysis of the data in this work.
- AMPK
- AMP-activated protein kinase
- 8-Br cAMP
- 8-bromoadenosine cAMP
- Ct
- cycle threshold
- FBS
- fetal bovine serum
- FDR
- false discovery rate
- KRH
- Krebs Ringer HEPES buffer
- NDP
- Nle4, d-Phe7
- NR
- nuclear hormone receptor
- NURSA
- nuclear receptor signaling atlas
- POMC
- proopiomelanocortin
- qPCR
- quantitative real-time PCR
- siRNA
- small interfering RNA
- TBP
- TATA binding protein
- TLDA
- TaqMan low-density array.
References
- 1. Myers SA , Eriksson N , Burow R , Wang SC , Muscat GE. 2009. β-Adrenergic signaling regulates NR4A nuclear receptor and metabolic gene expression in multiple tissues. Mol Cell Endocrinol 309:101–108 [DOI] [PubMed] [Google Scholar]
- 2. Maxwell MA , Muscat GE. 2006. The NR4A subgroup: immediate early response genes with pleiotropic physiological roles. Nucl Recept Signal 4:e002. [DOI] [PMC free article] [PubMed] [Google Scholar]
- 3. Pols TW , Bonta PI , de Vries CJ. 2007. NR4A nuclear orphan receptors: protective in vascular disease? Curr Opin Lipidol 18:515–520 [DOI] [PubMed] [Google Scholar]
- 4. Bonta PI , Pols TW , de Vries CJ. 2007. NR4A nuclear receptors in atherosclerosis and vein-graft disease. Trends Cardiovasc Med 17:105–111 [DOI] [PubMed] [Google Scholar]
- 5. Li QX , Ke N , Sundaram R , Wong-Staal F. 2006. NR4A1, 2, 3—an orphan nuclear hormone receptor family involved in cell apoptosis and carcinogenesis. Histol Histopathol 21:533–540 [DOI] [PubMed] [Google Scholar]
- 6. Pearen MA , Myers SA , Raichur S , Ryall JG , Lynch GS , Muscat GE. 2008. The orphan nuclear receptor, NOR-1, a target of β-adrenergic signaling, regulates gene expression that controls oxidative metabolism in skeletal muscle. Endocrinology 149:2853–2865 [DOI] [PubMed] [Google Scholar]
- 7. Fu Y , Luo L , Luo N , Zhu X , Garvey WT. 2007. NR4A orphan nuclear receptors modulate insulin action and the glucose transport system: potential role in insulin resistance. J Biol Chem 282:31525–31533 [DOI] [PubMed] [Google Scholar]
- 8. Kumar N , Wang H , Liu D , Collins S. 2009. Liver X receptor is a regulator of orphan nuclear receptor NOR-1 gene transcription in adipocytes. Int J Obes (Lond) 33:519–524 [DOI] [PubMed] [Google Scholar]
- 9. Pei L , Waki H , Vaitheesvaran B , Wilpitz DC , Kurland IJ , Tontonoz P. 2006. NR4A orphan nuclear receptors are transcriptional regulators of hepatic glucose metabolism. Nat Med 12:1048–1055 [DOI] [PubMed] [Google Scholar]
- 10. Chao LC , Zhang Z , Pei L , Saito T , Tontonoz P , Pilch PF. 2007. Nur77 coordinately regulates expression of genes linked to glucose metabolism in skeletal muscle. Mol Endocrinol 21:2152–2163 [DOI] [PMC free article] [PubMed] [Google Scholar]
- 11. Maxwell MA , Cleasby ME , Harding A , Stark A , Cooney GJ , Muscat GE. 2005. Nur77 regulates lipolysis in skeletal muscle cells. Evidence for cross-talk between the β-adrenergic and an orphan nuclear hormone receptor pathway. J Biol Chem 280:12573–12584 [DOI] [PubMed] [Google Scholar]
- 12. Pearen MA , Ryall JG , Maxwell MA , Ohkura N , Lynch GS , Muscat GE. 2006. The orphan nuclear receptor, NOR-1, is a target of β-adrenergic signaling in skeletal muscle. Endocrinology 147:5217–5227 [DOI] [PubMed] [Google Scholar]
- 13. Kumar N , Liu D , Wang H , Robidoux J , Collins S. 2008. Orphan nuclear receptor NOR-1 enhances cAMP-dependent uncoupling protein-1 gene transcription. Mol Endocrinol (Baltimore, Md) 22:1057–1064 [DOI] [PMC free article] [PubMed] [Google Scholar]
- 14. Smith AG , Luk N , Newton RA , Roberts DW , Sturm RA , Muscat GE. 2008. Melanocortin-1 receptor signaling markedly induces the expression of the NR4A nuclear receptor subgroup in melanocytic cells. J Biol Chem 283:12564–12570 [DOI] [PubMed] [Google Scholar]
- 15. Norman D , Isidori AM , Frajese V , Caprio M , Chew SL , Grossman AB , Clark AJ , Michael Besser G , Fabbri A. 2003. ACTH and α-MSH inhibit leptin expression and secretion in 3T3-L1 adipocytes: model for a central-peripheral melanocortin-leptin pathway. Mol Cell Endocrinol 200:99–109 [DOI] [PubMed] [Google Scholar]
- 16. Lee M , Kim A , Chua SC , Obici S , Wardlaw SL. 2007. Transgenic MSH overexpression attenuates the metabolic effects of a high-fat diet. Am J Physiol Endocrinol Metab 293:E121–E131 [DOI] [PubMed] [Google Scholar]
- 17. Irani BG , Haskell-Luevano C. 2005. Feeding effects of melanocortin ligands—a historical perspective. Peptides 26:1788–1799 [DOI] [PubMed] [Google Scholar]
- 18. Pierroz DD , Ziotopoulou M , Ungsunan L , Moschos S , Flier JS , Mantzoros CS. 2002. Effects of acute and chronic administration of the melanocortin agonist MTII in mice with diet-induced obesity. Diabetes 51:1337–1345 [DOI] [PubMed] [Google Scholar]
- 19. Yaswen L , Diehl N , Brennan MB , Hochgeschwender U. 1999. Obesity in the mouse model of pro-opiomelanocortin deficiency responds to peripheral melanocortin. Nat Med 5:1066–1070 [DOI] [PubMed] [Google Scholar]
- 20. Cho KJ , Shim JH , Cho MC , Choe YK , Hong JT , Moon DC , Kim JW , Yoon DY. 2005. Signaling pathways implicated in α-melanocyte stimulating hormone-induced lipolysis in 3T3-L1 adipocytes. J Cell Biochem 96:869–878 [DOI] [PubMed] [Google Scholar]
- 21. Bradley RL , Mansfield JP , Maratos-Flier E. 2005. Neuropeptides, including neuropeptide Y and melanocortins, mediate lipolysis in murine adipocytes. Obes Res 13:653–661 [DOI] [PubMed] [Google Scholar]
- 22. Newton RA , Smit SE , Barnes CC , Pedley J , Parsons PG , Sturm RA. 2005. Activation of the cAMP pathway by variant human MC1R alleles expressed in HEK and in melanoma cells. Peptides 26:1818–1824 [DOI] [PubMed] [Google Scholar]
- 23. Haskell-Luevano C , Nikiforovich G , Sharma SD , Yang YK , Dickinson C , Hruby VJ , Gantz I. 1997. Biological and conformational examination of stereochemical modifications using the template melanotropin peptide, Ac-Nle-c[Asp-His-Phe-Arg-Trp-Ala-Lys]-NH2, on human melanocortin receptors. J Med Chem 40:1738–1748 [DOI] [PubMed] [Google Scholar]
- 24. Yang X , Lamia KA , Evans RM. 2007. Nuclear receptors, metabolism, and the circadian clock. Cold Spring Harb Symp Quant Biol 72:387–394 [DOI] [PubMed] [Google Scholar]
- 25. Barish GD , Downes M , Alaynick WA , Yu RT , Ocampo CB , Bookout AL , Mangelsdorf DJ , Evans RM. 2005. A nuclear receptor atlas: macrophage activation. Mol Endocrinol 19:2466–2477 [DOI] [PubMed] [Google Scholar]
- 26. Boston BA. 1999. The role of melanocortins in adipocyte function. Ann NY Acad Sci 885:75–84 [DOI] [PubMed] [Google Scholar]
- 27. Beaumont KA , Liu YY , Sturm RA. 2009. Chapter 4 The melanocortin-1 receptor gene polymorphism and association with human skin cancer. Prog Mol Biol Transl Sci 88C:85–153 [DOI] [PubMed] [Google Scholar]
- 28. Fumoto T , Yamaguchi T , Hirose F , Osumi T. 2007. Orphan nuclear receptor Nur77 accelerates the initial phase of adipocyte differentiation in 3T3-L1 cells by promoting mitotic clonal expansion. J Biochem 141:181–192 [DOI] [PubMed] [Google Scholar]
- 29. Fu M , Sun T , Bookout AL , Downes M , Yu RT , Evans RM , Mangelsdorf DJ. 2005. A nuclear receptor atlas: 3T3-L1 adipogenesis. Mol Endocrinol 19:2437–2450 [DOI] [PubMed] [Google Scholar]
- 30. Stouthard JM , Oude Elferink RP , Sauerwein HP. 1996. Interleukin-6 enhances glucose transport in 3T3-L1 adipocytes. Biochem Biophys Res Commun 220:241–245 [DOI] [PubMed] [Google Scholar]
- 31. Carey AL , Steinberg GR , Macaulay SL , Thomas WG , Holmes AG , Ramm G , Prelovsek O , Hohnen-Behrens C , Watt MJ , James DE , Kemp BE , Pedersen BK , Febbraio MA. 2006. Interleukin-6 increases insulin-stimulated glucose disposal in humans and glucose uptake and fatty acid oxidation in vitro via AMP-activated protein kinase. Diabetes 55:2688–2697 [DOI] [PubMed] [Google Scholar]
- 32. Chai B , Li JY , Zhang W , Wang H , Mulholland MW. 2009. Melanocortin-4 receptor activation inhibits c-Jun N-terminal kinase activity and promotes insulin signaling. Peptides 30:1098–1104 [DOI] [PMC free article] [PubMed] [Google Scholar]
- 33. Cone RD. 2005. Anatomy and regulation of the central melanocortin system. Nat Neurosci 8:571–578 [DOI] [PubMed] [Google Scholar]
- 34. Shimizu H , Inoue K , Mori M. 2007. The leptin-dependent and -independent melanocortin signaling system: regulation of feeding and energy expenditure. J Endocrinol 193:1–9 [DOI] [PubMed] [Google Scholar]
- 35. Nogueiras R , Wiedmer P , Perez-Tilve D , Veyrat-Durebex C , Keogh JM , Sutton GM , Pfluger PT , Castaneda TR , Neschen S , Hofmann SM , Howles PN , Morgan DA , Benoit SC , Szanto I , Schrott B , Schürmann A , Joost HG , Hammond C , Hui DY , Woods SC , Rahmouni K , Butler AA , Farooqi IS , O'Rahilly S , Rohner-Jeanrenaud F , Tschöp MH. 2007. The central melanocortin system directly controls peripheral lipid metabolism. J Clin Invest 117:3475–3488 [DOI] [PMC free article] [PubMed] [Google Scholar]
- 36. Chao LC , Wroblewski K , Zhang Z , Pei L , Vergnes L , Ilkayeva OR , Ding SY , Reue K , Watt MJ , Newgard CB , Pilch PF , Hevener AL , Tontonoz P. 2009. Insulin resistance and altered systemic glucose metabolism in mice lacking Nur77. Diabetes 58:2788–2796 [DOI] [PMC free article] [PubMed] [Google Scholar]
- 37. Obici S , Feng Z , Tan J , Liu L , Karkanias G , Rossetti L. 2001. Central melanocortin receptors regulate insulin action. J Clin Invest 108:1079–1085 [DOI] [PMC free article] [PubMed] [Google Scholar]
- 38. Yuen DY , Dwyer RM , Matthews VB , Zhang L , Drew BG , Neill B , Kingwell BA , Clark MG , Rattigan S , Febbraio MA. 2009. Interleukin-6 attenuates insulin-mediated increases in endothelial cell signaling but augments skeletal muscle insulin action via differential effects on tumor necrosis factor-α expression. Diabetes 58:1086–1095 [DOI] [PMC free article] [PubMed] [Google Scholar]
- 39. Catania A , Lonati C , Sordi A , Leonardi P , Carlin A , Gatti S. 2010. The peptide NDP-MSH induces phenotype changes in the heart that resemble ischemic preconditioning. Peptides 31:116–122 [DOI] [PubMed] [Google Scholar]
- 40. Smith WL , Langenbach R. 2001. Why there are two cyclooxygenase isozymes. J Clin Invest 107:1491–1495 [DOI] [PMC free article] [PubMed] [Google Scholar]
- 41. Fain JN , Ballou LR , Bahouth SW. 2001. Obesity is induced in mice heterozygous for cyclooxygenase-2. Prostaglandins Other Lipid Mediat 65:199–209 [DOI] [PubMed] [Google Scholar]
- 42. Tontonoz P , Hu E , Devine J , Beale EG , Spiegelman BM. 1995. PPAR gamma 2 regulates adipose expression of the phosphoenolpyruvate carboxykinase gene. Mol Cell Biol 15:351–357 [DOI] [PMC free article] [PubMed] [Google Scholar]
- 43. Antras-Ferry J , Robin P , Robin D , Forest C. 1995. Fatty acids and fibrates are potent inducers of transcription of the phosphenolpyruvate carboxykinase gene in adipocytes. Eur J Biochem 234:390–396 [DOI] [PubMed] [Google Scholar]
- 44. Franckhauser S , Muñoz S , Elias I , Ferre T , Bosch F. 2006. Adipose overexpression of phosphoenolpyruvate carboxykinase leads to high susceptibility to diet-induced insulin resistance and obesity. Diabetes 55:273–280 [DOI] [PubMed] [Google Scholar]
- 45. Beale EG , Hammer RE , Antoine B , Forest C. 2004. Dysregulated glyceroneogenesis: PCK1 as a candidate diabetes and obesity gene. Trends Endocrinol Metab 15:129–135 [DOI] [PubMed] [Google Scholar]
- 46. Cadoudal T , Distel E , Durant S , Fouque F , Blouin JM , Collinet M , Bortoli S , Forest C , Benelli C. 2008. Pyruvate dehydrogenase kinase 4: regulation by thiazolidinediones and implication in glyceroneogenesis in adipose tissue. Diabetes 57:2272–2279 [DOI] [PMC free article] [PubMed] [Google Scholar]
- 47. Jun DJ , Na KY , Kim W , Kwak D , Kwon EJ , Yoon JH , Yea K , Lee H , Kim J , Suh PG , Ryu SH , Kim KT. 2010. Melanocortins induce interleukin 6 gene expression and secretion through melanocortin receptors 2 and 5 in 3T3-L1 adipocytes. J Mol Endocrinol 44:225–236 [DOI] [PMC free article] [PubMed] [Google Scholar]
- 48. Yang X , Downes M , Yu RT , Bookout AL , He W , Straume M , Mangelsdorf DJ , Evans RM. 2006. Nuclear receptor expression links the circadian clock to metabolism. Cell 126:801–810 [DOI] [PubMed] [Google Scholar]
- 49. Smyth GK. 2004. Linear models and empirical Bayes methods for assessing differential expression in microarray experiments. Stat Appl Genet Mol Biol 3:Article 3 [DOI] [PubMed] [Google Scholar]
- 50. Goni R , Garcia P , Foissac S. 2009. The qPCR data statistical analysis. In: Integromics white paper: Integromics SL; 1–9 [Google Scholar]
- 51. Chen SL , Wang SC , Hosking B , Muscat GE. 2001. Subcellular localization of the steroid receptor coactivators (SRCs) and MEF2 in muscle and rhabdomyosarcoma cells. Mol Endocrinol 15:783–796 [DOI] [PubMed] [Google Scholar]
- 52. Shi J , Kandror KV. 2008. Study of glucose uptake in adipose cells. Methods Mol Biol 456:307–315 [DOI] [PubMed] [Google Scholar]