

Abstract
Androgen signaling through the androgen receptor (AR), a ligand-dependent transcription factor within the steroid receptor superfamily, plays an important role in the development and maintenance of many tissues. In muscle, androgens act as anabolic agents that increase both muscle mass and strength; however, a key unanswered question is the mechanism through which AR-mediated gene expression leads to these effects. To gain further insight into the mechanism of AR action in muscle, we identified AR-binding sites in primary human muscle cells using ChIP-on-Chip (chromatin immunoprecipitation coupled with tiling microarray detection of genomic fragments). Through this analysis, we identified 32,518 potential AR-binding sites throughout the genome that were enriched upon androgen treatment. Sequence analysis of these regions indicated that approximately 90% possess a consensus androgen response element or half-site. Among the identified AR-binding sites are genes known to be directly regulated by AR, confirming the validity of our methodology. Additionally, we identified a number of novel AR targets, including genes and micro-RNAs implicated in muscle differentiation and function, suggesting a direct role for AR-mediated transcription in muscle development. Intriguingly, binding sequences for the Mef2 family of transcription factors were enriched in the AR-bound regions, and we show that several Mef2c-dependent genes are direct targets of AR, suggesting a functional interaction between Mef2c and AR in skeletal muscle. Our results provide new insights into the mechanisms by which androgens promote muscle growth and validate AR as a potential therapeutic target for sarcopenia, muscle wasting, and other androgen-related muscle disorders.
This work reports the results of a genome-wide screen for androgen receptor (AR) binding sites in human muscle cells, thus identifying targets of AR action.
Androgen signaling via the androgen receptor (AR) is important in the development and maintenance of secondary sexual organs, muscle, and bone. In muscle, androgens are known to have an anabolic effect, increasing both muscle mass and strength. Androgens induce hypertrophy in both type I and type II muscle fibers, with concomitant increases in satellite cell number and myonuclear accretion (1, 2). Additionally, it is proposed that androgens promote the differentiation of mesenchymal multipotent cells into the myogenic lineage while inhibiting adipogenesis (3). Thus, androgens are implicated in the activation and differentiation of muscle precursor cells; however, the precise mechanisms by which androgens produce these effects remain unclear.
AR is a member of the steroid receptor superfamily of transcription factors that is activated by binding of the steroid ligands testosterone or 5α-dihydrotestosterone (DHT). Upon ligand binding, AR translocates to the nucleus and binds as a dimer to androgen response elements (AREs) located within DNA to regulate transcription. AREs typically consist of two 6-bp half-sites arranged as either direct or inverted repeats, separated by a 3-bp spacer (3). The variability in sequence among confirmed AR-binding sites complicates the prediction of functional AREs using computational approaches. Additionally, AR can be recruited to genes lacking functional AREs via interactions with other transcription factors bound to their specific response elements (4, 5, 6). Thus, comprehensive identification of direct AR targets requires approaches that can measure AR binding across the entire genome.
Recently, a number of cistrome analyses have identified novel targets of AR in prostate cancer cells, suggesting potential mechanisms of action for AR in cancer progression (7, 8, 9, 10, 11, 12). These studies not only identified novel AR-binding sites within the genome but also revealed functional and physical interactions between AR and other transcription factors, suggesting cooperative regulation of gene expression. To date, no such studies have been performed to explore the role of AR in muscle. Based on the specific structural and functional requirements of muscle, it is likely that AR interacts with a specific set of genes and/or factors in muscle compared with prostate. Here we describe the identification of novel AR targets in primary human skeletal muscle myoblasts (HSMMs) using chromatin immunoprecipitation (ChIP) coupled with tiling microarray detection of genomic fragments (ChIP-on-Chip). Validation of targets with known roles in muscle implicates AR-mediated gene expression in a diversity of pathways leading to muscle development and suggests a functional interplay between AR and other transcriptional activators in muscle. Our study provides a valuable data set for investigation of the cellular mechanisms leading to androgen-mediated muscle growth and suggests a number of pathways that could be used as therapeutic targets for androgen-related muscle disorders.
Results
Genome-wide map of AR-binding sites in skeletal muscle myoblasts
To identify AR-binding sites in muscle in an unbiased, genome-wide manner, we performed ChIP-on-Chip for endogenous AR in primary HSMMs generated from a young, adult male (Lonza, Basel, Switzerland). These cells express high levels of AR and are capable of proliferating or differentiating into multinucleated myotubes under different growth conditions, making them an optimal, physiologically relevant system for this study. Several AR antibodies, including some previously reported to be suitable for ChIP (8, 9, 10, 12), were compared by ChIP-quantitative PCR (qPCR) at previously characterized AREs associated with the AR and prostate-specific antigen (PSA) genes (13, 14) (Fig. 1A). One antibody (sc-13062) gave the strongest signal at the AR gene specifically in the presence of DHT, but not at a negative control region. Supporting the idea that the AR may bind to and regulate gene expression in a tissue-specific manner, AR binding was not detected at the PSA enhancer, which contains an ARE but is not expressed in muscle. This antibody was used for the ChIP-on-Chip experiment. Vehicle and DHT-treated HSMMs were subjected to AR ChIP, followed by hybridization to Affymetrix whole genome tiling arrays. Enriched binding sites were identified by analysis with TAS (Affymetrix) and Microarray Analysis Tool (MAT) (15) tiling array algorithms, using a threshold cutoff of 1.83% false discovery rate. This analysis identified 4155 and 32,518 active regions for AR binding in mock- and DHT-treated HSMMs, respectively, which were absent in a control IgG ChIP. Comparison of the sequences from the AR active regions among various vertebrate genomes revealed a high level of conservation within the active regions but not in surrounding regions (Fig. 1B). We then mapped the AR active regions using the cis-regulatory element annotation system (CEAS; Fig. 1C). CEAS analysis indicated that the majority of the AR active regions resided in intergenic regions (55.23%) or within introns (36.30%), with only 0.93% located at proximal promoter regions. When normalized for the average length of exon and intron sequences (16), the proportion found at proximal promoter regions was significantly higher (Supplemental Fig. 1 published on The Endocrine Society’s Journals online web site at http://mend.endojournals.org). This distribution of AR-binding sites along the genome is consistent with what has been observed in other AR cistrome analyses (7, 8, 10, 12). Scanning the active regions by TRANSFAC motif analysis identified potential full-length AREs within 21015 (64%) of the 32,804 total active regions; inclusion of ARE half-sites in the analysis increases the total number of ARE-containing active regions to 29,518 (90%). The ARE matrix created by the strongest binding sites (sites with top peak intensity value ≥ 16.0, 200 total) is shown and in general is in good agreement with previously defined consensus AREs (Fig. 1D). To validate the results of the ChIP-on-Chip experiment, 10 active regions and a negative control region were analyzed by ChIP-qPCR with the AR antibody. All active regions examined were bound by AR specifically in the presence of DHT, whereas no AR binding was observed at the negative control region (Fig. 1E). Thus, the active regions identified in the ChIP-on-Chip study are highly predictive of true sites of AR binding within the genome.
Fig. 1.
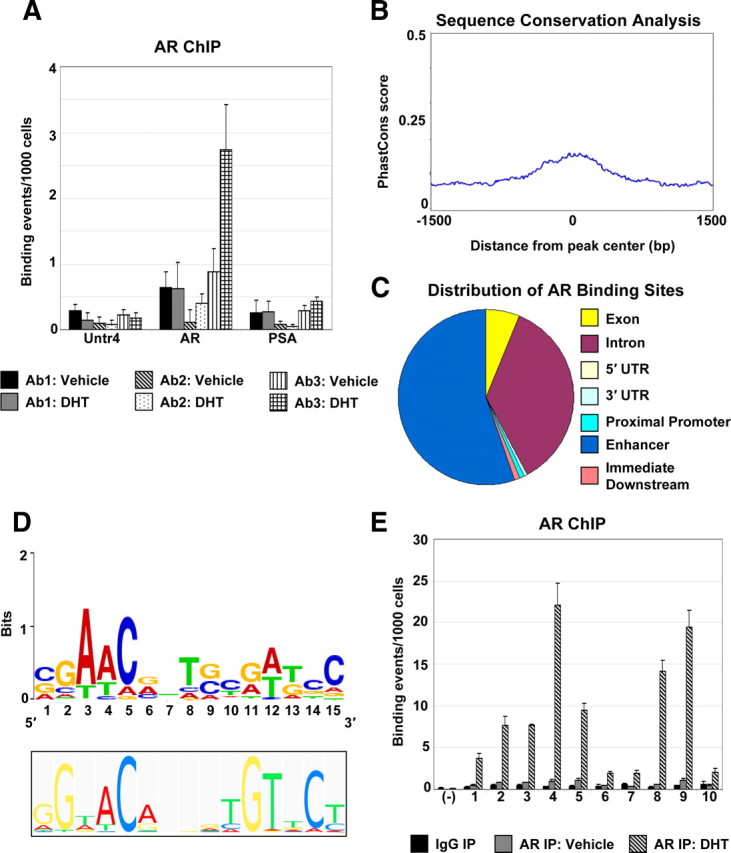
Identification of AR-binding sites in skeletal muscle by ChIP-on-Chip. A, Proliferating HSMMs treated with 30 nm DHT or an equal volume of DMSO (Vehicle) were subjected to ChIP with three different AR antibodies [Ab1: AR C-19 (Santa Cruz Biotechnology, Inc.); Ab2: AR N-20 (Santa Cruz Biotechnology, Inc.); Ab3: AR H-280 (Santa Cruz Biotechnology, Inc.)]. AR binding was assayed at an ARE located within the AR gene (AR) (13 ) and at the PSA enhancer (PSA) (14 ). A gene-deficient region on chromosome 4 (Untr4) served as a negative control. Data are represented as binding events per 1000 cells. B, Sequence conservation analysis. The top 3000 AR ChIP-on-Chip active regions (highest DHT/IgG peak ratio) were aligned at their centers and uniformly expanded to 3000 bp in each direction, and phastCons scores were retrieved (http://genome.ucsc.edu) and averaged at each position. C, AR-binding regions were mapped relative to their nearest RefSeq genes using CEAS (46 ). Proximal promoter was defined as less than or equal to 1 kb upstream from the transcription start site. When the AR-binding region is within a gene, it is further categorized as within the 5′-untranslated region (UTR), 3′-UTR, a coding exon, or an intron. Immediate downstream is defined as less than or equal to 1 kb downstream from RefSeq 3′-end. Enhancers are defined as more than 1 kb from a RefSeq gene. D, SeqLogos of TRANSFAC AR-binding motif matrix M00953, a consensus generated from AREs identified from several species (lower panel) and de novo generated AR-binding motif from top AR ChIP-binding sites. E, Validation of AR active regions by ChIP-qPCR. Proliferating HSMMs treated with 30 nm DHT or DMSO (Vehicle) were subjected to ChIP-qPCR with the AR H-280 antibody. AR binding was assayed at 10 ARE-containing active regions from the ChIP-on-Chip experiment (1: Active Region 11238; 2: 25959; 3: 32435; 4: 22758; 5: 13474; 6: 27146; 7: 24325; 8: 10716; 9: 24702; 10: 32316). Negative control (−) is a gene-deficient region on chromosome 4 (Untr4). Data are represented as described in panel A. IP, Immunoprecipitation.
Among the active regions containing a predicted ARE sequence are a number of genes previously shown to be bound and regulated by AR, including FBXO32, MYC, SMARCC1, ACTA1, and the AR gene itself (4, 5, 13, 17, 18). Further analysis of the active regions associated with the AR gene identified nine potential AR-binding sites in total (Fig. 2A). These regions are all potentially novel sites of AR binding, because the previously reported AREs are located within exons 4–5 of the AR gene (13, 17). Sequence analysis identified ARE half-sites within eight of these regions, including four that contain full-length AREs. Of the four regions possessing a full ARE, we selected the region that exhibited the strongest peak signal for validation by AR ChIP-qPCR. AR binding was confirmed at this site specifically in the presence of DHT treatment (Fig. 2B). Consistent with the AR-binding data and previous reports (13, 17, 19), we observed increased levels of AR RNA (Fig. 2C) and protein (Fig. 2D) upon treatment of HSMMs with DHT. These data confirm that AR regulates its own expression in muscle and identifies novel sites for AR binding within the gene.
Fig. 2.

AR targets the AR gene in skeletal muscle. A, AR gene is shown in its native chromosomal location according to 2006 Human Genome Assembly (hg18) in the UCSC Genome Browser (http://genome.ucsc.edu). Green blocks represent regions of enriched AR-binding signal. Vertical lines within the AR gene represent exons, horizontal lines represent introns, and the arrowheads represent the direction of transcription. Asterisk indicates region chosen for validation by qPCR. B, Validation of AR binding at the AR gene by ChIP-qPCR. AR binding was assayed by qPCR at the AR gene using proliferating HSMMs treated with 30 nm DHT or DMSO (Vehicle) subjected to ChIP with the AR H-280 antibody. Data are represented as described in Fig. 1A. C, Analysis of AR gene expression. TaqMan analysis detecting AR expression in RNA collected from differentiating HSMMs treated with 30 nm DHT or DMSO (Vehicle) for 48 h. Expression data for AR were normalized to that of glyceraldehyde-3-phosphate dehydrogenase (GAPDH) within each sample. Data are presented as the average fold change relative to the vehicle-treated sample, based on three independent experiments. D, Analysis of AR protein expression. Western analysis showing expression of AR and β-actin in lysates from proliferating HSMMs treated with 30 nm DHT or DMSO (Vehicle) for 24 h. ChrX, X chromosome; IP, immunoprecipitation.
Micro-RNAs (miRNAs) implicated in muscle development contain novel AR active regions
miRNAs are known to be key regulators of gene expression and have been implicated in development and cell fate determination (20). Recently, a number of studies have implicated miRNAs in the control of myoblast proliferation and differentiation (21, 22, 23). We have identified 130 AR active regions associated with miRNA genes in human myoblasts, including several that regulate myoblast differentiation. We selected four miRNAs implicated in muscle differentiation, miR-206, miR-133b, miR-221, and miR-222, for further validation and analysis. miR-206 is part of a bicistronic miRNA cluster with miR-133b; similarly, miR-221 and miR-222 are encoded in tandem (23). We detected eight active regions near the miR-206/miR-133b locus (Fig. 3A). Five of these sites contain a predicted full-length ARE, and one additional active region contains a half-site. AR binding in the presence of DHT was confirmed by ChIP-qPCR downstream of the miR206/miR133b locus at the active site containing a full ARE that exhibited the strongest peak signal (Fig. 3B). At the miR-221/miR-222 locus, six active regions were enriched in AR binding (Fig. 3A). Two of these active regions contain putative full-length AREs, and the remaining four possess ARE half-sites. We assayed for AR binding by ChIP-qPCR at one of the active regions possessing an ARE half-site and confirmed AR recruitment to this region in the presence of DHT (Fig. 3B). Thus, AR is capable of binding to regions of the genome that lack a full-length, consensus ARE; however, the relative enrichment compared with vehicle or IgG controls is decreased compared with regions tested that possess full AREs. We then assayed for expression of these miRNAs in the absence or presence of DHT by TaqMan analysis (Fig. 3C). All four miRNAs exhibited increased expression upon DHT treatment, suggesting that these miRNAs are likely directly regulated by AR in muscle.
Fig. 3.
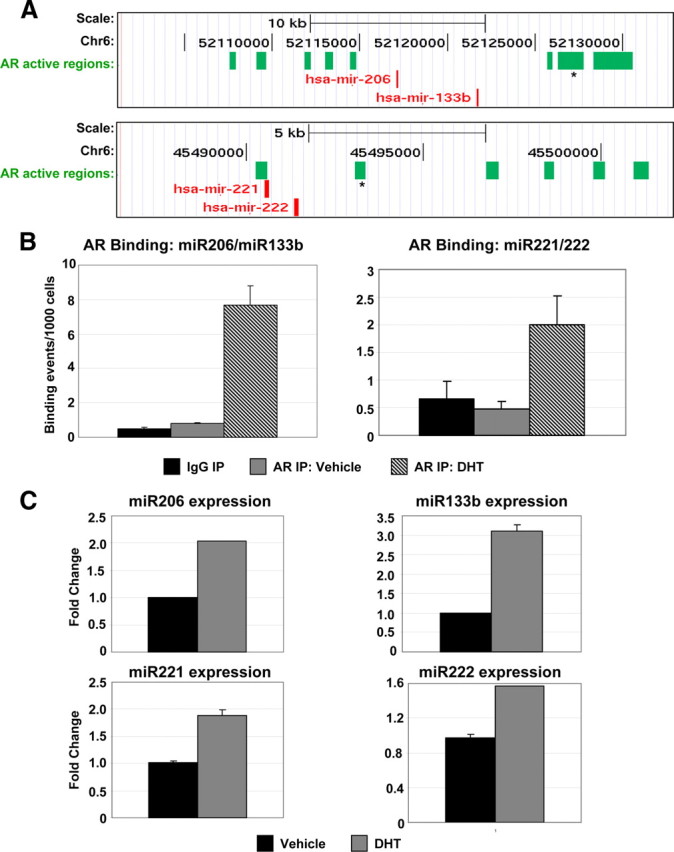
AR regulates the expression of miRNAs in skeletal muscle. A, Two AR target miRNA clusters, miR-206/miR-133b and miR-221/miR-222, are shown in their native chromosomal locations according to 2006 Human Genome Assembly (hg18) in the UCSC Genome Browser (http://genome.ucsc.edu). Green blocks represent regions of enriched AR-binding signal. Asterisks indicate regions chosen for validation by qPCR. B, Validation of AR binding at the miR-206/miR-133b and miR-221/miR-222 gene clusters by ChIP-qPCR. AR binding assayed by qPCR in samples from proliferating HSMMs treated with 30 nm DHT or DMSO (Vehicle) subjected to ChIP with the AR antibody. Data are represented as described in Fig. 1A. C, Analysis of miRNA expression. TaqMan analysis detecting expression of miR-206, miR-133b, miR-221, and miR-222 in RNA collected from proliferating HSMMs treated with 30 nm DHT or DMSO (Vehicle) for 96 h. Expression data for each miRNA were normalized to that of U6 small nuclear RNA within each sample. Data are presented as the average fold change relative to the vehicle-treated sample, based on two independent experiments. Chr6, Chromosome 6; IP, immunoprecipitation.
Genes implicated in sarcomere integrity and muscle contraction contain novel AR active regions
The dataset generated from the ChIP-on-Chip experiment included a number of genes implicated in sarcomere integrity and muscle contraction, including myomesin family members (MYOM1, MYOM2, MYOM3), myotilin (MYOT), and myozenin genes (MYOZ1, MYOZ2). Members of the MYOM family are structural constituents of the M-band believed to bind titin and myosin and stabilize thick filaments during muscle contraction (24, 25). We detected active regions for AR binding located within or near all three MYOM genes (five in MYOM1; one each in MYOM2 and MYOM3). All but one of these active regions contain a predicted full-length ARE sequence, and the remaining active region contains an ARE half-site. MYOT, a structural component of the Z-disc suggested to stabilize thin filaments during contraction (26), possesses a single, ARE-containing active region located within the gene. Two additional Z-disc proteins, MYOZ1 and MYOZ2 (27, 28), possess one and five AR active regions, respectively. Four of the five active regions within MYOZ2 contain a full-length ARE, and the remaining active region contains a half-site. We confirmed AR recruitment to a subset of these genes (MYOM1, MYOT, and MYOZ2) in the presence of DHT via ChIP-qPCR (Fig. 4A). Consistent with the ChIP experiment, we observed increased RNA expression of all three genes in the presence of DHT treatment, indicating that transcription of these genes is likely directly regulated by AR (Fig. 4B).
Fig. 4.

AR regulates the expression of genes with a role in sarcomere integrity and muscle contraction. A, Validation of AR binding of sarcomeric genes by ChIP-qPCR. AR binding at the MYOM1, MYOT, and MYOZ2 genes detected in proliferating HSMMs treated with 30 nm DHT or DMSO (Vehicle) subjected to ChIP with AR antibody. Data are represented as described in Fig. 1A. B, Analysis of sarcomeric gene expression. Taqman analysis detecting expression of MyoM1, MyoT, and MyoZ2 in RNA collected from differentiating HSMMs treated with 30 nm DHT or DMSO (Vehicle) for 48 h. Expression data for each gene were normalized to that of GAPDH within each sample. Data are presented as the average fold change relative to the vehicle-treated sample, based on four independent experiments. IP, Immunoprecipitation.
AR targets Mef2c-regulated genes
Intriguingly, several of the above-mentioned potential AR targets involved in sarcomere stability and muscle contraction were previously shown to be regulated by the MADS [MCM1, agamous, deficiens, serum response factor (SRF)]-box transcription factor Mef2c (29). Specifically, gene expression analyses in mice possessing a skeletal muscle-specific deletion of Mef2c exhibited reduced expression of MYOM1, MYOM2, MYOT, MYOZ1, and MYOZ2. Further, Mef2c was shown to bind to MEF2 consensus sites within the promoter regions of MYOM1 and MYOM2, suggesting that these genes are direct targets of Mef2c (30). Analysis of the AR binding data identified a number of additional genes previously suggested to be regulated by Mef2c, including CALR, DES, JUN, SMYD1, and the MEF2C gene itself (30, 31, 32, 33, 34). ChIP-qPCR analysis confirmed AR binding in the presence of DHT within the MEF2C and SMYD1 genes (Fig. 5A). A modest but significant (P < 0.05) increase in expression at both of these genes was observed upon DHT treatment (Fig. 5B), and expression of both genes was reduced in muscle from AR-knockout mice (data not shown), suggesting that these Mef2c-regulated genes are directly regulated by AR.
Fig. 5.

AR regulates the expression of Mef2c targets. A, Validation of AR binding at the MEF2C and SMYD1 genes by ChIP-qPCR. AR binding assayed at MEF2C and SMYD1 genes in proliferating HSMMs treated with 30 nm DHT or DMSO (Vehicle) subjected to ChIP with the AR antibody. Data are represented as described in Fig. 1A. B, Gene expression analysis. TaqMan analysis detecting expression of Mef2c and Smyd1in RNA collected from differentiating HSMMs treated with 30 nm DHT or DMSO (Vehicle) for 48 h. Expression data for each gene was normalized to that of GAPDH within each sample. Data are presented as the average fold change relative to the vehicle-treated sample, based on three independent experiments. IP, Immunoprecipitation.
Discussion
A first step toward understanding how androgens via the AR exert critical roles in muscle is to identify the genetic program induced by androgens specifically in muscle. The advent of techniques such as ChIP-on-Chip and ChIP-Seq has provided an unbiased, comprehensive approach to the identification of transcription factor-binding sites across the genome. A number of such cistrome analyses have recently been published for AR (7, 8, 9, 10, 11, 12, 35); however, only a few of these studies have analyzed AR binding genome wide (11, 35), and, to date, all of these studies have focused on AR binding in prostate cancer cells. Here we report the first genome-wide analysis of AR binding in skeletal muscle cells. Our ChIP-on-Chip analysis identified 32,804 potential AR-binding regions in primary human skeletal myoblasts. A subset of these sites (4155) included AR binding in the absence of ligand. These active regions represent potential sites of ligand-independent gene regulation by AR in skeletal muscle myoblasts. Importantly, 100% of the active regions queried by ChIP-qPCR were confirmed as sites of ligand-dependent AR binding (Fig. 1E). Further, relative signals obtained for each active region by ChIP-qPCR correlated well with peak signal ratios from the ChIP-on-Chip (data not shown), suggesting that the ChIP-on-Chip data predict sites of AR binding in muscle with high confidence. TRANSFAC analysis indicated that approximately 90% of the AR active regions contain at least an ARE half-site, with 64% possessing a full-length ARE. The remaining sequences may represent genomic sites at which AR is recruited via interaction with another transcription factor, as has been previously reported at certain genes (4, 5, 6). Consistent with previous reports for AR and other nuclear receptors (7, 8, 10, 12, 36, 37), the majority of AR active regions detected were distant from promoter regions, localized predominantly in distal intergenic regions or in introns (Fig. 1C). This distribution suggests that AR may interact with the basal transcription machinery and other transcriptional regulators via DNA looping, as has been observed in other experimental systems (12, 36).
Among the AR active regions identified in this analysis are 130 that reside within or near miRNA loci, indicating that miRNAs are a component of the gene expression program induced by AR in muscle. Five of the identified miRNAs have previously been shown to exhibit androgen-responsive expression in prostate cancer cells (38). Here we analyzed the role of AR in regulating the expression of four additional miRNAs (miR206, miR133b, miR221, and miR222) that have previously been implicated in muscle development (21, 22, 39). AR binding was confirmed by ChIP-qPCR at the miR206/miR133b and miR221/miR222 loci (Fig. 3B). miR206 and miR133b are expressed specifically in skeletal muscle but are suggested to share mRNA targets with two nearly-identical miRNA loci, miR1-1/miR133a-2 and miR1-2/miR133a-1, which are expressed in both skeletal and cardiac muscle (22, 23). Despite the similarity between the gene clusters, we detected no AR active regions at either the miR1-1/miR133a-2 or miR1-2/miR133a-1 locus, suggesting that AR regulates the downstream mRNAs targeted by these miRNAs specifically in skeletal muscle.
miR206 is highly expressed in differentiating muscle cells and is suggested to promote differentiation in part by reducing expression of PolA1, a DNA pol α-subunit that is critical for DNA synthesis and cell proliferation (39). Thus, it is likely that up-regulation of miR206 expression contributes to the AR-dependent increase in myoblast differentiation that has been reported after stimulation with androgens (40, 41). In contrast, miR133 is proposed to promote myoblast proliferation by repressing expression of SRF, a transcriptional regulator that is essential for differentiation (22). The contrasting effects on cell growth and differentiation produced by these cotranscribed miRNAs reflect the complexity of the finely tuned pathways that result in muscle growth and mirror the contrasting roles suggested for androgen signaling through AR in muscle (1, 2). Interestingly, a number of validated mRNA targets of miR206 (Utrn, Fstl1, and PolA1) (39, 42) and miR133 (RhoA and Cdc42) (43) also contain AR active regions and predicted AREs (data not shown). This suggests that regulation of these genes via AR signaling is occurring through both direct (AR binding) and indirect (posttranscriptional control via up-regulation of miR206 and miR133b) mechanisms, hinting at the complexity that likely underlies the expression of other AR-regulated genes.
miR221 and miR222 were previously shown to be highly expressed in proliferating myoblasts and down-regulated upon differentiation (21). It is suggested that these miRNAs promote myoblast proliferation and cell cycle progression in part by targeting the cell cycle inhibitors p27 and p57 (21, 44). Consistent with the proposed role for AR in stimulating expression of these miRNAs, elevated p57 expression was reported in the gastrocnemius muscle of a global AR-knockout mouse (45). We did not detect AR binding at the p57 locus in our ChIP-on-Chip study, suggesting that AR-mediated regulation of p57 expression is likely indirect, via modulation of miR221/222 expression.
Supporting the well-established role of androgens and AR in muscle function, we provide evidence of a role for AR in the regulation of genes involved in sarcomere integrity and muscle contraction, including members of the MYOM, MYOT, and MYOZ families. We confirmed AR binding and androgen-responsive expression for three of these genes (MYOM1, MYOT, and MYOZ2); however, AR active regions containing ARE full- or half-sites were observed for multiple members of the MYOM and MYOZ families, suggesting a more general role for AR in regulating transcription of sarcomeric genes. Notably, these genes have previously been suggested to be regulated by the MADS box transcription factor Mef2c, suggesting a functional interaction between MEF2c and AR in regulating the expression of genes involved in muscle development. AR has previously been reported to collaborate with other transcription factors in the regulation of gene expression in the prostate, such as FoxA1 (8, 12), GATA2 (8, 12), Oct1 (12), NF1 (8), C/EBPβ (8), and Ets1 (9), suggesting that the tissue-specific response of certain genes to androgen signaling may be due, in part, to the interaction of AR with different transcription factors in different tissues. Intriguingly, AR has been shown to functionally and physically interact with another MADS-box transcription factor (SRF) in skeletal muscle, and this interaction was mediated, in part, through its MADS box domain (4). Thus, an important area for future investigation is the extent to which AR collaborates with Mef2c, and other MADS box transcription factors in general, in the regulation of transcriptional targets in skeletal muscle.
Our study offers the first genome-wide map of AR binding in skeletal muscle cells, providing a valuable data set that can serve as the basis for future investigations into the role of androgen signaling in muscle development, growth, and performance. Although anabolic steroids such as androgens have negative connotations as performance-enhancing drugs, they are viable therapeutic targets for developing treatments for combating muscle wasting associated with cancer, AIDS, and other diseases. Further characterization of genes targeted by AR in muscle, as well as the transcriptional regulators that promote the androgen response, will help elucidate the pathways that are regulated by androgen signaling and potentially provide novel therapeutic targets to combat muscle-wasting disorders.
Materials and Methods
Cell culture
Primary human skeletal muscle myoblasts (Lonza) were grown and maintained in SkGM-2 media (Lonza) following the manufacturer’s recommendations. For TaqMan experiments, proliferating cells were grown in modified SkGM-2 media lacking dexamethasone and containing 5% charcoal-stripped fetal bovine serum. Cells were differentiated in DMEM-F12 supplemented with 2% horse serum (Lonza) following the manufacturer’s recommendations.
ChIP
Primary human skeletal myoblasts were treated with 30 nm dihydrotestosterone (DHT) or an equal volume of dimethylsulfoxide (DMSO) for 8 h. Treated cells were then fixed with 1% formaldehyde for 15 min and quenched with 0.125 m glycine. Control and AR ChIPs and subsequent genome tiling array hybridization were performed by Genpathway, Inc. (San Diego, CA). Chromatin was isolated by adding lysis buffer, followed by disruption with a Dounce homogenizer (cells). Lysates were sonicated and the DNA was sheared to an average length of 300–500 bp. Genomic DNA (input) was prepared by treating aliquots of chromatin with ribonuclease, proteinase K, and heat for de-cross-linking, followed by ethanol precipitation. Pellets were resuspended, and the resulting DNA was quantified on a NanoDrop spectrophotometer. Extrapolation to the original chromatin volume allowed quantitation of the total chromatin yield. An aliquot of chromatin (20–30 μg) was then precleared with protein A agarose beads (Invitrogen, Carlsbad, CA). Genomic DNA regions of interest were isolated using an antibody against AR (sc-13062, Santa Cruz Biotechnology, Inc., Santa Cruz, CA) or rabbit IgG (I-5006; Sigma, St. Louis, MO) as a control. After incubation at 4 C overnight, protein A agarose beads were used to isolate the immune complexes. Complexes were washed, eluted from the beads with sodium dodecyl sulfate buffer, and subjected to ribonuclease and proteinase K treatment. Cross-links were reversed by incubation overnight at 65 C, and ChIP DNA was purified by phenol-chloroform extraction and ethanol precipitation.
Quantitative PCR (qPCR) reactions were carried out in triplicate on specific genomic regions using SYBR Green Supermix (Bio-Rad Laboratories, Hercules, CA). The resulting signals were normalized for primer efficiency by carrying out qPCR for each primer pair using input DNA.
ChIP-on-Chip analysis
IgG and AR ChIPs were performed on lysates from primary human skeletal myoblasts treated with 30 nm DHT or an equal volume of DMSO for 8 h as described above. ChIP and input DNAs were amplified by whole-genome amplification using the GenomePlex WGA Kit (Sigma). The resulting amplified DNAs were purified, quantified, and tested by qPCR at control genomic regions to assess quality of the amplification reactions. Amplified DNAs were then fragmented and labeled using the DNA Terminal Labeling Kit from Affymetrix (Santa Clara, CA) and then hybridized to Affymetrix GeneChip Human Tiling 2.0R Array Sets at 45 C overnight. Arrays were washed, scanned, and analyzed using Affymetrix Tiling Analysis Software (TAS) or MAT (15). The TAS analysis was conducted by Genpathway, Inc. (San Diego, CA). Briefly, a two-sample analysis was performed comparing each CEL file of the IP samples against the CEL file from the input DNA array. The resulting BAR files contain the signal values for all probes on the arrays. Signal values are estimates of fold enrichment of ChIP/immunoprecipitated-DNA, which in essence are ratios (in linear scale) between the intensity of the probes on the ChIP/immunoprecipitated-DNA array divided by the intensity of the corresponding probe on the input DNA array. To make the values more significant, however, these ratios are computed by applying averaging and ranking steps to a set of probes within a 400-bp sliding window. An Interval is a discrete genomic region, defined by the chromosome number and a start and end coordinate, that represents the locations of signal peaks. For each BAR file, Intervals are calculated and compiled into BED files. Three TAS parameters that determine the Intervals: 1) Threshold = 2.5, 2) MaxGap = 300; and 3) MinRun = 180. Overlapping Intervals among different samples are grouped into Active Regions. MAT-2.09 was used with probes remapped to the hg18 Human Genome Assembly. The threshold cutoffs for binding regions were false discovery rate less than or equal to 1.83%. AR-binding sites were considered overlapped with the ones from other algorithms or studies when there was at least 1 bp in common between the binding regions. Screenshots of AR-binding regions relative to individual RefSeq genes in their native chromosomal locations were obtained from the University of California Santa Cruz (UCSC) Genome Browser (http://genome.ucsc.edu). The ChIP-on-Chip dataset (.CEL files) is available in the online Gene Expression Omnibus (GEO) repository under accession number GSE22076.
Mapping of binding regions, sequence conservation, and motif analysis
An active region that is within 10,000bp upstream or downstream of a gene was counted as being associated with that gene. Sequence conservation analysis was performed by aligning AR ChIP active regions at their centers and uniformly expanding to 3000 bp in each direction, then phastCons scores were retrieved (http://genome.ucsc.edu) and averaged at each position. For enriched motif analysis, CEAS (46) was used to analyze the transcription factor motifs that are located in ChIP-binding regions. The well-defined position weight matrices were obtained from TRANSFAC (47) and JASPAR (48). Enrichment of motifs within the AR ChIP-on-Chip dataset was calculated relative to the frequency of motif occurrence in the entire human genome. The complete dataset of active regions and identified genes is included as Supplemental Material File 1 and Supplemental Material File 2.
RNA expression analysis
Total RNA was isolated using the RNeasy Plus Mini Kit (QIAGEN, Chatsworth, CA) following the manufacturer’s protocol. RNA concentrations were determined, and then 2 μg of each sample were reverse transcribed using the High Capacity cDNA Reverse Transcription Kit (Applied Biosystems, Foster City, CA) following the manufacturer’s protocol. qPCR was performed on an Applied Biosystems 7900HT Fast Real-Time PCR System using gene-specific TaqMan primers (Applied Biosystems).
For expression analysis of miRNAs, miRNA-enriched samples were isolated using an miRNeasy Mini kit and RNeasy MinElute Cleanup kit (QIAGEN), following the manufacturer’s protocol. Purified RNA was then reverse transcribed using gene-specific primers and the TaqMan microRNA Reverse Transcription kit (Applied Biosystems). qPCR was then performed on an Applied Biosystems 7900HT Fast Real-Time PCR System using gene-specific TaqMan primers (Applied Biosystems).
Western blot analysis
Primary human skeletal myoblasts were treated with 30 nm DHT or an equal volume of DMSO, harvested, and then lysed in lysis buffer (PBS, pH 7.4; 10% glycerol; 0.05% Triton X-100; 1 mm phenylmethylsulfonylfluoride; and 1× protease inhibitor cocktail). Lysates were briefly sonicated and then clarified by centrifugation. Protein concentrations for each lysate were then determined via BCA protein assay (Thermo Fisher Scientific, Rockford, IL), using BSA as a standard. Equal amounts of total protein were electrophoresed on 4–12% NuPAGE gels (Invitrogen, Carlsbad, CA) in 3[N-morpholino]propanesulfonic acid buffer, and then transferred onto nitrocellulose membranes. Membranes were blocked in Tris-buffered saline (TBS)/Tween 20 containing 3% milk for 1 h. Primary antibody incubations were performed overnight at 4 C in TBS/Tween 20 containing 3% milk, following the manufacturer’s recommendations for specific antibody dilutions. Antibodies were used for AR (sc-13062; Santa Cruz Biotechnology, Inc., Santa Cruz, CA) and β-actin (C-4; Santa Cruz Biotechnology, Inc.). Membranes were washed extensively and incubated with an appropriate secondary antibody diluted in TBS/Tween 20 for 1 h. After extensive washing, signals were detected by chemiluminescence using the Supersignal West Pico kit (Thermo Fisher Scientific).
Footnotes
Current address for S.N.: Bone, Respiratory, Immunology & Dermatology, Merck, West Point, Pennsylvania 19486.
Disclosure summary: The authors were employed by Pfizer (formerly Wyeth Research) at the time this research was conducted.
First Published Online July 7, 2010
Abbreviations: AR, Androgen receptor; ARE, androgen response element; BAR, binary analysis results; BED, browser extensible data; CEAS, cis-regulatory element annotation system; CEL, cell intensity file; ChIP, chromatin immunoprecipitation; ChIP-on-Chip, ChIP coupled with tiling microarray detection of genomic fragments; DHT, 5α-dihydrotestosterone; DMSO, dimethylsulfoxide; GAPDH, glyceraldehyde-3-phosphate dehydrogenase; HSMMs, human skeletal muscle myoblasts; MAT, microarray analysis tool; miRNA, micro-RNA; MYOM, myomesin; MYOT, myotilin; MYOZ, myozenin; PSA, prostate-specific antigen; qPCR, quantitative PCR; SRF, serum response factor; TAS, tiling analysis software; TBS, Tris-buffered saline.
References
- 1.Kadi F2008. Cellular and molecular mechanisms responsible for the action of testosterone on human skeletal muscle. A basis for illegal performance enhancement. Br J Pharmacol 154:522–528 [DOI] [PMC free article] [PubMed] [Google Scholar]
- 2.Chen Y, Zajac JD, MacLean HE2005. Androgen regulation of satellite cell function. J Endocrinol 186:21–31 [DOI] [PubMed] [Google Scholar]
- 3.Claessens F, Denayer S, Van Tilborgh N, Kerkhofs S, Helsen C, Haelens A2008. A Diverse roles of androgen receptor (AR) domains in AR-mediated signaling. Nucl Recept Signal 6:e008 [DOI] [PMC free article] [PubMed]
- 4.Vlahopoulos S, Zimmer WE, Jenster G, Belaguli NS, Balk SP, Brinkmann AO, Lanz RB, Zoumpourlis VC, Schwartz RJ2005. Recruitment of the androgen receptor via serum response factor facilitates expression of a myogenic gene. J Biol Chem 280:7786–7792 [DOI] [PubMed] [Google Scholar]
- 5.Zhao W, Pan J, Wang X, Wu Y, Bauman WA, Cardozo CP2008. Expression of the muscle atrophy factor muscle atrophy F-box is suppressed by testosterone. Endocrinology 149:5449–5460 [DOI] [PubMed] [Google Scholar]
- 6.Amir AL, Barua M, McKnight NC, Cheng S, Yuan X, Balk SP2003. A direct β-catenin-independent interaction between androgen receptor and T cell factor 4. J Biol Chem 278:30828–30834 [DOI] [PubMed] [Google Scholar]
- 7.Bolton EC, So AY, Chaivorapol C, Haqq CM, Li H, Yamamoto KR2007. Cell- and gene-specific regulation of primary target genes by the androgen receptor. Genes Dev 21:2005–2017 [DOI] [PMC free article] [PubMed] [Google Scholar]
- 8.Jia L, Berman BP, Jariwala U, Yan X, Cogan JP, Walters A, Chen T, Buchanan G, Frenkel B, Coetzee GA2008. Genomic androgen receptor-occupied regions with different functions, defined by histone acetylation, coregulators and transcriptional capacity. PLoS One 3:e3645 [DOI] [PMC free article] [PubMed]
- 9.Massie CE, Adryan B, Barbosa-Morais NL, Lynch AG, Tran MG, Neal DE, Mills IG2007. New androgen receptor genomic targets show an interaction with the ETS1 transcription factor. EMBO Rep 8:871–878 [DOI] [PMC free article] [PubMed] [Google Scholar]
- 10.Takayama K, Kaneshiro K, Tsutsumi S, Horie-Inoue K, Ikeda K, Urano T, Ijichi N, Ouchi Y, Shirahige K, Aburatani H, Inoue S2007. Identification of novel androgen response genes in prostate cancer cells by coupling chromatin immunoprecipitation and genomic microarray analysis. Oncogene 26:4453–4463 [DOI] [PubMed] [Google Scholar]
- 11.Wang Q, Li W, Zhang Y, Yuan X, Xu K, Yu J, Chen Z, Beroukhim R, Wang H, Lupien M, Wu T, Regan MM, Meyer CA, Carroll JS, Manrai AK, Jänne OA, Balk SP, Mehra R, Han B, Chinnaiyan AM, Rubin MA, True L, Fiorentino M, Fiore C, Loda M, et al.2009. Androgen receptor regulates a distinct transcription program in androgen-independent prostate cancer. Cell 138:245–256 [DOI] [PMC free article] [PubMed] [Google Scholar]
- 12.Wang Q, Li W, Liu XS, Carroll JS, Jänne OA, Keeton EK, Chinnaiyan AM, Pienta KJ, Brown M2007. A hierarchical network of transcription factors governs androgen receptor-dependent prostate cancer growth. Mol Cell 27:380–392 [DOI] [PMC free article] [PubMed] [Google Scholar]
- 13.Grad JM, Dai JL, Wu S, Burnstein KL1999. Multiple androgen response elements and a Myc consensus site in the androgen receptor (AR) coding region are involved in androgen-mediated up-regulation of AR messenger RNA. Mol Endocrinol 13:1896–1911 [DOI] [PubMed] [Google Scholar]
- 14.Wang Q, Carroll JS, Brown M2005. Spatial and temporal recruitment of androgen receptor and its coactivators involves chromosomal looping and polymerase tracking. Mol Cell 19:631–642 [DOI] [PubMed] [Google Scholar]
- 15.Johnson WE, Li W, Meyer CA, Gottardo R, Carroll JS, Brown M, Liu XS2006. Model-based analysis of tiling-arrays for ChIP-chip. Proc Natl Acad Sci USA 103:12457–12462 [DOI] [PMC free article] [PubMed] [Google Scholar]
- 16.Lanz RB, Bulynko Y, Malovannaya A, Labhart P, Wang L, Li W, Qin J, Harper M, O'Malley BW2010. Global characterization of transcriptional impact of the SRC-3 coregulator. Mol Endocrinol 24:859–872 [DOI] [PMC free article] [PubMed] [Google Scholar]
- 17.Dai JL, Burnstein KL1996. Two androgen response elements in the androgen receptor coding region are required for cell-specific up-regulation of receptor messenger RNA. Mol Endocrinol 10:1582–1594 [DOI] [PubMed] [Google Scholar]
- 18.Hong CY, Suh JH, Kim K, Gong EY, Jeon SH, Ko M, Seong RH, Kwon HB, Lee K2005. Modulation of androgen receptor transactivation by the SWI3-related gene product (SRG3) in multiple ways. Mol Cell Biol 25:4841–4852 [DOI] [PMC free article] [PubMed] [Google Scholar]
- 19.González-Cadavid N, Vernet D, Fuentes Navarro A, Rodriguez JA, Swerdloff RS, Rajfer J1993. Up-regulation of the levels of androgen receptor and its mRNA by androgens in smooth-muscle cells from rat penis. Mol Cell Endocrinol 90:219–229 [DOI] [PubMed] [Google Scholar]
- 20.Bartel DP2004. MicroRNAs: genomics, biogenesis, mechanism, and function. Cell 116:281–297 [DOI] [PubMed] [Google Scholar]
- 21.Cardinali B, Castellani L, Fasanaro P, Basso A, Alemà S, Martelli F, Falcone G2009. MicroRNA-221 and microRNA-222 modulate differentiation and maturation of skeletal muscle cells. PLoS One 4:e7607 [DOI] [PMC free article] [PubMed]
- 22.Chen JF, Mandel EM, Thomson JM, Wu Q, Callis TE, Hammond SM, Conlon FL, Wang DZ2006. The role of microRNA-1 and microRNA-133 in skeletal muscle proliferation and differentiation. Nat Genet 38:228–233 [DOI] [PMC free article] [PubMed] [Google Scholar]
- 23.van Rooij E, Liu N, Olson EN2008. MicroRNAs flex their muscles. Trends Genet 24:159–166 [DOI] [PubMed] [Google Scholar]
- 24.Agarkova I, Perriard JC2005. The M-band: an elastic web that crosslinks thick filaments in the center of the sarcomere. Trends Cell Biol 15:477–485 [DOI] [PubMed] [Google Scholar]
- 25.Schoenauer R, Lange S, Hirschy A, Ehler E, Perriard JC, Agarkova I2008. Myomesin 3, a novel structural component of the M-band in striated muscle. J Mol Biol 376:338–351 [DOI] [PubMed] [Google Scholar]
- 26.Otey CA, Rachlin A, Moza M, Arneman D, Carpen O2005. The palladin/myotilin/myopalladin family of actin-associated scaffolds. Int Rev Cytol 246:31–58 [DOI] [PubMed] [Google Scholar]
- 27.Frey N, Richardson JA, Olson EN2000. Calsarcins, a novel family of sarcomeric calcineurin-binding proteins. Proc Natl Acad Sci USA 97:14632–14637 [DOI] [PMC free article] [PubMed] [Google Scholar]
- 28.Takada F, Vander Woude DL, Tong HQ, Thompson TG, Watkins SC, Kunkel LM, Beggs AH2001. Myozenin: an α-actinin- and γ-filamin-binding protein of skeletal muscle Z lines. Proc Natl Acad Sci USA 98:1595–1600 [DOI] [PMC free article] [PubMed] [Google Scholar]
- 29.Potthoff MJ, Olson EN2007. MEF2: a central regulator of diverse developmental programs. Development 134:4131–4140 [DOI] [PubMed] [Google Scholar]
- 30.Potthoff MJ, Arnold MA, McAnally J, Richardson JA, Bassel-Duby R, Olson EN2007. Regulation of skeletal muscle sarcomere integrity and postnatal muscle function by Mef2c. Mol Cell Biol 27:8143–8151 [DOI] [PMC free article] [PubMed] [Google Scholar]
- 31.Lynch J, Guo L, Gelebart P, Chilibeck K, Xu J, Molkentin JD, Agellon LB, Michalak M2005. Calreticulin signals upstream of calcineurin and MEF2C in a critical Ca(2+)-dependent signaling cascade. J Cell Biol 170:37–47 [DOI] [PMC free article] [PubMed] [Google Scholar]
- 32.Li H, Capetanaki Y1994. An E box in the desmin promoter cooperates with the E box and MEF-2 sites of a distal enhancer to direct muscle-specific transcription. EMBO J 13:3580–3589 [DOI] [PMC free article] [PubMed] [Google Scholar]
- 33.Phan D, Rasmussen TL, Nakagawa O, McAnally J, Gottlieb PD, Tucker PW, Richardson JA, Bassel-Duby R, Olson EN2005. BOP, a regulator of right ventricular heart development, is a direct transcriptional target of MEF2C in the developing heart. Development 132:2669–2678 [DOI] [PubMed] [Google Scholar]
- 34.Wei X, Sun W, Fan R, Hahn J, Joetham A, Li G, Webb S, Garrington T, Dakhama A, Lucas J, Johnson GL, Gelfand EW2003. MEF2C regulates c-Jun but not TNF-α gene expression in stimulated mast cells. Eur J Immunol 33:2903–2909 [DOI] [PubMed] [Google Scholar]
- 35.Lin B, Wang J, Hong X, Yan X, Hwang D, Cho JH, Yi D, Utleg AG, Fang X, Schones DE, Zhao K, Omenn GS, Hood L2009. Integrated expression profiling and ChIP-seq analyses of the growth inhibition response program of the androgen receptor. PLoS One 4:e6589 [DOI] [PMC free article] [PubMed]
- 36.Carroll JS, Liu XS, Brodsky AS, Li W, Meyer CA, Szary AJ, Eeckhoute J, Shao W, Hestermann EV, Geistlinger TR, Fox EA, Silver PA, Brown M2005. Chromosome-wide mapping of estrogen receptor binding reveals long-range regulation requiring the forkhead protein FoxA1. Cell 122:33–43 [DOI] [PubMed] [Google Scholar]
- 37.Carroll JS, Meyer CA, Song J, Li W, Geistlinger TR, Eeckhoute J, Brodsky AS, Keeton EK, Fertuck KC, Hall GF, Wang Q, Bekiranov S, Sementchenko V, Fox EA, Silver PA, Gingeras TR, Liu XS, Brown M2006. Genome-wide analysis of estrogen receptor-binding sites. Nat Genet 38:1289–1297 [DOI] [PubMed] [Google Scholar]
- 38.Ribas J, Ni X, Haffner M, Wentzel EA, Salmasi AH, Chowdhury WH, Kudrolli TA, Yegnasubramanian S, Luo J, Rodriguez R, Mendell JT, Lupold SE2009. miR-21: an androgen receptor-regulated microRNA that promotes hormone-dependent and hormone-independent prostate cancer growth. Cancer Res 69:7165–7169 [DOI] [PMC free article] [PubMed] [Google Scholar]
- 39.Kim HK, Lee YS, Sivaprasad U, Malhotra A, Dutta A2006. Muscle-specific microRNA miR-206 promotes muscle differentiation. J Cell Biol 174:677–687 [DOI] [PMC free article] [PubMed] [Google Scholar]
- 40.Lee DK2002. Androgen receptor enhances myogenin expression and accelerates differentiation. Biochem Biophys Res Commun 294:408–413 [DOI] [PubMed] [Google Scholar]
- 41.Diel P, Baadners, D, Schlüpmann, K, Velders M, Schwarz JP2008. C2C12 myoblastoma cell differentiation and proliferation is stimulated by androgens and associated with a modulation of myostatin and Pax7 expression. J Mol Endocrinol 40:231–241 [DOI] [PubMed] [Google Scholar]
- 42.Rosenberg MI, Georges SA, Asawachaicharn A, Analau E, Tapscott SJ2006. MyoD inhibits Fstl1 and Utrn expression by inducing transcription of miR-206. J Cell Biol 175:77–85 [DOI] [PMC free article] [PubMed] [Google Scholar]
- 43.Carè A, Catalucci D, Felicetti F, Bonci D, Addario A, Gallo P, Bang ML, Segnalini P, Gu Y, Dalton ND, Elia L, Latronico MV, Høydal M, Autore C, Russo MA, Dorn II GW, Ellingsen O, Ruiz-Lozano P, Peterson KL, Croce CM, Peschle C, Condorelli G2007. MicroRNA-133 controls cardiac hypertrophy. Nat Med 13:613–618 [DOI] [PubMed] [Google Scholar]
- 44.Medina R, Zaidi, SK, Liu, CG, Stein JL, van Wijnen AJ, Croce CM, Stein GS2008. MicroRNAs 221 and 222 bypass quiescence and compromise cell survival. Cancer Res 68:2773–2780 [DOI] [PMC free article] [PubMed] [Google Scholar]
- 45.MacLean HE, Chiu WS, Notini AJ, Axell AM, Davey RA, McManus JF, Ma C, Plant DR, Lynch GS, Zajac JD2008. Impaired skeletal muscle development and function in male, but not female, genomic androgen receptor knockout mice. FASEB J 22:2676–2689 [DOI] [PubMed] [Google Scholar]
- 46.Ji X, Li W, Song J, Wei L, Liu XS2006. CEAS: cis-regulatory element annotation system. Nucleic Acids Res 34:W551–W554 [DOI] [PMC free article] [PubMed]
- 47.Matys V, Fricke E, Geffers R, Gössling E, Haubrock M, Hehl R, Hornischer K, Karas D, Kel AE, Kel-Margoulis OV, Kloos DU, Land S, Lewicki-Potapov B, Michael H, Münch R, Reuter I, Rotert S, Saxel H, Scheer M, Thiele S, Wingender E2003. TRANSFAC: transcriptional regulation, from patterns to profiles. Nucleic Acids Res 31:374–378 [DOI] [PMC free article] [PubMed] [Google Scholar]
- 48.Sandelin A, Alkema W, Engström P, Wasserman WW, Lenhard B2004. JASPAR: an open-access database for eukaryotic transcription factor binding profiles. Nucleic Acids Res 32:D91–D94 [DOI] [PMC free article] [PubMed]