

Abstract
Prolactin and progesterone act together to regulate mammary alveolar development, and both hormones have been implicated in breast cancer initiation and progression. Here we show that Elf5, a prolactin-induced ETS transcription factor that specifies the mammary secretory cell lineage, is also induced by progestins in breast cancer cells via a direct mechanism. To define the transcriptional response to progestin elicited via Elf5, we made an inducible Elf5 short hairpin-RNA knock-down model in T47D breast cancer cells and used it to prevent the progestin-induction of Elf5. Functional analysis of Affymetrix gene expression data using Gene Ontologies and Gene Set Enrichment Analysis showed enhancement of the progestin effects on cell cycle gene expression. Cell proliferation assays showed a more efficacious progestin-induced growth arrest when Elf5 was kept at baseline levels. These results showed that progestin induction of Elf5 expression tempered the antiproliferative effects of progestins in T47D cells, providing a further mechanistic link between prolactin and progestin in the regulation of mammary cell phenotype.
In T47D breast cancer cells direct progestin induction of the ETS transcription factor Elf5 tempers antiproliferative progestin action via regulation of cell cycle control genes.
A combination of pituitary and ovarian hormones tightly regulates reproductive function. Among these interactions prolactin (Prl) and progesterone (Pg) act together to drive a number of developmental events that include maintenance of the ovarian corpora lutea ( 1), uterine gene expression ( 2), maternal behavior (3), and mammary gland development ( 4, 5). Prl and Pg directly drive the proliferation of mammary epithelial cells to form lobuloalveolar structures during early to mid pregnancy ( 6, 7), but then Pg inhibits the lactogenic actions of Prl during the final stages of pregnancy to ensure that lactation commences only after parturition ( 8). The proproliferative activity of Pg may be elicited via the B-form of the Pg receptor causing extranuclear activation of the Src/MapK pathway to activate Cyclin D1, an activity that can be divorced from the receptor’s transcriptional activity ( 9). The antilactogenic activity of Pg is related to the ability of the B-form to prevent interaction between the proximal promoter and distal enhancer on the β-casein gene ( 10). These normal developmental mechanisms may be used by breast cancer cells, and both Prl and Pg have been implicated in the carcinogenic process in the breast ( 11, 12). Understanding the mechanistic basis for the interaction between Prl and Pg, and definition of the genomic regulatory network ( 13) responsible for lobuloalveolar development and lactation, will shed light on the normal and carcinogenic processes experienced by the mammary epithelium. An example of a regulatory motif active within this network is the regulation of Prl and Pg receptors by Prl and Pg, in both self-regulatory and cross-regulatory ways ( 14). The transcription factors within this network provide additional points through which Prl and Pg may exert regulatory influence.
A key transcription factor in the genomic network responsible for alveolar morphogenesis is Elf5, a member of the large family of ETS transcription factors, which play key roles in development, differentiation, and apoptosis and have long been implicated in the control of cellular proliferation and tumorigenesis ( 15, 16, 17, 18). A number of experiments have demonstrated that Elf5 is critical in the differentiation of the mammary gland in vivo. Elf5 expression is induced by Prl treatment of Scp2 mammary cells and is greatly reduced in Prl receptor knockout mammary glands ( 19). Retroviral reexpression of Elf5 rescued the failed alveolar development seen in these mammary glands ( 19). Elf5 can induce transcription of the milk protein gene whey acidic protein (Wap) by binding to its promoter ( 20). Elf5 heterozygote (Elf5+/−) mice show defective lobuloalveolar development and decreased milk protein gene expression during pregnancy ( 21). Elf5 knockout (Elf5−/−) mice exhibit severely impaired lobuloalveolar development, and milk production is lost ( 22, 23). These models phenocopy the effects seen in Prl receptor heterozygous and homozygous glands ( 7, 24). Additionally, in a model of inducible Elf5 expression in the mammary gland, precocious alveolar development accompanied by milk protein expression was seen in nulliparous animals ( 22). Many of these effects are due to the ability of Elf5 to regulate crucial cell fate decisions. The knockout of Elf5 caused the accumulation of CD61+ luminal progenitor cells, while induction of Elf5 caused the erosion of this population ( 22). This population has recently been hypothesized as the cell of origin for some of the basal-like breast cancers ( 25). Thus Elf5 is a key transcription factor that specifies the secretory cell lineage of the mammary gland. Recent microarray investigation of Prl and Pg action in mice has indicated that many transcriptional effects of Prl and Pg overlap and that Elf5 may be a progestin target ( 26).
The T47D human breast cancer cell line provides a well-defined model of progestin action, causing cell cycle arrest and the acquisition of lipid biosynthesis ( 27, 28, 29, 30, 31). T47D cells express Elf5, and here we demonstrate that Elf5 expression is increased by progestin treatment. We constructed a model of inducible short hairpin RNA (shRNA) expression against Elf5 in T47D cells. We used it to hold Elf5 protein at baseline levels during progestin treatment and measured the transcriptional consequences using Affymetrix expression arrays.
Results
Elf5 is up-regulated by Pg treatment in vitro and in vivo
Treatment of mice with Pg pellets for 20 d resulted in a significant increase in Elf5 expression in the mammary gland (Fig. 1A), consistent with a previous report showing up-regulation of Elf5 within 3 d of progestin treatment ( 26). We investigated the hormonal regulation of Elf5 in human breast cancer cells using the progestins ORG2058 and R5020, synthetic analogs of Pg (Fig. 1, B and C). Elf5 mRNA levels were increased with exposure to ORG2058 by 8 h of treatment in T47D and BT474 and was maintained for at least 2 d of treatment in all cell lines (Fig. 1B). Long-term experiments in T47D cells (Fig. 1C) showed the effect lasted for at least 6 d. Up-regulation in T47D cells was also observed at the protein level from 16–24 h and onwards in response to ORG2058 (Fig. 2A) and a second synthetic progestin, R5020 (Fig. 2B). Cotreatment of T47D cells with the progestin antagonist, RU486, at 10-fold molar excess abolished the effect (Fig. 2C).
Fig. 1.
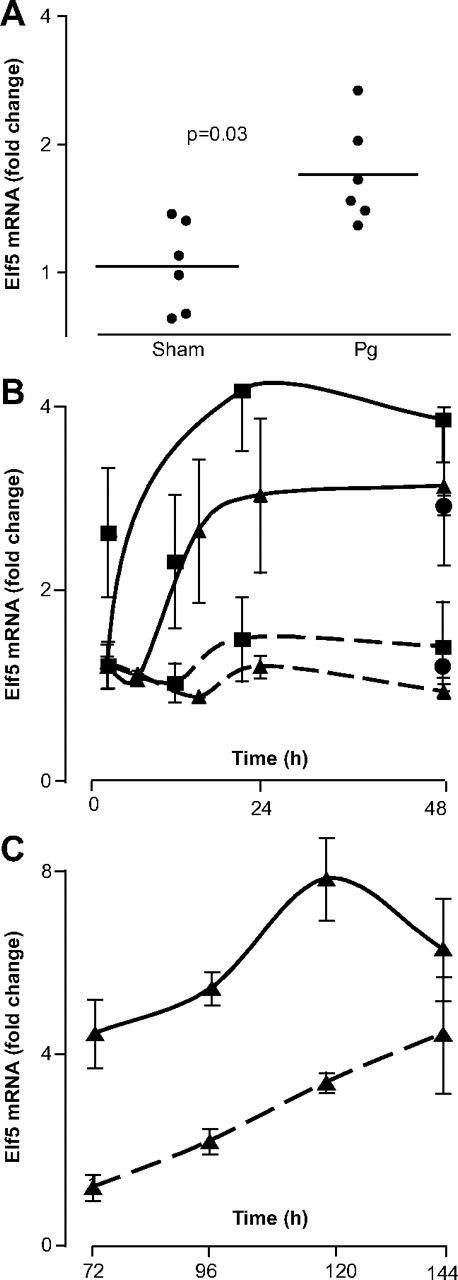
Elf5 mRNA expression is induced by progestin treatment. A, Mice were implanted sc with slow-release Pg pellets (5 mg/21 d) for 20 d before the collection of all mammary glands, which were snap frozen in liquid nitrogen before mRNA preparation using Trizol and quantitative RT-PCR to measure Elf5 mRNA levels. B and C, T47D cells were treated in triplicate with 10 nm of the progestin ORG2058 (solid line) or ethanol vehicle (dotted line) for up to 2 d (B) or for 3–6 d (C) before mRNA preparation and quantitative RT-PCR to measure Elf5 mRNA levels in T47D (▴), MCF7 (•), and BT474 (▪) breast cancer cells. Results are expressed as fold change in Elf5 expression compared with vehicle-treated cells at 4 h. Error bars represent the sem for this representative experiment.
Fig. 2.
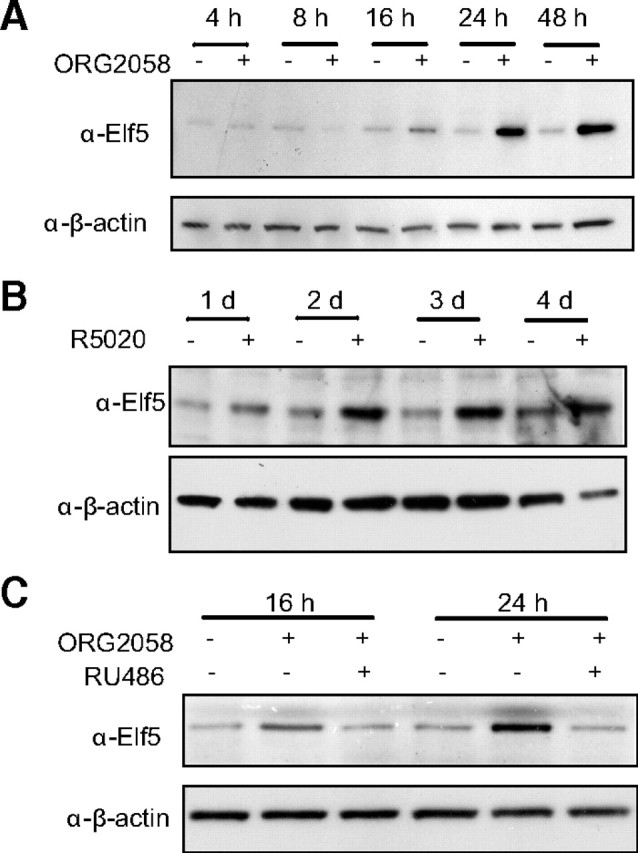
Elf5 protein expression is induced by different progestins and is antagonized by cotreatment with the Pg receptor antagonist RU486. T47D cells were treated with 10 nm of the progestins ORG2058 (A) or R5020 (B) for the indicated times before the preparation of protein lysates and Western blotting for Elf5 protein. C, Effect of a 10-fold molar excess of the Pg antagonist RU486 on ORG2058 induction of Elf5 protein levels at the times indicated. Loading controlled using reblotting for β-actin.
A whole genome survey of PR-genomic DNA interactions in T47D cells, using chromatin immunoprecipitation (ChIP) coupled with high throughput sequencing predicted PR binding within the fourth intron of the Elf5 gene (Fig. 3, top, triangle; and Graham, J. D., and C. L. Clarke, unpublished observations). Binding of PR to this region was confirmed by directed ChIP, where recruitment of PR to this region was enriched 18-fold in T47D cells after 45-min exposure to the progestin ORG2058 (10 nm), compared with vehicle-treated cells (Fig. 3). Weak binding was also confirmed to a region predicted by ChIP-seq to bind PR 30 kb upstream of the Elf5 gene (not shown). The specificity of this recruitment was demonstrated by a lack of signal when either ORG2058 or the primary antibody were absent. Together the data in Figs. 1–3 demonstrate that Elf5 is a direct transcriptional target of the Pg receptor.
Fig. 3.
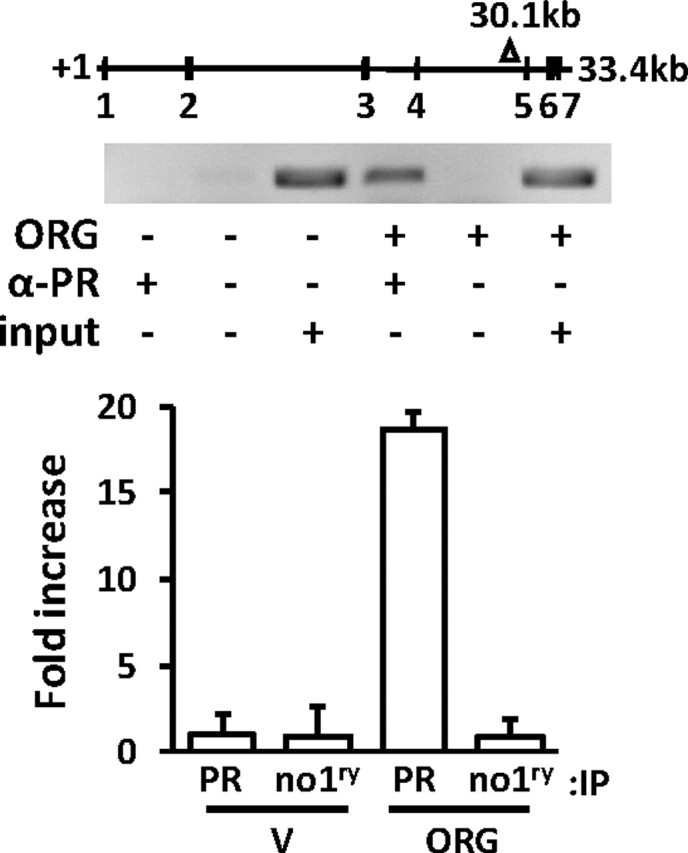
ChIP shows progestin-induced recruitment of Pg receptor to the Elf5 gene. Top, A genome-wide study of Pg receptor occupancy of DNA in response to progestin treatment of T47D cells revealed a peak of de novo binding associated with the Elf5 gene, 30.1 kb from the start site. Middle and bottom, qPCR was used to quantify this de novo binding of Pg receptor, under the conditions indicated. ORG, 10 nm ORG2058 treatment; α-PR, Pg receptor antibody; no1ry Ab, no primary antibody; input, input genomic DNA control, V, ethanol vehicle, IP, immunoprecipitation.
Establishment of a system to investigate the role of Elf5 in progestin-induced proliferation in T47D breast cancer cells
We generated a stable inducible Elf5 shRNA T47D cell line by inserting an shRNA designed against Elf5 into the pHUSH vector system, as previously described ( 32). Upon treatment with doxycycline the expression of endogenous Elf5 is rapidly repressed and remains so over the long-term. Importantly, in the presence of progestin treatment, the Elf5 shRNA holds down progestin induction of Elf5, and Elf5 levels remain stable at preprogestin levels (Fig. 4). As a control, we also generated stable T47D cells carrying the pHUSH construct with anti-EGFP shRNA. Elf5 levels were not affected in this model, and the progestin induction of Elf5 expression occurred regardless of induction of the shEGFP construct with doxycycline (Fig. 4). Supplemental Fig. 4 shows the combined results of five individual experiments and shows that over multiple experiments this system produced consistent results for shElf5 knock-down of Elf5 expression, both with and without progestin induction, whereas shEGFP was without effect on Elf5 expression. (Supplemental Figures are numbered to correspond to figures in the printed article, and Supplemental Tables are numbered to correspond to experimental groups; therefore, the Supplemental Data are not cited in numerical order.)
Fig. 4.

Construction of a model to prevent the progestin-induced rise in Elf5 expression. T47D cells were stably transduced with the pHUSH vector conferring doxycycline-inducible expression of a sh-RNA directed against Elf5 (shElf5) or against EGFP (shEGFP). Elf5 protein was detected by Western blot at 4 d of treatment. The rise in Elf5 protein induced by treatment with 10 nm ORG2058 was prevented by simultaneous induction of Elf5 shRNA by doxycycline, which maintained Elf5 protein at pretreatment levels for 4 d. Induction of shEGFP with doxycycline was without effect on Elf5 expression. Loading controlled with β-actin.
Identification of genes regulated by progestins and Elf5
We used Affymetrix expression arrays to determine to what extent Elf5 mediated the transcriptional effects of progestins in T47D cells. We transcript profiled our inducible Elf5 hold-down model using triplicate independent experiments under three conditions: 1) treatment with ethanol vehicle only (Baseline), 2) ORG2058 treatment for 4 d (Pg), and 3) doxycycline and ORG2058 treatment for 4 d, (Pg-Elf5) designed to prevent the progestin-induction of Elf5 expression.
To assess the extent of differential gene expression between the three possible pair-wise comparisons, we applied an empirical Bayes moderated t-statistic to the normalized expression levels for each probe set on the microarray. P values for each probe set were adjusted for multiple testing by the BY procedure. A detailed description of the differentially regulated probe sets can be found in the Supplemental Text entitled “Supplementary text, diferentially expressed genes.” In brief we found 3137 probe sets with significant changes in gene expression from baseline in response to either Pg treatment (2644 probes sets BY < 0.05) or Pg-Elf5 (2680 probe sets BY > 0.05). The comparison of Pg vs. Pg-Elf5 identified a number of differentially expressed probe sets in response to prevention of the progestin-induced rise in Elf5. A global view of these results is provided by Fig. 5, which shows a hierarchical clustering of gene expression. Some areas of differentially expressed genes have been magnified. The complete heat map with all genes can be found in Supplemental Fig. 5A. Note that Elf5 expression is induced by progestin but remains at baseline levels with induction of shElf5. The complete spreadsheet (8MB .zip) is available from the corresponding author. The most differentially expressed probe sets can be found in the Supplemental Tables 7, 9, 11, and 13.
Fig. 5.
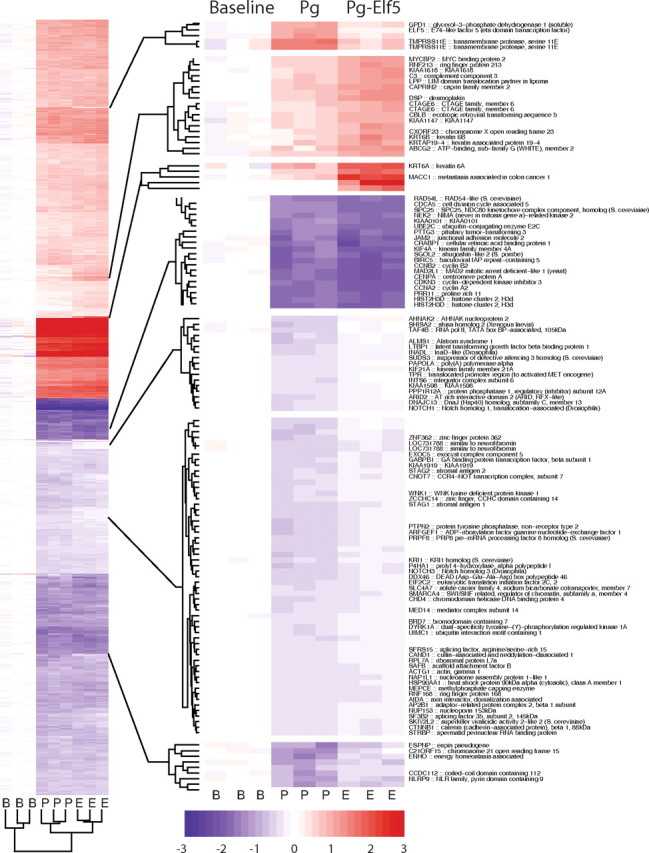
Gene expression changes induced by treatment of T47D cells with progestin, with and without the rise in Elf5 expression. T47D cells were treated with vehicle (Baseline, B), 10 nm of the progestin ORG2058 (Pg, P) or progestin and doxycycline (Pg-Elf5, E) to prevent the rise in Elf5, for 4 hours before interrogation of global change in gene expression using Affymetrix arrays. Results are presented as a hierarchically clustered heat map of expression (row normalized, color key shows relative expression levels) of the probe sets that showed differential expression in the comparisons of Baseline to Pg or Baseline to Pg-Elf5. Some features are expanded to show probe set identities. Data are derived from three independent experiments, each carried out in triplicate.
Figure 5 and Supplemental Fig. 5 show that progestins exerted a major transcriptional effect in T47D cells. We used quantitative PCR to validate these array results for a panel of 10 genes that showed modification of the progestin-effect on gene expression by induction of shEl5 (Supplemental Fig. 5B). Near identical effects of shElf5 on the change in direction and magnitude of gene expression were observed for all 10 genes regardless of whether Affymetrix chips or qPCR was used. Thus prevention in the rise of Elf5 led to the identification of a subset of genes that were regulated by progestins via induction of Elf5.
Functional analysis of the transcriptional changes induced by progestin and Elf5 and identification of common ontologies and enriched gene sets
Extracting functional understanding from lists of differentially regulated probe sets is a major challenge posed by array technology. Two major approaches have been developed, those using human annotation of function, such as gene ontologies (GO; http://www.geneontology.org/) ( 33), or pathway analysis provided by the Kyoto Encylopedia of Genes and Genomes (KEGG; http://www.genome.jp/kegg/) ( 34), and those that use techniques that search for the enrichmenot of signatures defined by empirical means, such as GSEA (http://www.broadinstitute.org/gsea) ( 35, 36). We used DAVID (http://david.abcc.ncifcrf.gov/home.jsp) ( 37) and GSEA to seek functional understanding of both progestin action and of the portion regulated via induction of Elf5.
Gene ontologies
Looking first at progestin action, DAVID identified a number of significantly enriched GO categories related to immune function among the significantly up-regulated probe sets (P < 0.05) in the comparisons Baseline vs. Pg and Baseline vs. Pg-Elf5 (Supplemental Tables 1 and 3). GO categories related to proliferation and cell cycle control were enriched among the significantly down-regulated genes (Supplemental Tables 2 and 4).
Turning to the contribution of Elf5 to these processes, significant (P < 0.001) GO terms identified among the genes up-regulated in the comparison of gene expression between Pg-Elf5 vs. Pg treatment showed a dominance of Spectrin repeat sequence-containing ontologies (Supplemental Table 5); however, these ontologies were not present among those enriched in the progestin only treatment sets suggesting an independent action of Elf5. Among the down-regulated sets we found a number of GO sets related to cell cycle control (Supplemental Table 6), despite identical progestin treatment in both arms of the comparison, indicating that preventing the progestin-induced rise in Elf5 had amplified the cell cycle effects of progestin treatment. We also investigated the enriched genes and ontologies in subgroups defined by the direction of movement in gene expression in response to progestin and Elf5 hold-down (Supplemental Tables 7–14). This analysis showed strong enrichment of cell cycle ontologies in a set of genes that decreased with progestin treatment and decreased further in expression when Elf5 was knocked down.
Gene set enrichment analysis
We ranked all probe sets by their moderated t statistic, which represents the differential expression of each probe set for the three possible comparisons, Pg vs. Baseline, Pg-Elf5 vs. Baseline, and Pg-Elf5 vs. Pg. All the probe sets were ranked by this t statistic, and we asked whether portions of any previously defined gene lists were significantly over-represented at the extremes of our ranked list, using the GSEA the gene sets from the Molecular Signature (MolSig) database implementation available via the Broad Institute. Importantly, and unlike the Gene Ontology/DAVID analysis, this approach does not require the use of arbitrary cut-off values for defining genes of interest and is able to find patterns of gene expression from within the entire data set guided by empirically defined functional relationships among genes. The complete results of the GSEA (1.5GB .tar.gz) can be obtained from the corresponding author.
We used CAT plots of these ranked gene lists to provide an overview of the GSEA data and to identify comparisons that revealed the biological activity of progestins and Elf5. The comparison between baseline expression and progestin treatment with, or without, Elf5 hold-down will firstly identify the set of progestin-regulated gene sets and secondly those gene sets that showed altered enrichment with hold-down of Elf5.
We first examined the correspondence between gene sets produced by the Pg vs. Baseline comparison, with gene sets produced by Pg-Elf5 vs. Baseline comparison. We asked to what extent we found sets in common as we moved down the list starting at the largest positive normalized enrichment score (NES) and moving toward the negative end of the list (+NES->−NES) for each comparison, (Fig. 6A, red line). We observed an essentially horizontal line running between 80% and 100% in common as the size of the list increased. This indicates a very high correspondence in the order of gene sets in these two lists, consistent with a modest transcriptional effect of Elf5 hold-down relative to the large transcriptional effect produced by progestin treatment. When we looked for correspondence between lists of gene sets enriched by the Pg-Elf5 vs. Pg and those produced by the Pg vs. Baseline, we observed a 45-degree line (green line) indicating a random accumulation of gene sets in common, and thus no strong relationship between gene sets enriched due to Elf5 hold-down and those enriched due to progestin action. A similar observation was made for the Pg-Elf5 vs. Baseline V. Pg-Elf5 vs. Pg CAT analysis (black line). Thus for the positively enriched sets the bulk of the transcriptional effect of Pg occurs regardless of whether Elf5 is held down to baseline or is allowed to rise with progestin treatment.
Fig. 6.
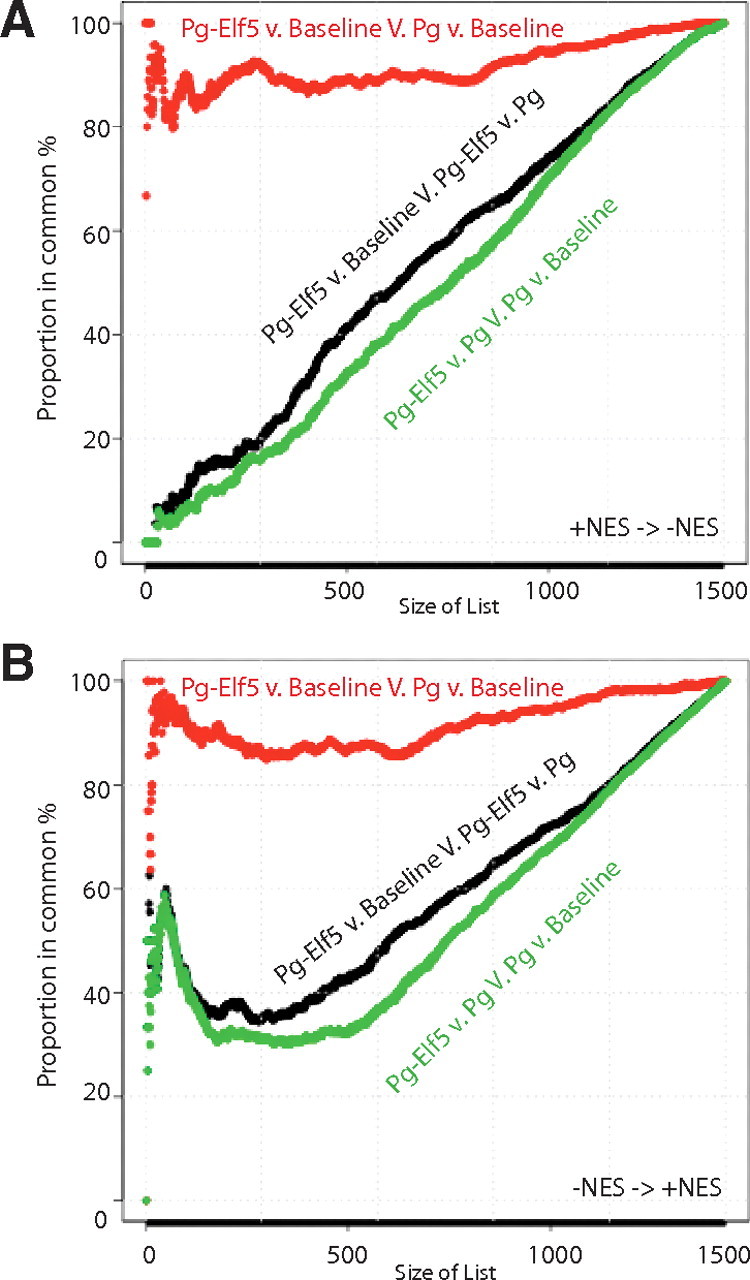
Correspondence at the top plots to examine changes in gene sets identified by gene set enrichment analysis. Gene set enrichment analysis was used to identify gene sets that were enriched in each of the two-way comparisons among baseline, progestin treated (Pg), and progestin-treated and Elf5 hold-down (Pg-Elf5) groups. These sets of gene sets were then compared with highlight gene sets that were differentially responsive to Pg and Pg-Elf5. Correspondence at the top plots identified gene sets that showed discordant regulation when the combinations shown in the Figure were examined, moving down the list from positive normalized enrichment score (NES) (A) or up the list from negative NES (B). The identities of the most discordant gene sets are given in Supplemental Table 15).
When we examined gene sets that were negatively enriched (Fig. 6B), an effect of the hold-down of Elf5 was apparent. At list sizes of less than 100 gene sets we observed a prominent tail of lower rates of correspondence between the negatively enriched gene sets from the Pg-Elf5 vs. Baseline comparison and the Pg vs. Baseline comparison (Fig. 6B, red line), indicating that the loss of Elf5 was perturbing the effect of Pg. We also observed higher rates of correspondence than that produced by random accumulation when we compared the Pg-Elf5 vs. Pg gene sets with Pg vs. Baseline gene sets, (Fig. 6B, green line) and for the Pg-Elf5 vs. Baseline vs. Pg-Elf5 vs. Pg analysis (black line), again showing that hold-down of Elf5 was perturbing Pg action. Thus the CAT analysis revealed the presence of gene sets regulated by progestin via induction of Elf5 primarily among the negatively enriched gene sets. The identity of these gene sets is provided in Supplemental Table 15 and is sorted by the magnitude of change in their rank order between lists.
Application of a new way to view the results of gene set enrichment analysis
The leading-edge tool provided by GSEA allows comparisons between significant gene sets to be made based upon the similarity of the leading-edge genes from each relevant gene set. The tool does not allow the comparison of gene sets from multiple treatment comparisons; in addition, if we compare the significant gene sets obtained from two comparisons by just the name of the gene set, there is the potential for the same gene set to be enriched with very little overlap among the leading-edge genes, especially for large gene sets that contain distinct signatures representing multiple biological processes. To overcome this problem we developed a novel gene set comparison technique to visualize the similarity between gene sets from multiple GSEA runs, using hierarchical clustering based on the leading-edge genes (Cowley, M. J. unpublished observations). We applied this technique to highlight the progestin-induced changes mediated by Elf5.
We identified 489 Elf5-responsive gene sets from the comparison Pg-Elf5 vs. Pg (FDR < 25%) and 623 progestin-regulated gene sets using the comparison Pg vs. Baseline (FDR < 25%), and then combined the Elf5 and Pg sets to give 1,112 gene sets. We then computed the distance between all possible pairs of gene sets using the jacquard, summarized the relationships between gene sets using hierarchical clustering, and visualized the resulting dendrogram in a high-resolution image (Supplemental Fig. 1). This technique transforms the output of GSEA from two separate lists into a visual representation of function, which greatly simplifies the task of extracting information regarding function from array experiments.
The degree of overlap among the leading-edge genes is shown by the position of the gene set name across the page, with 100% overlap to the far left and 0% to the far right. Gene sets containing many of the same genes form trees. The trees so produced are based on shared gene expression signatures and identify discrete functional activities due to progestin, Elf5, or their combined action. The discrete aspects of Pg action are clearly seen, for example, in trees representing the inflammatory response containing a majority of sets from the Pg vs. Baseline comparison. Where trees combine gene sets from both Pg vs. baseline (Pg-regulated genes) and Pg vs. Pg-Elf5 (Elf5-regulated genes) they represent the combined action of progestin and Elf5, so identifying the genes we seek (highlighted in blue in Supplemental Fig. 1). This technique excludes associations that would be made using gene set names alone. For example the UVC gene sets appear in both the Baseline vs. Pg and the Pg vs. Pg-Elf5 comparisons and show a large change in rank order in our CAT analysis (Supplemental Table 15); however, these sets were demonstrated by this technique to contain less than 10% overlap in their leading-edge genes (Supplemental Fig. 1 and the UVC set shown in Supplemental Fig. 2).
Role of Elf5 in progestin-regulated gene expression
Supplemental Fig. 1 contains a number of large trees composed of gene sets representing cell cycle control. This is due to the potent cell cycle effects of progestins in T47D. Interestingly these trees also contained a high proportion of gene sets from the Pg vs. Pg-Elf5 comparison, indicating that Elf5 also plays a role in the progestin regulation of the cell cycle. As detailed above this effect was detected for just a handful of cell cycle genes using P values and DAVID analysis using GO terms, but using our clustering of the GSEA the full magnitude of this effect became apparent. Figure 7 presents a few trees from Supplemental Fig. 1 together with heatmap diagrams providing expression levels for the leading-edge genes, while Supplemental Fig. 7A provides this data for all cell cycle related trees in Supplemental Fig. 1. When we examined heat maps representing expression levels of the leading-edge genes we observed that hold-down of Elf5 acted across a number of cell cycle-related gene signatures to generally enhance the action of progestin, which in the majority of cases led to further decreases in the expression of a large number of cell cycle regulatory genes. This effect is characterized by a small further change in individual gene expression across a large number of functionally related genes. Importantly, these gene sets were defined experimentally by conditions chosen to exert cell cycle effects, such as the removal and then readdition of serum or cytokines, genotoxin treatment, direct manipulation of cell cycle genes like cyclinD3, myc, p21, POD1, or E2A. Manually annotated cell cycle lists were also prominent here.
Fig. 7.

Hierarchical clustering of enriched gene sets reveals cell cycle control gene sets that are regulated by progestins and the progestin-induced rise in Elf5. Gene set enrichment analysis identified gene sets that were progestin regulated (Baseline vs. Pg) and gene sets that were regulated by the progestin-induced rise in Elf5 (Pg vs. Pg-Elf5). We clustered the gene sets identified in this way using their leading-edge genes to produce a visualization of progestin and Elf5 action in T47D cells. The full results are shown in Supplemental Fig. 1 and the details of some of the clusters are expanded with heat maps in Supplemental Figs. 6–8. Here we show a small excerpt of the cell cycle-related gene set families. The degree of relatedness of the leading-edge genes are indicated by the horizontal position of the gene set name. Gene expression heatmaps of the leading-edge genes for the indicated sets are shown (color scale as for Fig. 6).
Our clustering technique also identified additional functions of Elf5 in the context of progestin action. Hold-down of Elf5 was also observed to suppress progestin action. This effect was most prominent for gene sets representing mRNA processing (Supplemental Fig. 7B). We also observed a series of large gene sets where hold-down of Elf5 resulted in both enhancement and suppression of progestin action (Supplemental Fig. 7B). These gene sets resulted from experiments profiling stem cells, the effects of reovirus infection, or diabetes on the kidney and are very likely to contain a number of overlapping and independent transcriptional signatures representing the complex phenotypes and/or pathology under investigation.
A third group of gene sets was identified where strong repression of gene expression by Elf5 was observed together with a mixed or weak response to progestin. These gene sets were dominated by signaling pathways, including ErbB, PI3K, Notch, MTOR, and EGF, indicating Elf5 regulatory action with greater independence from Pg than seen in the other gene sets discussed above (Supplemental Fig. 7C).
Effect of Elf5 hold-down on T47D cell proliferation
The transcript profiling experiments showed that hold-down of Elf5 enhanced the ability of progestin to regulate the expression of a large number of cell cycle control genes. We hypothesized that this effect may alter the potency or efficacy of progestin treatment of T47D cells. We used MTS assays to address this question using simultaneous dose response and time course experiments to search for a shift in sensitivity, time of onset, or greater effect of progestin treatment (Fig. 8). A dose-dependent decrease in MTS signal was observed at progestin concentrations above 1 nm at a variety of time points that were examined, reproducing the effect of progestin originally described in the parental line. Hold-down of Elf5 increased the effect of R5020 at concentrations above 1 nm, as seen by the further reduction in MTS signal. There was no horizontal shift in the dose response or change in the timing of the effect of progestin. In the shEGFP control cell line, the induction of shEGFP with doxycycline was without effect, demonstrating that the increased efficacy observed with Elf5 hold-down was not due to nonspecific effects of doxycycline or expression of an exogenous shRNA. These experiments show that the progestin was more effective at inhibiting cell proliferation when the progestin-induced rise in Elf5 expression was prevented.
Fig. 8.
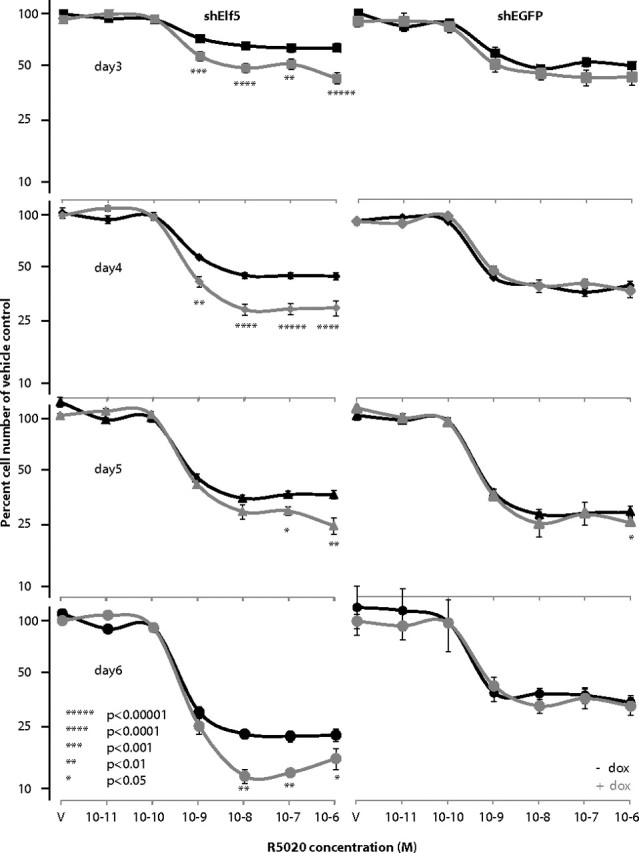
Effect of Elf5 hold-down on cell proliferation in T47D cells. MTS assay of cell number in response to doxycycline (+dox) induction (black lines) of shElf5 (graphs on right), shEGFP (graphs on left), or no doxycycline (−dox) treatment (gray lines on both sides) at the indicated concentrations of R5020 (V = vehicle only) for the indicated times of treatment. Data are derived from a combination of three independent experiments, each conducted with six replicates, by normalization to average cell number observed in vehicle-only control wells before averaging and calculation of P values (P) using Student’s t test.
Discussion
Elf5 is an ETS transcription factor critical for proliferation and differentiation of the mammary gland in vivo. Here we have demonstrated that Elf5 expression is directly induced by Pg in both the mouse mammary gland in vivo and in T47D breast cancer cells in vitro. We have shown that progestin induction of Elf5 moderated the progestin regulation of cell cycle genes and increased the efficacy of the antiproliferative action of progestin.
In this model of progestin action, treatment of T47D cells with progestins induced cell cycle arrest in early G1 phase and forced cells in late G1 to rapidly enter and transit S-phase, which caused a peak of S-phase cells at 12 h of treatment and accumulation in G1 that became maximal by 30 h of treatment ( 27, 30). Progestins caused an increase in Elf5 protein from 16–24 h, ruling out any role for Elf5 in the forced cell cycle entry of late G1 cells. From 24 h, T47D cells show an increase in lipid production and alteration in cell morphology that had been interpreted as a differentiation event ( 30).
Our expression array experiments identified a number of key cell-cycle control genes that are regulated by progestins. Using P values we found cell division cycle-associated 5, SPC25, NDC80 kinetochore complex component and CDC28 protein kinase regulatory subunit 2. These genes are involved in promoting mitosis or cell cycle progression ( 12, 38, 39). Using a hierarchal clustering technique we developed to enhance the utility of GSEA we were able to greatly expand this list by the identification of five distinct families of gene sets involved in cell cycle regulation. Examination of the expression of the common leading-edge genes from these sets showed a dominant pattern of regulation, where progestin treatment resulted in a large fall in the expression of these genes, and concomitant prevention of the rise in Elf5 produced an additional fall in their level of expression. Prominent examples include cyclins A1, A2, B1, B2, and E1. Cyclin E1 showed a muted response to R5020 but a strong response to Elf5 hold-down in comparison with the other cyclins. Other genes exhibiting this behavior included Annexin A8, TCN2, EGR1, SPP1, and GJa4. Cell cycle regulators such as cyclin-dependent kinases regulatory subunit 2, cyclin-dependent kinase inhibitor 3, and a variety of DNA replication factors such as PCNA and the CDC proteins were also found to be further suppressed with Elf5 hold-down. Where progestin treatment caused a rise in gene expression, hold-down of Elf5 caused a less substantial rise in expression to occur, such as seen for SDC1, FOSB, SEC61B, SOX21, and MYH8, for example. These observations provide the mechanistic underpinnings for our observed increase in the efficacy of R5020 with Elf5 hold-down. Elf5 exerts proproliferative activity via the expression of key cell cycle regulatory genes, which tempers the antiproliferative effects of R5020 in T47D cells. A similar proproliferative action of Elf5 has been observed in heterozygous ( 21) and homozygous knockout (22) of Elf5. Induction of Elf5 caused the production of milk proteins in virgin mice ( 22), and support for a similar effect on differentiation in T47D cells can be found in changes in some of the lipogenic enzymes such as GPD1.
Less prominently we also observed gene sets with other responses to Elf5 hold-down. Five families of gene sets were identified that either showed further increase in expression with Elf5 hold-down or which moved in the opposite direction with Elf5 hold-down and progestin treatment than with progestin treatment alone. Most prominent here are genes involved in mRNA processing. These genes generally showed decreased expression compared with baseline with progestin treatment but displayed increased expression compared with baseline when the progestin-induced rise in Elf5 was prevented. Examples include DICER1, splicing factors such as SFRS12 and SNRPN, and polyadenylation enzymes like PAPOLA.
Also exhibiting this behavior were signaling molecules NOTCH1, ROCK2, IQGAP1, and transporter ABCC1 to name just a few. These latter genes were derived from large gene sets defined by experimental events with broad effect, such as diabetic kidney, viral infection, UV exposure, profiling of stem cells, and treatment with histone deacetylase inhibitors. This set of empirically related genes probably represents the signature of undiscovered or unrecognized biological functionality that could not be detected using P values alone to build gene sets. The application of hierarchical clustering to GSEA output provides a way to build gene lists based on relationships that have been defined experimentally and may prove to be a superior method to those that operate without reference to previously defined signatures.
Pg may modulate Elf5 expression to provide a way of potentiating the activity of related pathways, such as growth factor receptor or hormone receptor pathways. For example, A kinase anchor protein 13 (Supplemental Table 7) has been reported to bind the estrogen receptor (ER) and modulate ER signaling ( 40), and microtubule-associated protein 2 (also identified in Supplemental Table 7) has been shown to interact with Src and Grb2 ( 41), both of which are members downstream of the Prl receptor signal transduction pathway. Cross talk between Pg and various other signaling pathways has previously been proposed to account for seemingly paradoxical effects of Pg on cell proliferation ( 42, 43, 44).
Our GSEA hierarchal clustering found seven families of genes involved in signaling events that were regulated by Elf5 hold-down to a much greater extent than by progestin treatment, as demonstrated by the absence of Pg-only gene sets in the clusters. Examination of the heat maps showed progestin regulation of some individual gene set members. Most prominent among these gene sets with muted response to progestin was the MTOR pathway, including genes such as PIK3R1, PDPK1, ULK1 (not Pg responsive), and PTEN (strongly Pg responsive). The Notch pathway (Notch 1, 2, and 3) showed differential responses to Pg when Elf5 was knocked down. The phosphatidyl inositol, integrin, and ERBB signaling pathways all showed strong responses to Elf5 hold-down with mixed responses to progestins. Decreased cell adhesion has previously been demonstrated both in the mammary glands of PgR transgenic mice ( 45) and in T47D cells upon prolonged progestin treatment ( 46). In addition, recent data from a microarray analysis performed on primary mouse mammary epithelial cells treated with R5020 has suggested that progestins modify cell adhesion through the regulation of numerous extracellular matrix genes ( 47). Involvement of Pg in tumorigenesis and MAPK signaling in T47D is also well established ( 12, 48), and our data are consistent with these findings and suggest Elf5 as a modulator of these effects.
GSEA is in its infancy. The integration of automated interrogation of GSEA output with machine derivation of gene sets from electronic databases and new statistical and computational enrichment techniques offers an expansion in the utility of this technique that may allow fundamental transcriptional signatures to emerge from the empirical data. The key feature of GSEA is that the gene sets are defined by the quantitative biological response to experimentation, not by human interpretation. The clustering of gene sets using their leading-edge genes provides another step in the direction toward improved extraction of functional understanding from transcriptional data.
Overall, the data obtained from this analysis have shown that in T47D breast cancer cells, and by analogy also in other mammary epithelial cells, Elf5 expression may be important in Pg-mediated regulation of processes relating to cell cycle control, adhesion, and cell signaling.
Materials and Methods
In vivo Pg treatments
Experiments involving mice were performed under the supervision of and in accordance with the regulations of the Garvan/St. Vincent’s Animal Experimentation Committee. All animals were housed with food and water ad libitum with a 12-h light, 12-h dark cycle at 22 C and 80% relative humidity. A 5-mg Pg 21-d release pellet (Innovative Research of America, Sarasota, FL) was implanted sc on the dorsal side of each mouse. Control mice received a sham operation. Mammary glands were collected 20 d after pellet implantation and were snap-frozen in liquid nitrogen. Total RNA was prepared for real-time PCR analysis from homogenized mammary glands using Trizol reagent according to the manufacturer’s instructions (GIBCO/Invitrogen, Victoria, Australia).
Cell culture
T47D cells were cultured in RPMI 1640 medium supplemented with 10% fetal calf serum (Thermotrace, Noble Park, Victoria, Australia) and insulin (10 mg/ml, Actrapid, Novo Nordisk, Baulkham Hills, New South Wales, Australia). T47D-EcoR cells for retroviral infection were generated as described previously ( 49). A retroviral single vector system that enables doxycycline-regulated RNAi (pHUSH) expression was obtained from Genentech Inc., San Francisco, CA ( 32), and the shRNA Elf5-pHUSH constructs were generated according to the methods detailed previously ( 32). Elf5 repression was achieved by treatment with doxycycline at 0.1 μg/ml (Clontech, Palo Alto, CA). Pg stimulation experiments involved treating T47D cells with 10 nm ORG2058 (Amersham Australia), RU486 (Roussel-Uclaf, Romainville, France), MPA (Upjohn Pty Ltd., Sydney, Australia), and R5020 (Du Pont Ltd., Sydney, Australia).
RNA extraction, quantitation, and analysis
Total RNA was extracted using the RNeasy Minikit (QIAGEN, Doncaster, Victoria, Australia) as described in the manufacturer’s instructions. For Affymetrix GeneChip analysis, RNA quality was assessed by RNA Nano LabChip analysis on an Agilent Bioanalyzer 2100 (Agilent Technologies, Palo Alto, CA). Affymetrix GeneChip Array processing occurred at the Ramaciotti Centre for Gene Function Analysis, University of New South Wales. For real-time quantitative PCR, single-stranded cDNA was produced by reverse transcription using the Reverse Transcription System (Promega, Annandale, New South Wales, Australia) according to manufacturer’s instructions. Quantitative PCR was performed using the TaqMan probe-based system on the ABI Prism 7900HT Sequence Detection System (Applied Biosystems, Scoresby, Victoria, Australia). All reagents and Gene Expression Assays (mouse Elf5; Mm00468732_m1, human Elf5; Hs00154971_m1, GAPDH; 4352339E) were purchased from Applied Biosystems.
Protein extraction and analysis
Protein samples were prepared from cell lines lysed in ice-cold normal lysis buffer [50 mm HEPES (pH 7.5), 150 mm NaCl, 10% glycerol, 1% Triton X-100, 1.5 mm MgCl2, 1 mm EDTA, 10 mm pyrophosphate, 100 mm NaF] containing protease and phosphatase inhibitor cocktail tablets (Roche, Basel, Switzerland). Lysates were prepared in NuPAGE LDS Sample Buffer and NuPAGE Sample Reducing Agent (Invitrogen) and separated on NuPAGE Bis-Tris acrylamide gels run in MOPS buffer (Invitrogen), followed by transferring to PVDF membranes (Bio-Rad, Hercules, CA). The membranes were incubated overnight with Elf5 (N19; Santa Cruz Biotechnology, Santa Cruz, CA) and α-β-actin (Sigma, St. Louis, MO) primary antibodies. Horseradish peroxidase-linked secondary antibodies were used to detect a signal by enhanced chemiluminescent detection.
Cell proliferation
T47D cells carrying an inducible short hairpin RNA directed against Elf5 or enhanced green fluorescent protein (EGFP) were plated in replicate 96-well plates at a seeding density of 2000 cells per well, using medium described above supplemented Puromycin at 2 μg/ml in the presence or absence of doxycycline. Six replicates were set up for each treatment. The following day, cells were treated with various concentrations of progestin R5020 (Pg) or vehicle control and were allowed to grow for up to 6 d after Pg treatment. Growth at each time point was measured using the CellTiter 96 Aqueous Non-Radioactive Cell Proliferation Assay (Promega). Medium was supplemented with fresh doxycycline daily to ensure optimum activity of the inducer.
Microarray analysis
Microarray analysis was carried out at the Ramaciotti Centre for Gene Function Analysis at the University of New South Wales. Each condition was carried out in triplicate, and each replicate was a pool of three wells, to minimize experimental variation. RNA was hybridized to Affymetrix Human Gene 1.0 ST Gene Arrays. Quality control analysis using Affymetrix Expression Console software revealed that the quality of the arrays was high. Normalization of the arrays was performed using the Probe Logarithmic Intensity ERror (PLIER) algorithm as implemented in the Affymetrix Power Tools (version 1.8.5; www.affymetrix.com). CEL files from all nine arrays were normalized together. All statistical analyses were carried out in the R statistical programming language (version 2.8.0). The data were analyzed for differential expression using an empirical Bayesian moderated t statistic, implemented in limma ( 50), comparing Pg-treated and Baseline cells, Elf5-KD and Baseline cells, and finally Elf5-KD and Pg-treated cells. The P values obtained for each comparison were adjusted for multiple testing using the Benjamini-Yekutieli (BY) correction, implemented in the multtest package in R ( 51, 52).
Functional annotation analysis
Functional annotation analysis of sets of selected genes was carried out using the gene-enrichment annotation analysis tools within the Database for Annotation, Visualization, and Integrated Discovery (DAVID) version 2008 (DAVID web site; http://david.abcc.ncifcrf.gov/home.jsp/). Categories analyzed included gene ontology (GO) categories (Biological Process, Molecular Function, and Cellular Component), protein domain categories (InterPro Name, Superfamily Name, SMART Name), pathways databases (BBID, BioCarta, KEGG Pathways), functional categories (COG/KOG Ontology, Sp Pir Keywords, Up Seq Feature), and a disease category (Genetic Association Database). The BY correction for multiple testing was applied to the EASE scores, and the significance threshold set at adjusted P ≤ 0.05. Gene set enrichment analysis (GSEA) was performed as described previously ( 53) with the following alterations. We created a custom chip file for the Affymetrix Human Gene 1.0 ST array, using the csv annotation file available from Affymetrix (version na28; www.affymetrix.com). From the limma analysis, we used the t statistic to represent each gene, thereby creating a preranked list for each comparison. For genes with multiple probe sets, we used the t statistic from the probe set that had the largest absolute t statistic. We then used these preranked lists as input to GSEA in preranked mode [v2 ( 35)], using the c2_all curated collection of gene sets from the Molecular Signatures Database [v 2.5 ( 35)], using 1000 permutations to estimate the false discovery rate to assess statistical significance.
Correspondance at the top (CAT) plots are discussed by Irizarry et al. ( 54). Software for CAT plots and the gene set hierarchical clustering analysis, including detailed methods, are detailed in Cowley M. J. (unpublished observations) and are available from the corresponding author.
NURSA Molecule Pages:
Ligands: ORG 2058 | R5020 | RU486;
Nuclear Receptors: PR.
Footnotes
This work was supported by research grants, fellowships, and scholarships from the National Health and Medical Research Council of Australia, the New South Wales Cancer Council, The Cancer Institute New South Wales, the Australian Cancer Research Foundation, National Breast Cancer Foundation, Australian Research Council, and Banque Nationale de Paris–Paribas Australia and New Zealand.
Disclosure Summary: The authors have nothing to declare.
First Published Online June 2, 2010
Abbreviations: BY, Benjamini-Yekutieli; CAT, correspondence at the top; ChIP, chromatin immunoprecipitation; DAVID, Database for Annotation, Visualization, and Integrated Discovery; EGFP, enhanced green fluorescent protein; GO, gene ontology; GSEA, gene set enrichment analysis; MTS, 3-(4,5-dimethylthiazol-2-yl)-5-(3-carboxymethoxyphenyl)-2-(4-sulfophenyl)-2H-tetrazolium; NES, normalized enrichment score; Pg, progesterone; Prl, prolactin; shRNA, short hairpin RNA.
References
- 1.Binart N, Helloco C, Ormandy CJ, Barra J, Clément-Lacroix P, Baran N, Kelly PA2000. Rescue of preimplantatory egg development and embryo implantation in prolactin receptor-deficient mice after progesterone administration. Endocrinology 141:2691–2697 [DOI] [PubMed] [Google Scholar]
- 2.Brosens JJ, Hayashi N, White JO1999. Progesterone receptor regulates decidual prolactin expression in differentiating human endometrial stromal cells. Endocrinology 140:4809–4820 [DOI] [PubMed] [Google Scholar]
- 3.Lucas BK, Ormandy CJ, Binart N, Bridges RS, Kelly PA1998. Null mutation of the prolactin receptor gene produces a defect in maternal behavior. Endocrinology 139:4102–4107 [DOI] [PubMed] [Google Scholar]
- 4.Oakes SR, Hilton HN, Ormandy CJ2006. Key stages in mammary gland development - The alveolar switch: coordinating the proliferative cues and cell fate decisiosn that drive the formation of lobuloalveoli from ductal epithelium. Breast Cancer Research 8:207. [DOI] [PMC free article] [PubMed] [Google Scholar]
- 5.Soyal S, Ismail PM, Li J, Mulac-Jericevic B, Conneely OM, Lydon JP2002. Progesterone’s role in mammary gland development and tumorigenesis as disclosed by experimental mouse genetics. Breast Cancer Res 4:191–196 [DOI] [PMC free article] [PubMed] [Google Scholar]
- 6.Lydon JP, DeMayo FJ, Funk CR, Mani SK, Hughes AR, Montgomery CAJ, Shyamala G, Conneely OM, O'Malley BW1995. Mice lacking progesterone receptor exhibit pleiotropic reproductive abnormalities. Genes Dev 9:2266–2278 [DOI] [PubMed] [Google Scholar]
- 7.Ormandy CJ, Camus A, Barra J, Damotte D, Lucas B, Buteau H, Edery M, Brousse N, Babinet C, Binart N, Kelly PA1997. Null mutation of the prolactin receptor gene produces multiple reproductive defects in the mouse. Genes Dev 11:167–178 [DOI] [PubMed] [Google Scholar]
- 8.Neville MC, McFadden TB, Forsyth I2002. Hormonal regulation of mammary differentiation and milk secretion. J Mammary Gland Biol Neoplasia 7:49–66 [DOI] [PubMed] [Google Scholar]
- 9.Boonyaratanakornkit V, McGowan E, Sherman L, Mancini MA, Cheskis BJ, Edwards DP2007. The role of extranuclear signaling actions of progesterone receptor in mediating progesterone regulation of gene expression and the cell cycle. Mol Endocrinol 21:359–375 [DOI] [PubMed] [Google Scholar]
- 10.Kabotyanski EB, Rijnkels M, Freeman-Zadrowski C, Buser AC, Edwards DP, Rosen JM2009. Lactogenic hormonal induction of long distance interactions between β-casein gene regulatory elements. J Biol Chem 284:22815–22824 [DOI] [PMC free article] [PubMed] [Google Scholar]
- 11.Clevenger CV, Furth PA, Hankinson SE, Schuler LA2003. The role of prolactin in mammary carcinoma. Endocr Rev 24:1–27 [DOI] [PMC free article] [PubMed] [Google Scholar]
- 12.Lange CA2008. Integration of progesterone receptor action with rapid signaling events in breast cancer models. J Steroid Biochem Mol Biol 108:203–212 [DOI] [PMC free article] [PubMed] [Google Scholar]
- 13.Blais A, Dynlacht BD2005. Constructing transcriptional regulatory networks. Genes Dev 19:1499–1511 [DOI] [PubMed] [Google Scholar]
- 14.Ormandy CJ, Hall RE, Manning DL, Robertson JF, Blamey RW, Kelly PA, Nicholson RI, Sutherland RL1997. Coexpression and cross-regulation of the prolactin receptor and sex steroid hormone receptors in breast cancer. J Clin Endocrinol Metab 82:3692–3699 [DOI] [PubMed] [Google Scholar]
- 15.Macleod K, Leprince D, Stehelin D1992. The ets gene family. Trends Biochem Sci 17:251–256 [DOI] [PubMed] [Google Scholar]
- 16.Seth A, Ascione R, Fisher RJ, Mavrothalassitis GJ, Bhat NK, Papas TS1992. The ets gene family. Cell Growth Differ 3:327–334 [PubMed] [Google Scholar]
- 17.Wasylyk B, Hahn SL, Giovane A1993. The Ets family of transcription factors. Eur J Biochem 211:7–18 [DOI] [PubMed] [Google Scholar]
- 18.Graves BJ, Petersen JM1998. Specificity within the Ets family of transcription factors. Adv Cancer Res 75:1–55 [DOI] [PubMed] [Google Scholar]
- 19.Harris J, Stanford PM, Sutherland K, Oakes SR, Naylor MJ, Robertson FG, Blazek KD, Kazlauskas M, Hilton HN, Wittlin S, Alexander WS, Lindeman GJ, Visvader JE, Ormandy CJ2006. Socs2 and Elf5 mediate prolactin-induced mammary gland development. Mol Endocrinol 20:1177–1187 [DOI] [PubMed] [Google Scholar]
- 20.Thomas RS, Ng AN, Zhou J, Tymms MJ, Doppler W, Kola I2000. The Elf group of Ets-related transcription factors. ELF3 and ELF5. Adv Exp Med Biol 480:123–128 [DOI] [PubMed] [Google Scholar]
- 21.Zhou J, Chehab R, Tkalcevic J, Naylor MJ, Harris J, Wilson TJ, Tsao S, Tellis I, Zavarsek S, Xu D, Lapinskas EJ, Visvader J, Lindeman GJ, Thomas R, Ormandy CJ, Hertzhog PJ, Kola I, Pritchard MA2005. Elf5 is essential for early embryogenesis and mammary gland development during prengnancy and lactation. EMBO J 24:635–644 [DOI] [PMC free article] [PubMed] [Google Scholar]
- 22.Oakes SR, Naylor MJ, Asselin-Labat M-L, Blazek KD, Gardiner-Garden M, Hilton HN, Kazlauskas M, Pritchard MA, Chodosh LA, Pfeffer PL, Lindeman GJ, Visvader JE, Ormandy CJ2008. The Ets transcription factor Elf5 specifies mammary alveolar cell fate. Genes Dev 22:581–586 [DOI] [PMC free article] [PubMed] [Google Scholar]
- 23.Choi YS, Chakrabarti R, Escamilla-Hernandez R, Sinha S2009. Elf5 conditional knockout mice reveal its role as a master regulator in mammary alveolar development: failure of Stat5 activation and functional differentiation in the absence of Elf5. Dev Biol 329:227–241 [DOI] [PubMed] [Google Scholar]
- 24.Brisken C, Kaur S, Chavarria TE, Binart N, Sutherland RL, Weinberg RA, Kelly PA, Ormandy CJ1999. Prolactin controls mammary gland development via direct and indirect mechanisms. Dev Biol 210:96–106 [DOI] [PubMed] [Google Scholar]
- 25.Lim E, Vaillant F, Wu D, Forrest NC, Pal B, Hart AH, Asselin-Labat ML, Gyorki DE, Ward T, Partanen A, Feleppa F, Huschtscha LI, Thorne HJ, Fox SB, Yan M, French JD, Brown MA, Smyth GK, Visvader JE, Lindeman GJ2009. Aberrant luminal progenitors as the candidate target population for basal tumor development in BRCA1 mutation carriers. Nat Med 15:907–913 [DOI] [PubMed] [Google Scholar]
- 26.Fernandez-Valdivia R, Mukherjee A, Creighton CJ, Buser AC, DeMayo FJ, Edwards DP, Lydon JP2008. Transcriptional response of the murine mammary gland to acute progesterone exposure. Endocrinology 149:6236–6250 [DOI] [PMC free article] [PubMed] [Google Scholar]
- 27.Caldon CE, Lee CS, Sutherland RL, Musgrove EA2008. Wilms’ tumor protein 1: an early target of progestin regulation in T-47D breast cancer cells that modulates proliferation and differentiation. Oncogene 27:126–138 [DOI] [PubMed] [Google Scholar]
- 28.Chambon M, Rochefort H, Vial HJ, Chalbos D1989. Progestins and androgens stimulate lipid accumulation in T47D breast cancer cells via their own receptors. J Steroid Biochem 33:915–922 [DOI] [PubMed] [Google Scholar]
- 29.Kester HA, van der Leede BM, van der Saag PT, van der Burg B1997. Novel progesterone target genes identified by an improved differential display technique suggest that progestin-induced growth inhibition of breast cancer cells coincides with enhancement of differentiation. J Biol Chem 272:16637–16643 [DOI] [PubMed] [Google Scholar]
- 30.Musgrove EA, Lee CS, Sutherland RL1991. Progestins both stimulate and inhibit breast cancer cell cycle progression while increasing expression of transforming growth factor α, epidermal growth factor receptor, c-fos and c-myc genes. Mol Cell Biol 11:5032–5043 [DOI] [PMC free article] [PubMed] [Google Scholar]
- 31.Sutherland RL, Hall RE, Pang GY, Musgrove EA, Clarke CL1988. Effect of medroxyprogesterone acetate on proliferation and cell cycle kinetics of human mammary carcinoma cells. Cancer Res 48:5084–5091 [PubMed] [Google Scholar]
- 32.Gray D, Hoeflich K, Peng L, Gu Z, Gogineni A, Murray L, Eby M, Kljavin N, Seshagiri S, Cole M, Davis D2007. pHUSH: a single vector system for conditional gene expression. BMC Biotechnol 7:61. [DOI] [PMC free article] [PubMed] [Google Scholar]
- 33.Ashburner M, Ball CA, Blake JA, Botstein D, Butler H, Cherry JM, Davis AP, Dolinski K, Dwight SS, Eppig JT, Harris MA, Hill DP, Issel-Tarver L, Kasarskis A, Lewis S, Matese JC, Richardson JE, Ringwald M, Rubin GM, Sherlock G2000. Gene ontology: tool for the unification of biology. The Gene Ontology Consortium. Nat Genet 25:25–29 [DOI] [PMC free article] [PubMed] [Google Scholar]
- 34.Kanehisa M, Goto S, Hattori M, Aoki-Kinoshita KF, Itoh M, Kawashima S, Katayama T, Araki M, Hirakawa M2006. From genomics to chemical genomics: new developments in KEGG. Nucleic Acids Res 34:D354–357 [DOI] [PMC free article] [PubMed]
- 35.Subramanian A, Tamayo P, Mootha VK, Mukherjee S, Ebert BL, Gillette MA, Paulovich A, Pomeroy SL, Golub TR, Lander ES, Mesirov JP2005. Gene set enrichment analysis: a knowledge-based approach for interpreting genome-wide expression profiles. Proc Natl Acad Sci USA 102:15545–15550 [DOI] [PMC free article] [PubMed] [Google Scholar]
- 36.Mootha VK, Lindgren CM, Eriksson KF, Subramanian A, Sihag S, Lehar J, Puigserver P, Carlsson E, Ridderstråle M, Laurila E, Houstis N, Daly MJ, Patterson N, Mesirov JP, Golub TR, Tamayo P, Spiegelman B, Lander ES, Hirschhorn JN, Altshuler D, Groop LC2003. PGC-1α-responsive genes involved in oxidative phosphorylation are coordinately downregulated in human diabetes. Nat Genet 34:267–273 [DOI] [PubMed] [Google Scholar]
- 37.Huang da W, Sherman BT, Lempicki RA2009. Systematic and integrative analysis of large gene lists using DAVID bioinformatics resources. Nat Protoc 4:44–57 [DOI] [PubMed] [Google Scholar]
- 38.Rankin S2005. Sororin, the cell cycle and sister chromatid cohesion. Cell Cycle 4:1039–1042 [DOI] [PubMed] [Google Scholar]
- 39.Bharadwaj R, Qi W, Yu H2004. Identification of two novel components of the human NDC80 kinetochore complex. J Biol Chem 279:13076–13085 [DOI] [PubMed] [Google Scholar]
- 40.Rubino D, Driggers P, Arbit D, Kemp L, Miller B, Coso O, Pagliai K, Gray K, Gutkind S, Segars J1998. Characterization of Brx, a novel Dbl family member that modulates estrogen receptor action. Oncogene 16:2513–2526 [DOI] [PubMed] [Google Scholar]
- 41.Lim RW, Halpain S2000. Regulated association of microtubule-associated protein 2 (MAP2) with Src and Grb2: evidence for MAP2 as a scaffolding protein. J Biol Chem 275:20578–20587 [DOI] [PubMed] [Google Scholar]
- 42.Lange CA, Richer JK, Horwitz KB1999. Hypothesis: Progesterone primes breast cancer cells for cross-talk with proliferative or antiproliferative signals. Mol Endocrinol 13:829–836 [DOI] [PubMed] [Google Scholar]
- 43.Lange CA, Richer JK, Shen T, Horwitz KB1998. Convergence of progesterone and epidermal growth factor signaling in breast cancer. J Biol Chem 273:31308–31316 [DOI] [PubMed] [Google Scholar]
- 44.Richer JK, Lange CA, Manning NG, Owen G, Powell R, Horwitz KB1998. Convergence of progesterone with growth factor and cytokine signaling in breast cancer. J Biol Chem 273:31317–31326 [DOI] [PubMed] [Google Scholar]
- 45.Shyamala G, Yang X, Silberstein G, Barcellos-Hoff MH, Dale E1998. Transgenic mice carrying an imbalance in the native ratio of A to B forms of progesterone receptor exhibit developmental abnormalities in mammary glands. Proc Natl Acad Sci USA 95:696–701 [DOI] [PMC free article] [PubMed] [Google Scholar]
- 46.Graham JD, Yager ML, Hill HD, Byth K, O'Neill GM, Clarke CL2005. Altered progesterone receptor isoform expression remodels progestin responsiveness of breast cancer cells. Mol Endocrinol 19:2713–2735 [DOI] [PubMed] [Google Scholar]
- 47.Santos SJ, Aupperlee MD, Xie J, Durairaj S, Miksicek R, Conrad SE, Leipprandt JR, Tan YS, Schwartz RC, Haslam SZ2009. Progesterone receptor A-regulated gene expression in mammary organoid cultures. J Steroid Biochem Mol Biol 115:161–172 [DOI] [PMC free article] [PubMed] [Google Scholar]
- 48.Migliaccio A, Piccolo D, Castoria G, Di Domenico M, Bilancio A, Lombardi M, Gong W, Beato M, Auricchio F1998. Activation of the Src/p21ras/Erk pathway by progesterone receptor via cross-talk with estrogen receptor. EMBO J 17:2008–2018 [DOI] [PMC free article] [PubMed] [Google Scholar]
- 49.Musgrove EA, Hunter LJ, Lee CS, Swarbrick A, Hui R, Sutherland RL2001. Cyclin D1 overexpression induces progestin resistance in T-47D breast cancer cells despite p27-Kip1 association with cyclin E-Cdk2. J Biol Chem 276:47675–47693 [DOI] [PubMed] [Google Scholar]
- 50.Smyth GK2005. Limma: linear models for microarray data. In: Gentleman R, Carey V, Dudoity S, Irizarry R, Huber W, eds. Bioinformatics and computational biology solutions using R and bioconductor. Chap 23. New York: Springer-Verlag
- 51.Benjamini Y, Yekutieli D2001. The control of the false discovery rate in multiple testing under dependency. Ann Statist 29:1165–1188 [Google Scholar]
- 52.Pollard KS, Dudoit S, van der Laan MJ2005. Multiple testing procedures: the multtest package and application to genomics. In Gentleman R, Carey VY, Huber W, Irizarry RA, Dudoit S, eds. Statistics for biology and health: bioinformatics and computational biology solutions using R and bioconductor. Chap 15. New York: Springer
- 53.Alles MC, Gardiner-Garden M, Nott DJ, Wang Y, Foekens JA, Sutherland RL, Musgrove EA, Ormandy CJ2009. Meta-analysis and gene set enrichment relative to er status reveal elevated activity of MYC and E2F in the “basal” breast cancer subgroup. PLoS One 4:e4710 [DOI] [PMC free article] [PubMed]
- 54.Irizarry RA, Warren D, Spencer F, Kim IF, Biswal S, Frank BC, Gabrielson E, Garcia JG, Geoghegan J, Germino G, Griffin C, Hilmer SC, Hoffman E, Jedlicka AE, Kawasaki E, Martínez-Murillo F, Morsberger L, Lee H, Petersen D, Quackenbush J, Scott A, Wilson M, Yang Y, Ye SQ, Yu W2005. Multiple-laboratory comparison of microarray platforms. Nat Methods 2:345–350 [DOI] [PubMed] [Google Scholar]