Abstract
Objectives
The aim of the study was to identify covariates associated with 28-day mortality in septic patients admitted to the emergency department and derive and validate a score that stratifies mortality risk utilizing parameters that are readily available.
Methods
Patients with an admission diagnosis of suspected or confirmed infection and fulfilling at least two criteria for severe inflammatory response syndrome were included in this study. Patients’ characteristics, vital signs, and laboratory values were used to identify prognostic factors for mortality. A scoring system was derived and validated. The primary outcome was the 28-day mortality rate.
Results
A total of 440 patients were included in the study. The 28-day hospital mortality rate was 32.4 and 25.2% for the derivation (293 patients) and validation (147 patients) sets, respectively. Factors associated with a higher mortality were immune-suppressed state (odds ratio 4.7; 95% confidence interval 2.0–11.4), systolic blood pressure on arrival less than 90 mmHg (3.8; 1.7–8.3), body temperature less than 36.0°C (4.1; 1.3–12.9), oxygen saturation less than 90% (2.3; 1.1–4.8), hematocrit less than 0.38 (3.1; 1.6–5.9), blood pH less than 7.35 (2.0; 1.04–3.9), lactate level more than 2.4 mmol/l (2.27; 1.2–4.2), and pneumonia as the source of infection (2.7; 1.5–5.0). The area under the receiver operating characteristic curve was 0.81 (0.75–0.86) in the derivation and 0.81 (0.73–0.90) in the validation set. The SPEED (sepsis patient evaluation in the emergency department) score performed better (P=0.02) than the Mortality in Emergency Department Sepsis score when applied to the complete study population with an area under the curve of 0.81 (0.76–0.85) as compared with 0.74 (0.70–0.79).
Conclusion
The SPEED score predicts 28-day mortality in septic patients. It is simple and its predictive value is comparable to that of other scoring systems.
Keywords: emergency department, MEDS, MEDS score, mortality, outcome, scoring system, sepsis, SPEED score
Introduction
Sepsis remains a major challenge in current clinical practice. There is an estimated worldwide incidence of 19 million cases annually 1. It is the major cause of mortality among patients in noncoronary ICUs in developed countries 2. The Surviving Sepsis Campaign introduced guidelines emphasizing early resuscitation and antibiotic therapy. Early detection and aggressive treatment of sepsis affects the outcome of septic patients positively 3,4.
In developed healthcare systems, severe sepsis management takes place primarily in an ICU setting. Initially, however, most of these patients are managed in emergency departments (EDs). The importance of effective ED diagnostic and therapeutic intervention for severe sepsis is underlined by the fact that the mean ED length of stay is 5 h 5. Septic patients might not necessarily appear seriously ill at presentation but their condition may deteriorate rapidly. The seriousness of a sepsis presentation can be easily underestimated in a busy ED environment.
Various scoring systems for septic patients have been developed to identify patients at highest risk. Most scores like the Acute Physiology and Chronic Health Evaluation or the Sepsis-related Organ Failure Assessment were developed in the setting of an ICU and require a diagnostic workup that cannot be provided in the ED 6,7. Other scores that have been developed specifically for the ED, such as the Mortality in Emergency Department Sepsis (MEDS) score, have been shown to perform better than single biomarkers like C-reactive protein or lactate but failed to become part of routine clinical practice 8,9. The reasons for failure of these scoring systems to be firmly established into clinical routine are complex. They require a certain amount of diagnostic workup that might be difficult to obtain in a setting of limited resources and they are complex to calculate and to interpret.
The aim of this study was to derive and validate a sepsis score that is simple to calculate but can still accurately predict mortality in septic patients. As for the general lack of studies investigating septic patients in the ED that were performed in South-East Asia, we were also interested in identifying risk factors that are specific for the local population compared with North American or European patients.
Methods
Setting
This study is a prospective observational study. Data were collected from August 2011 to January 2012 at University of Malaya Medical Centre. It is a tertiary hospital in an urban setting, has 1240 beds, and treats about 125 000 ED patients annually. Approval from the local ethics committee was obtained before the study.
Data collection
All patients admitted to the ED during the study period with a suspected or confirmed infection and who met at least two criteria for the severe inflammatory response syndrome (SIRS) were screened for eligibility. On arrival, the patients’ vital signs (temperature, blood pressure, heart rate, respiratory rate, and oxygen saturation), laboratory data (leukocyte count, differential cell count, platelets), and arterial blood gases (partial pressures of oxygen and carbon dioxide, blood pH, blood lactate, and bicarbonate levels) were recorded. The presence of the following covariates was also recorded: chronic obstructive airway disease, diabetes, any malignancy, HIV/AIDS, cerebrovascular accident, chronic cardiac failure, chronic or end-stage renal failure, hepatitis B or C, hypertension, organ transplant recipient, immunosuppressed state, and nursing home residency. We considered patients to be immunosuppressed if they had either HIV/AIDS or any malignancy or had received a transplanted organ or were on immunosuppressive therapy. Patients were classified as having chronic kidney disease if they had decreased kidney function (decreased glomerular filtration rate) for 3 or more months 10.
The 28-day hospital mortality rate was used as the primary endpoint in this study. Patients discharged alive before 28 days were contacted 28 days after admission to determine whether they were still alive.
Inclusion and exclusion criteria
Adult patients (age≥18 years) who had either suspected or confirmed infection and who met two or more SIRS criteria were included. Patients were excluded if they (a) needed immediate surgery with an anticipated departure to the operating room in less than 6 h; (b) had a do not attempt resuscitation order; (c) were dead on arrival at the ED; or (d) were pregnant.
Definitions
SIRS criteria were defined according to the consensus criteria of the American College of Chest Physicians/Society of Critical Care Medicine Consensus Conference as the presence of at least two of the following: body temperature less than 36.0°C or more than 38.0°C; heart rate more than 90 beats/min; tachypnea with a respiratory rate of more than 20 breaths/min or partial pressure of carbon dioxide of less than 32 mmHg; and a white blood cell count of less than 4000/µl or more than 12000/µl or more than 10% immature neutrophils 11. The source of infection was classified as one of the following: upper respiratory tract, pneumonia, intra-abdominal, genitourinary tract, skin or soft tissue, unknown and other.
Derivation and validation sets
The patient population was divided into a derivation and a validation set. Patients were assigned randomly to one of the two sets, with two-thirds of the patients in the derivation and one-third in the validation set. The derivation data set was utilized to identify multivariate predictors of mortality and to develop the sepsis score. The validation set was used only after the development of the SPEED (sepsis patient evaluation in the emergency department) score to test its predictive quality.
Statistical methods
The relationship between univariate variables and 28-day mortality was examined using the χ2-test. Significant univariate predictors (at a level of P<0.05) of death were included in a logistic regression model with likelihood-ratio forward selection. A threshold of P less than 0.05 was applied for inclusion in the logistic regression model. Variables that were independent predictors of 28-day mortality in the logistic regression model were utilized to derive the score. We assigned a certain point value to each of the variables that were significant in the logistic regression model by dividing the β-coefficient of these variables by 0.5 and rounding it to the nearest integer. To calculate the SPEED score for each patient, we summed the points assigned to the presence of each variable. The Hosmer–Lemeshow test was used to construct a calibration figure to assess how well our model performed in predicting mortality. We also calculated the Akaike Information Criterion, which penalizes a model for overfitting. Receiver operating characteristic (ROC) curves and area under the curves (AUCs) for both the validation and the derivation set were calculated. We compared the SPEED score ROC curve with that of the MEDS score with the ‘pROC’ package for R and S+, which is based on DeLong’s test of two correlated ROC curves 12. All other analyses were performed with IBM SPSS Statistics for Windows, Version 22.0 (IBM Corp., Armonk, New York, USA) and the level of significance was set at P less than 0.05.
Results
A total of 589 eligible patients were admitted to the ED during the study period. Of them, 149 patients had incomplete data sets and hence were excluded from data analysis. These were almost exclusively patients with missing arterial blood gas samples. The median length of stay in the ED and hospital was 9 h and 6 days, respectively. In all, 293 patients were assigned to the derivation set and 147 patients to the validation set. Patient characteristics, vital signs, and laboratory values on arrival for the two sets are shown in Table 1. There were no significant differences between the data sets (unpaired t-test and χ2-test).
Table 1.
Patient characteristics, vital signs, and laboratory values on arrival
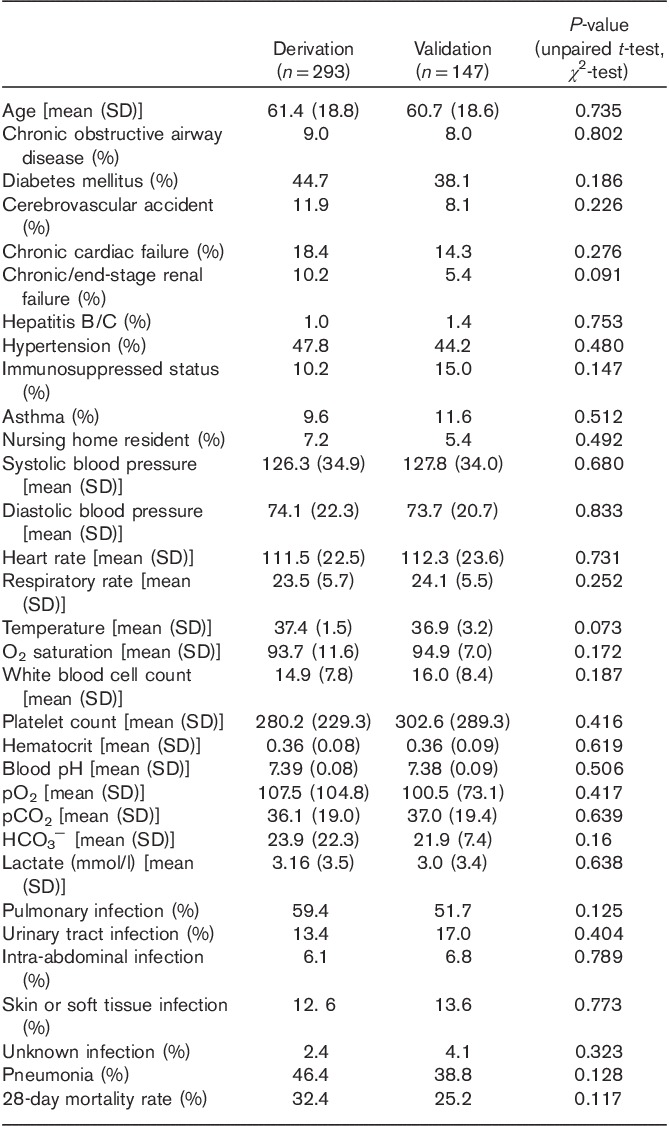
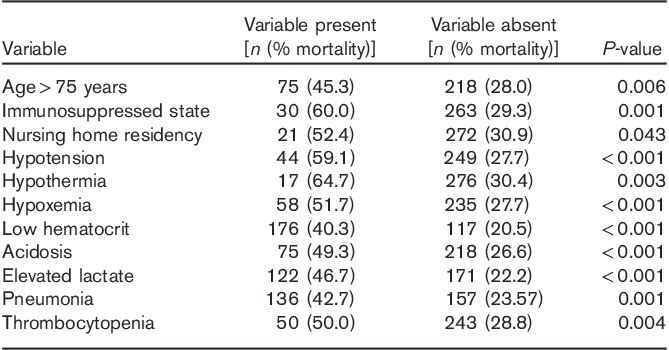
The mortality rate for the derivation set and the validation set was 32.4 and 25.2%, respectively. The variables significantly associated with a higher 28-day mortality rate (χ2 testing) are shown in Table 2.
Table 2.
Univariate covariates with a significant influence on 28-day mortality
The variables that were found to be significantly associated with an adverse 28-day survival status in the χ2-test were analyzed by a logistic regression model with likelihood-ratio forward selection to identify independent predictors of mortality (Table 3). Eight variables were identified as independent predictors of higher mortality: immunosuppressed state, hypotension, hypothermia, low hematocrit, hypoxemia, acidosis, elevated lactate, and pneumonia.
Table 3.
Independent variables associated with increased 28-day mortality (binary multiple regression analysis)
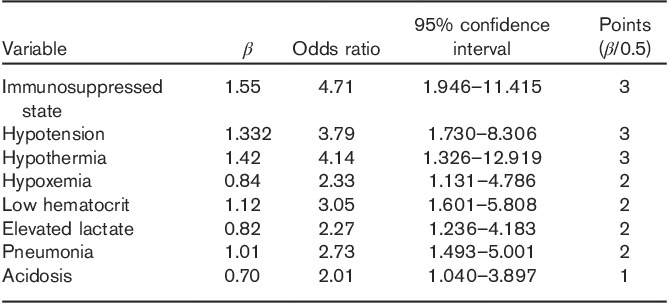
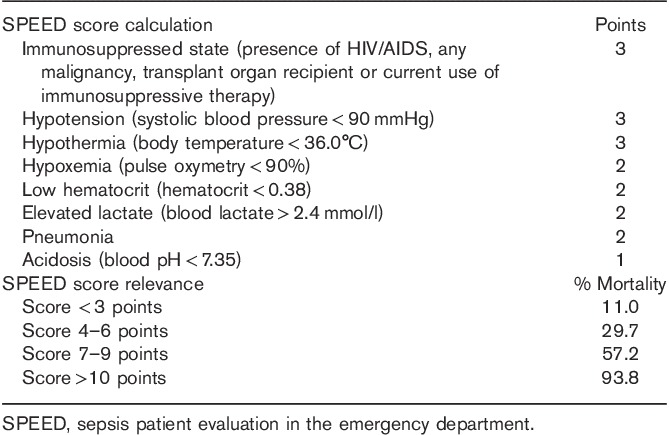
By dividing the β-coefficients for each of the variables by 0.5 and rounding the values to the nearest integer, we assigned a specific value to each of the risk factors identified by the logistic regression model. We then calculated the SPEED score for each patient by summing the points assigned to the presence of each risk factor in the derivation set and subdivided this population into four risk groups for 28-day mortality. Mortality rates for the different subgroups ranged from 11.0% for patients with a SPEED score of 0–3 to 93.8% for patients with a SPEED score of more than 10. Figure 1 shows the mortality rates for the different subgroups in the derivation and validation set. When comparing the relative risk for 28-day mortality, we found that patients with a SPEED score of 4–6 had a 2.7-fold [95% confidence interval (CI) 1.5–5.0], those with a SPEED score of 7–9 had a 5.2-fold (95% CI 2.9–9.2), and those with a SPEED score of more than 10 had an 8.6-fold (95% CI 4.9–14.7) increased risk compared with patients with a SPEED score of 0–3.
Fig. 1.
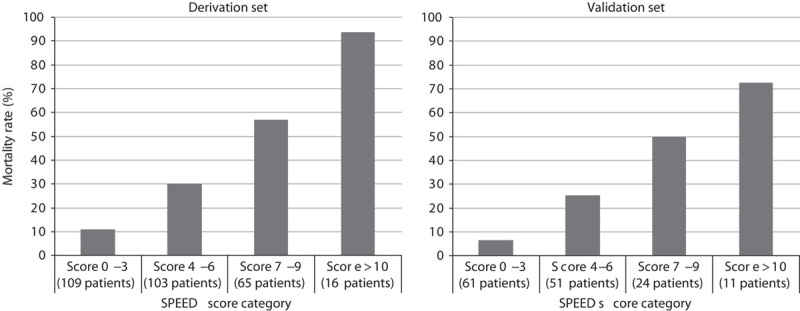
Number of cases and mortality in the derivation and validation sets based on the SPEED score subgroups. SPEED, sepsis patient evaluation in the emergency department.
The AUC curve for the sepsis score was 0.83 (95% CI 0.79–0.88) in the derivation set and 0.80 (0.73–0.87) in the validation set (Fig. 2).
Fig. 2.
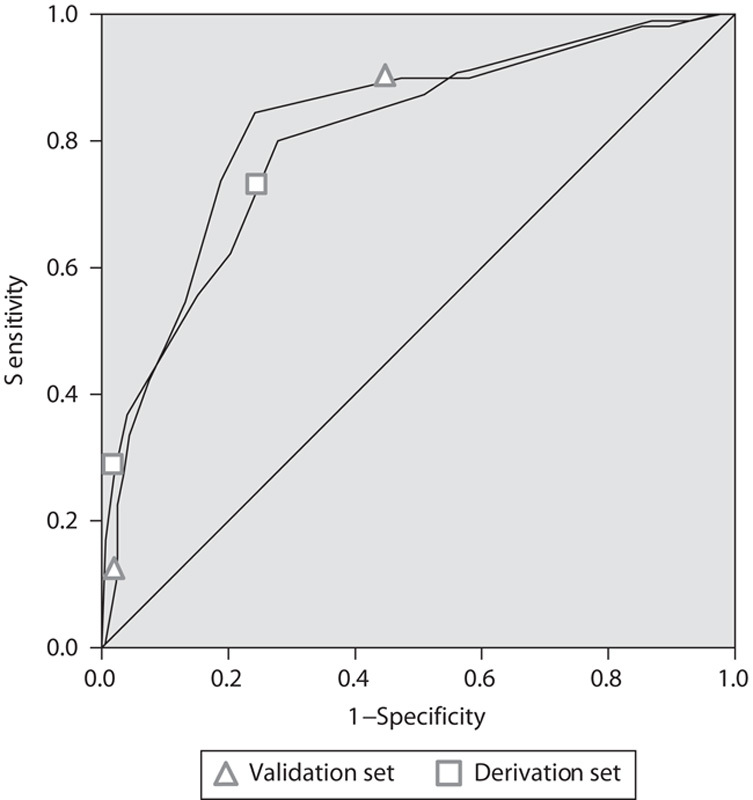
ROC curve for derivation and validation sets. ROC, receiver operating characteristic.
We calculated the Akaike Information Criterion, which showed that the model with eight variables had the best fit compared with its complexity. Moreover, we conducted a Hosmer–Lemeshow test that yielded a P-value of 0.42. The nonsignificant result of the Hosmer–Lemeshow measure demonstrates that the proposed score is able to predict mortality.
When applying the score to the validation set, we found that it maintained its predictive value for 28-day mortality. As displayed in Fig. 2, the area under the ROC curve was 0.81 (0.73–0.90) and the score was able to successfully establish a general trend of increasing risk for mortality with higher values on the score.
We calculated both MEDS and SPEED score for the entire study population. The SPEED score performed better (P=0.02) than the MEDS score when applied to the complete study population with an AUC of 0.81 (0.76–0.85) as compared with 0.74 (0.70–0.79). The ROC curves of the two scores are shown in Fig. 3.
Fig. 3.
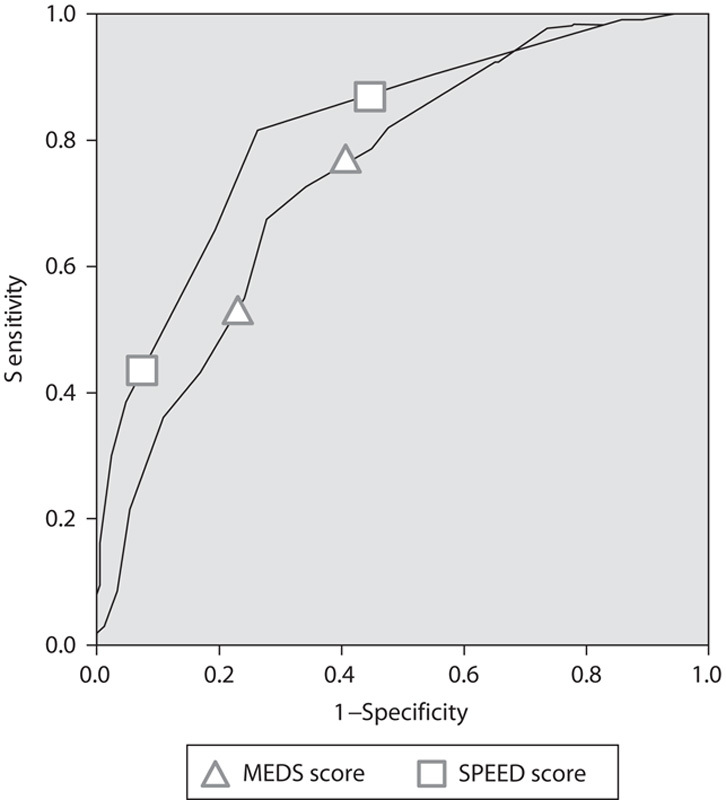
Comparison ROC curves of MEDS and SPEED score. MEDS, Mortality in Emergency Department Sepsis; ROC, receiver operating characteristic; SPEED, sepsis patient evaluation in the emergency department.
Discussion
This is the first prospective study in South-East Asia examining predictive covariates for 28-day mortality in septic patients and creating a score predicting the 28-day mortality rate. It was a single-center study carried out at the ED of a tertiary urban hospital in a developing country.
The derived clinical prediction rule was validated on another smaller data set and was found to perform well. Therefore, the score appears to be able to accurately identify patients at higher risk for death. This may have implications in terms of optimizing management. However, whether or not the score truly has a potential role in patient management needs to be investigated further. At the present moment, the score is more adequate to describe the behavior of a population and less so of an individual patient. We see a further potential use of the SPEED score in the standardization of disease severity that can then be applied to study ED outcomes or specific interventions.
Diagnostic options within the ED are often limited by budget constraints and a lack of infrastructure for invasive hemodynamic monitoring or imaging. Consequently, the covariates collected and analyzed in our study are the ones that can be easily and quite universally obtained in an ED setting: patient’s characteristics, vital signs, and laboratory values.
Severe sepsis is characterized by an overwhelming, cytokine-mediated inflammatory response 13,14. The utilization of cytokines like tumor necrosis factor α and interleukin 6 in the diagnosis and monitoring of patients and attempts to develop immunoadjuvant therapies are based on our current understanding of the pathophysiology of sepsis 15. A pre-existing immunosuppressed state is a strong predictor of an adverse outcome. While various different disease processes can lead to an immunosuppressed state, we found that in particular HIV/AIDS is associated with a higher mortality. A concomitant HIV infection has also therapeutic implications as the spectrum of pathogens is different and the course of sepsis is often more severe with distinct clinical and inflammatory characteristics 16,17.
Lower respiratory tract infections like pneumonia have been linked to higher mortality in several studies 18. In our study, pneumonia and the related covariate hypoxemia also show a positive association with mortality, whereas all other sources of infection that we classified did not.
In keeping with other studies, we found that elevated lactate levels and an acidotic blood pH were linked to a worse prognosis. These parameters reflect the hypoperfusion of tissues in severe sepsis, and the clearance of lactate has also been suggested as a predictor of survival 19,20.
Other published predictive scoring systems in sepsis identified risk factors similar to this study. However, often covariates like differential blood cell counts including platelet and banded neutrophils are being utilized by these scores that might not be readily available in EDs in developing countries 8. The MEDS score is the most widely used score for septic patients in the ED and has been validated widely. Our scoring system is even simpler than the MEDS score and relies only on the most fundamental and readily available diagnostic tools. The MEDS score’s AUC ranges in most studies from 0.75 to 0.85 8,21. In direct comparison, we found that our score did perform better than the MEDS score with an AUC of 0.81 (0.76–0.85) as compared with 0.74 (0.70–0.79), making it an interesting alternative. Table 4 provides a summary of how to calculate and interpret the SPEED score in clinical practice.
Table 4.
Calculation and clinical relevance of the SPEED score
Limitations
We acknowledge that our study is limited by its small sample size and the collection of data in a single center only. We acknowledge that the likely infective agents responsible for sepsis in our setting might be different from that of other countries and could confound the utility of the score. Although our patients were prospectively identified, a variety of components of the scoring system were obtained by chart abstraction and patients’ record review, posing the possibility for mistakes. Twenty-eight-day mortality was the endpoint in our study. However, death due to causes other than infection cannot be fully excluded. Risk factors with a less strong influence on mortality might have been missed because of the comparatively low number of cases. The application of the model to predict the outcome of an individual patient is limited, and our score needs further validation before being used in clinical practice.
Conclusion
This study developed and validated a clinical score to predict 28-day mortality in septic patients utilizing only data obtained from clinical history taking, vital signs, and arterial blood gases that are readily available in the most basically equipped EDs. Its predictive value is comparable to that of more complex scoring systems.
Acknowledgements
Conflicts of interest
There are no conflicts of interest.
References
- 1.Adhikari NK, Fowler RA, Bhagwanjee S, Rubenfeld GD. Critical care and the global burden of critical illness in adults. Lancet 2010; 376:1339–1346. [DOI] [PMC free article] [PubMed] [Google Scholar]
- 2.Angus DC, Linde-Zwirble WT, Lidicker J, Clermont G, Carcillo J, Pinsky MR, et al. Epidemiology of severe sepsis in the United States: analysis of incidence, outcome, and associated costs of care. Crit Care Med 2001; 29:1303–1310. [DOI] [PubMed] [Google Scholar]
- 3.Rivers E, Nguyen B, Havstad S, Ressler J, Muzzin A, Knoblich B. Early goal-directed therapy in the treatment of severe sepsis and septic shock. N Engl J Med 2001; 345:1368–1377. [DOI] [PubMed] [Google Scholar]
- 4.Dellinger RP, Levy MM, Rhodes A, Annane D, Gerlach H, Opal SM, et al. Surviving Sepsis Campaign: international guidelines for management of severe sepsis and septic shock, 2012. Intensive Care Med 2013; 39:165–228. [DOI] [PMC free article] [PubMed] [Google Scholar]
- 5.Wang HE, Shapiro NI, Angus DC, Yealy DM. National estimates of severe sepsis in United States emergency departments. Crit Care Med 2007; 35:1928–1936. [DOI] [PubMed] [Google Scholar]
- 6.Knaus WA, Draper EA, Wagner DP, Zimmerman JE. APACHE II: a severity of disease classification system. Crit Care Med 1985; 13:818–829. [PubMed] [Google Scholar]
- 7.Vincent JL, Moreno R, Takala J, Willatts S, De Mendonca A, Bruining H, et al. The SOFA (Sepsis-related Organ Failure Assessment) score to describe organ dysfunction/failure. On behalf of the Working Group on Sepsis-Related Problems of the European Society of Intensive Care Medicine. Intensive Care Med 1996; 22:707–710. [DOI] [PubMed] [Google Scholar]
- 8.Shapiro NI, Wolfe RE, Moore RB, Smith E, Burdick E, Bates DW. Mortality in Emergency Department Sepsis (MEDS) score: a prospectively derived and validated clinical prediction rule. Crit Care Med 2003; 31:670–675. [DOI] [PubMed] [Google Scholar]
- 9.Hermans MA, Leffers P, Jansen LM, Keulemans YC, Stassen PM. The value of the Mortality in Emergency Department Sepsis (MEDS) score, C reactive protein and lactate in predicting 28-day mortality of sepsis in a Dutch emergency department. Emerg Med J 2012; 29:295–300. [DOI] [PubMed] [Google Scholar]
- 10.Levey AS, Coresh J, Balk E, Kausz T, Levin A, Steffes M, et al. National Kidney Foundation Practice Guidelines for Chronic Kidney Disease: evaluation, classification, and stratification. Ann Intern Med 2003; 139:137–147. [DOI] [PubMed] [Google Scholar]
- 11.Bone RC, Balk RA, Cerra FB, Dellinger RP, Fein AM, Knaus WA, et al. Definitions for sepsis and organ failure and guidelines for the use of innovative therapies in sepsis. The ACCP/SCCM Consensus Conference Committee. American College of Chest Physicians/Society of Critical Care Medicine. 1992. Chest 2009; 136 (Suppl):e28. [DOI] [PubMed] [Google Scholar]
- 12.Robin X, Turck N, Hainard A, Tiberti N, Lisacek F, Sanchez JC, et al. pROC: an open-source package for R and S+ to analyze and compare ROC curves., BMC Bioinformatics 2011; 12:77. [DOI] [PMC free article] [PubMed] [Google Scholar]
- 13.Rittirsch D, Flierl MA, Ward PA. Harmful molecular mechanisms in sepsis. Nat Rev Immunol 2008; 8:776–787. [DOI] [PMC free article] [PubMed] [Google Scholar]
- 14.Boomer JS, To K, Chang KC, Takasu O, Osborne DF, Walton AH, et al. Immunosuppression in patients who die of sepsis and multiple organ failure. JAMA 2011; 306:2594–2605. [DOI] [PMC free article] [PubMed] [Google Scholar]
- 15.Hotchkiss RS, Monneret G, Payen D. Immunosuppression in sepsis: a novel understanding of the disorder and a new therapeutic approach. Lancet Infect Dis 2013; 13:260–268. [DOI] [PMC free article] [PubMed] [Google Scholar]
- 16.Silva JM, Jr, dos Santos Sde S. Sepsis in AIDS patients: clinical, etiological and inflammatory characteristics. J Int AIDS Soc 2013; 16:17344. [DOI] [PMC free article] [PubMed] [Google Scholar]
- 17.Medrano J, Alvaro-Meca A, Boyer A, Jimenez-Sousa MA, Resino S. Mortality of patients infected with HIV in the intensive care unit (2005–2010): significant role of chronic hepatitis C and severe sepsis. Crit Care 2014; 18:475. [DOI] [PMC free article] [PubMed] [Google Scholar]
- 18.Mayr FB, Yende S, Angus DC. Epidemiology of severe sepsis. Virulence 2014; 5:4–11. [DOI] [PMC free article] [PubMed] [Google Scholar]
- 19.Nguyen HB. Lactate in the critically ill patients: an outcome marker with the times. Crit Care 2011; 15:1016. [DOI] [PMC free article] [PubMed] [Google Scholar]
- 20.Puskarich MA, Trzeciak S, Shapiro NI, Albers AB, Heffner AC, Kline J, et al. Whole blood lactate kinetics in patients undergoing quantitative resuscitation for severe sepsis and septic shock. Chest 2013; 143:1548–1553. [DOI] [PMC free article] [PubMed] [Google Scholar]
- 21.Chen CC, Chong CF, Liu YL, Chen KC, Wang TL. Risk stratification of severe sepsis patients in the emergency department. Emerg Med J 2006; 23:281–285. [DOI] [PMC free article] [PubMed] [Google Scholar]


