Abstract
MiR-221 is frequently upregulated in papillary thyroid cancer (PTC) tissues and cell lines, and this study was designed to validate the association of miR-221 with PTC proliferation, apoptosis, and migration. We observed that miR-221 suppressed TIMP3 expression by binding to 3′ untranslated region of TIMP3 mRNA, and TIMP3 expression was increased with the presence of miR-221 inhibitors; TIMP3 siRNA could reverse the effects of miR-221 inhibitors on PTC cells. The results indicated that miR-221 exacerbated PTC by downregulating the expression of TIMP3. The effects of miR-221 and TIMP3 in vivo were also confirmed by human PTC-bearing mice models which suggest consistent results with those in vitro studies. In summary, miR-221 could aggravate cell proliferation and invasion of PTC by targeting TIMP3.
Keywords: papillary thyroid cancer, miR-221, TIMP3, cell proliferation and invasion
INTRODUCTION
Papillary thyroid cancer (PTC) is one of the most popular types of thyroid cancer that accounts for nearly 87.9% of thyroid cancer cases,1 and it is more prevalent in Asian compared with other ethnicities. A total of 62,450 new cases of thyroid cancer were diagnosed in the United States in 2015.2 The incidence of thyroid cancer is estimated to be 9.1 per 100, 000 females and 2.9 per 100,000 males,3 and these figures are expected to rise dramatically by approximately 4.5% per year.2 Although PTC has a favorable 5-year survival rate of 98%,1 the mortality of thyroid cancer is steadily increasing year by year. Besides, the estimated lifetime risk of thyroid cancer went up by 70% for females exposed to radiation exposure as infants since the Fukushima Disaster in 2011.4 Thus, it is crucial for us to have a better understanding of the disease.
Previous studies have identified several genetic mutations that might contribute to the carcinogenesis of PTC. For example, BRAFV600E mutation, which affects the mitogen-activated protein kinase pathway, was observed in approximately 45% of patients with PTC.5 Moreover, a few molecular markers for diagnosis and prognosis of PTC have been suggested based on currently elucidated mechanisms. However, the sensitivity and specificity of the available methods were relatively limited.6 Therefore, studies on novel mechanisms of thyroid cancer may provide invaluable information on clinical diagnosis, prognosis, and treatment of PTC.
MicroRNAs (miRNAs) is a group of small non–protein-coding RNAs that are able to control wide-ranging processes of tumor proliferation, invasion, and metastasis by binding to the 3' untranslated region (UTR) of target mRNAs.7 For instance, Li et al8 confirmed that miR-29a could suppress tumor growth and metastasis in PTC by binding to the 3′ UTR of AKT3 mRNA and restraining AKT3 expression. Thereby, PI3K/AKT pathway was activated in patients with PTC, along with decreased miR-29a expressions and increased AKT3 expressions. Thus, tumor-promoting genes were upregulated, and the process of carcinogenesis was stimulated. Besides, several other miRNAs have been identified as critical biomarkers for PTC, yet few mechanisms have been elucidated.9–12 For instance, MiR-221 is frequently upregulated in PTC tissues and in papillary cell lines,13,14 and its expression was positively associated with tumor invasion, lymph node metastasis, advanced disease stages, and poor prognosis.15,16 Furthermore, the correlation between miR-221 and its target gene of metalloproteinases-3 (TIMP3) has been implicated in modifying the abilities of diverse cancer cells to migrate and proliferate, such as glioma and breast cancer cells.17,18
However, the detailed mechanism of how miR-221 and TIMP3 contribute to PTC remained unclear. In the present research, we validated the association of miR-221 and TIMP3 with PTC and investigated the potentially underlying mechanism.
MATERIALS AND METHODS
Clinical samples
The PTC biopsy specimens (n = 65), including 18 males and 47 females, were collected from Daqing Oilfield General Hospital between March 2014 and October 2014. All subjects were pathologically confirmed as PTC cases, and no chemotherapy or radiotherapy has been performed for these patients before the surgery. The involved PTC samples were classified by the PTC tumor node metastasis classification criteria of American Joint Committee on Cancer (AJCC).19 PTC tissues and peficancerous tissues were collected in operation and stored at −80°C. Informed consents were obtained from all the patients, and the research protocols were approved by the Ethics Committee of Daqing Oilfield General Hospital.
Immunohistochemistry and in situ hybridization
Immunohistochemical analysis of TIMP3 in PTC tissues was performed using EnVision 2-step method as described previously.20 Rabbit polyclonal anti-TIMP3 antibody (Zhongshan Biology Company, Beijing) was diluted for 100 times. In situ hybridization of miR-221 for formalin-fixed and paraffin-embedded PTC and peficancerous tissue samples were performed using a miRCURY LNA miR-221 detection probe together with an in situ hybridization optimization kit (Exiqon, Vedbæk, Denmark). Scramble-miR probes were used as negative controls (NCs).
Cell culture
Human PTC cell lines (TPC-1 and BCPAP) and human embryonic kidney 293 cells (HEK293T) were purchased from the Institute of Biochemistry and Cell Biology (Shanghai). Cells were cultured in Dulbecco modified Eagle medium (Gibco, Carlsbad, CA) with 10% fetal bovine serum (Gibco), and cell culture medium was stored at 37°C in an incubator with 5% CO2. Cell passage was constructed when the attachment rate of monolayer cells reached 90%.
Luciferase activity assay
The 3′ UTR of TIMP3 which contains miR-221 binding sites was amplified through polymerase chain reaction (PCR) with prime sequence shown in Table 1 and was cloned into the downstream of the psiCHECK-2 luciferase vector (Promega), which was named as wild type 3′ UTR. The binding site was mutated using GeneTailor Site-Directed Mutagenesis System (Invitrogen, CA), and the resultant mutant 3′ UTR, named as mu 3′ UTR, was cloned into the same vector.
Table 1.
Primer sequences for luciferase reporter experiments.

HEK293T cells maintained in 48-well plates were cotransfected into a couple of groups: one group was cotransfected with 200 ng pGL3-control luciferase reporter, 10 ng pRL-TK vector, and miR-221 vector, whereas miR-221 was replaced by the NC vector in the other group. The transfected cells were analyzed using the Dual-Luciferase Reporter Assay System (Promega) after 48 hour transfection.
Lentivirus transduction and transfection
Three separate fragments which contain miR-221 inhibitors, TIMP3 siRNA, and Lenti-TIMP3 were cloned into the pCDH vector. After that, the pCDH vector was cotransfected with other packaging plasmids into cells using Lipofectamine LTX kit (Invitrogen, CA), and the viral particles therein were collected after 48 hour transfection.
TPC-1 cells were infected with 5 groups of recombinant lentivirus and 8 μg/mL polybrene: control group (cells without any transfection), NC group (cells transfected with NC), inhibitors group (cells transfected with miR-221 inhibitors), siTIMP3+inhibitors group (cells cotransfected with TIMP3 siRNA and miR-221 inhibitors), and Lenti-TIMP3 group (cells transfected with Lenti-TIMP3).
RNA isolation and real-time polymerase chain reaction
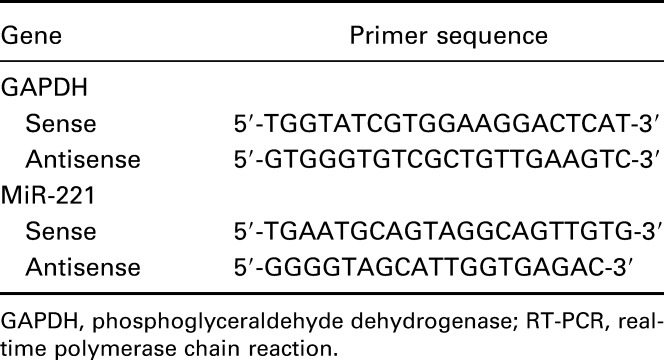
Total RNAs from tissues or cells were extracted using the TRIzol reagent (Invitrogen). The ReverTra Ace qPCR RT Kit (Toyobo, Japan) was used to reversely transcribe total RNA onto cDNA. Real-time polymerase chain reaction was performed using THUNDERBIRD SYBR qPCR Mix (Toyobo) at the instrument of CFX96 Touch Real-Time PCR Detection System (Bio-Rad). The relevant primers were listed in Table 2. The expression levels of target genes were normalized to those of the control gene (GAPDH) and were calculated by the method of 2−∆∆CT.
Table 2.
Primer sequences of GAPDH and miR-221 for implementation of RT-PCR.
Western blot
Tissues and cells were harvested and lysed by radio immunoprecipitation assay buffer. Total protein was separated and calculated by the Bradford method.21 Then, the total protein was denatured in boiling water and transferred onto polyvinylidene fluoride membranes once sodium dodecyl sulfate-polyacrylamide gel electrophoresis was completed. The membranes were blocked in Tris Buffered Saline Tween with 5% skim milk for 1 hour and were then treated with primary antibodies against TIMP3 at 4°C overnight (1:800 dilution; Zhongshan Biology Company). After membranes were washed, they were incubated with secondary antibodies (horseradish peroxidase–conjugated goat antigoat, 1:2000 dilution; Zhongshan Biology Company). The samples, along with reduced glyceraldehyde-phosphate dehydrogenase (GAPDH) as the endogenous control, were ultimately handled by enhanced chemiluminescence and quantified by Lab Works 4.5 software (Mitov Software).
Cell proliferation
Cell proliferation was calculated by 3-(4,5-dimethyl-2-thiazolyl)-2,5-diphenyl-2-H-tetrazolium bromide (MTT) assay. Besides that, 3 × 10³ cells were cultured in 96-well plates and incubated for different periods (24, 48, 72, and 96 hour). Then, cells were stained with 0.5 mg/mL MTT for 4 hour. Finally, the supernatant was discarded and 200 μl dimethyl sulfoxide was added to dissolve precipitate. Samples were measured at 490 nm with an enzyme-linked immunosorbent assay reader.
Cell cycle and apoptosis assay
For cell cycle assay, 3 × 10⁵ cells in each group were collected and fixed with 70% cold ethanol at 4°C overnight. Cells were then washed with phosphate-buffered saline (PBS) for 3 times and treated with 100 μg/mL RNase A for 0.5 hour. After cells were treated with 50μg/mL propidium iodide in the dark for 0.5 hour, we measured the DNA distribution using a FACScan flow cytometer (BD Biosciences). Apoptosis rates of samples were calculated after cells were stained with Annexin V-fluorescein isothiocyanate/propidium iodide Apoptosis Detection Kit (BD Biosciences) in the flow cytometry.
Cell migration and invasion assay
Wound-healing assay was used to evaluate the migration rate of PTC cells. Briefly, cells were first cultured in 6-well plates with a density of 2 × 10⁶. When cells were cultured to 80% confluence, we scratched a straight line in the middle of plates with a pipette tip. The plates were incubated in the growth medium after being washed with PBS for 3 times. The wound widths were calculated every 24 hour using a Nikon Eclipse TS100 microscope (Nikon, Japan).
The invasion status of PTC cells was measured by the Transwell assay. Cells which have been starved within serum-free F12 medium for 24 hour were transferred into a 24-well Transwell with an 8-μm-pore membrane insert (Corning). The chemoattractant containing F12 medium with 10% PBS was put in the lower chamber. After 72 hour incubation, cells that penetrated the membrane were fixed with 95% ethanol and stained with crystal violet, and then, the invaded cells were observed and counted under the microscope.
Animal model
Twenty male BALB/c nude mice (Laboratory Animal Center of Southern Medical University) with an average age of 4 weeks and a mean weight of 16–18 g were obtained to build tumor growth models. Briefly, TPC-1 cells were subcutaneously injected into the neck of mice (1 × 10⁶ cells each mice). After 7 days when the tumor volumes were quantified, tumor sites within four groups of mice (5 mice per group) were transfected with four types of lentivirus expressing vectors (control, miR-221 inhibitors, TIMP3 siRNA+miR-221 inhibitors, and Lenti-TIMP3) for 14 days through direct injection (2 × 10⁷ units each time, twice a week). Tumor volume for each group was calculated every 2 days using the following formula: volume = (A × B2)/2, where A and B is the largest and the smallest diameter, respectively.
Statistical analysis
All statistical analyses were performed with SPSS 18.0 software (SPSS Inc., Chicago, IL). Data were displayed in the form of mean ± SD. Two-tailed student t test and 1-way analysis of variance were performed for assessing between-group comparisons and P < 0.05 provided evidence for statistically significant.
RESULTS
Upregulated miR-221 expressions in PTC tissues and cell lines
MiR-221 expression was shown to be remarkably increased in PTC tissues in comparison with pericarcinous tissues (P < 0.05, Figure 1A). Furthermore, in situ hybridization and immunohistochemistry confirmed that PTC tissues had higher miR-221 levels and lower TIMP3 protein levels than pericarcinous tissues (Figure 1C–F). Similarly, miR-221 expression was notably elevated in PTC cell lines (TPC-1 and BCPAP) in comparison with HEK293. The expression of miR-221 was much higher in TPC-1 compared with BCPAP (all P < 0.05, Table 3, Figure 1B).
FIGURE 1.
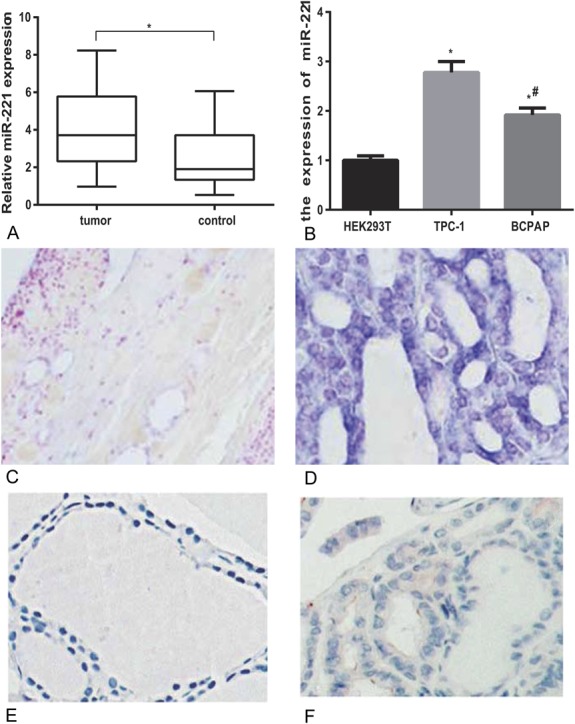
Expressions of miR-221 in tissues and cell lines of PTC. (A) Relative miR-221 expressions in PTC tissues and related peficancerous tissues. *represents P < 0.05 between tumor and control groups. (B) Increased miR-221 expression in PTC cell lines compared with normal cell lines. *represents P < 0.05 between TPC-1 and HEK293T groups; # represents P < 0.05 between BCPAP and HEK293T groups. (C, D) In situ hybridization of miR-221 in peficancerous tissues (C) and PTC tissues (D). (E, F) Immunohistochemical staining with TIMP3 in peficancerous tissues (E) and PTC tissues (F).
Table 3.
Expression of miR-221 in cell lines.

Suppressed TIMP3 expression induced by the binding of miR-221 to 3′ UTR of TIMP3
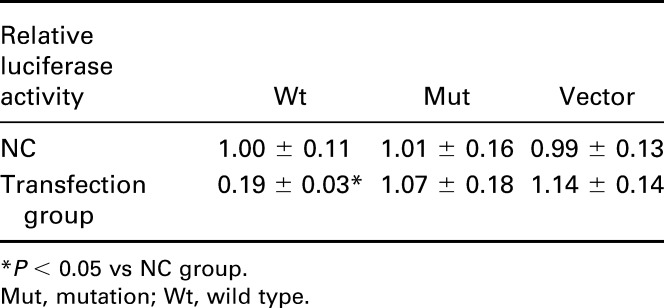
As suggested by online database (www.microrna.org), one highly conserved miR-221 binding site was predicted in 3′ UTR of TIMP3 (Figure 2A). The luciferase activity assay suggests that binding miR-221 and normal 3′ UTR of TIMP3 in TPC-1 cells could significantly decrease the relative luciferase activity (P < 0.05), whereas there was no remarkable difference observed between miR-221 vector and NC in both the control and Mut group (Table 4, Figure 2B).
FIGURE 2.
MiR-221 targets to the 3′ UTR of TIMP3. (A) Putative target sites predicted by online database (www.microrna.org). (B) Luciferase activity was carried out to verify the binding and interaction of miR-221 with TIMP3. *P < 0.05 vs NC group. WT: wild type of TIMP3-3′ UTR; Mut: TIMP3 mut-3′ UTR.
Table 4.
Relative luciferase activity in wt TIMP3, Mut TIMP3, and vector groups.
Increased TIMP3 expression induced by miR-221 inhibitors or Lenti-TIMP3
Compared with the control, NC, and Lenti-TIMP3 group, miR-221 expression was significantly decreased in the inhibitors and siTIMP3+inhibitors group (all P < 0.05). However, no significant differences existed among the control, NC, and Lenti-TIMP3 group or between the inhibitors and siTIMP3+inhibitors group (Table 5, Figure 3A). Moreover, cells transfected with miR-221 inhibitors and Lenti-TIMP3 displayed significantly increased TIMP3 compared with those of the control and NC group (all P < 0.05), whereas this trend was not observed between the siTIMP3+inhibitors and control group (Table 5, Figure 3B–C).
Table 5.
Expressional levels of miR-221 and TIMP3 within TPC-1 cells.

FIGURE 3.
Expressions of miR-221 and TIMP3 after transfection. (A) Quantitative data of mRNA level of miR-221 in cells with different controls (ie, NC, miR-221 inhibitors, siTIMP3+miRNA-221 inhibitors, and Lenti-TIMP3). (B) Western blot analysis of TIMP3 in cells with GAPDH as internal control. (C) Quantitative protein level of TIMP3 in cells. Data were presented as mean ± SD for 3 independent experiments. *P < 0.05 vs control group, #P < 0.05 vs NC group, ○P < 0.05 vs inhibitors group, □P < 0.05 vs siRNA+inhibitors group.
Effects of miR-221 on TPC-1 cell proliferation, apoptosis, and migration
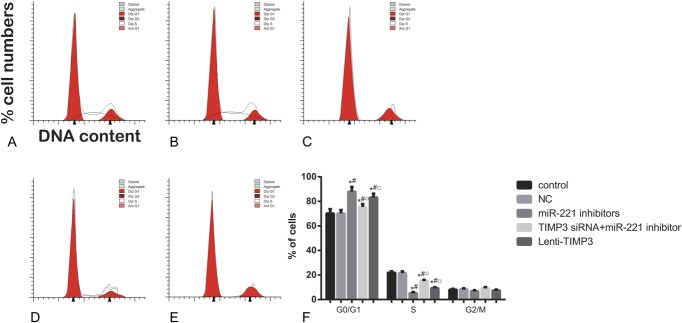
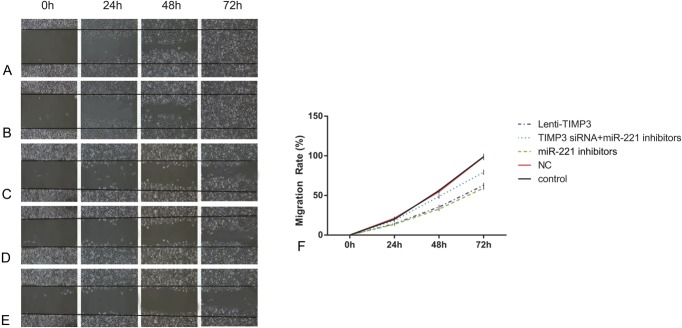
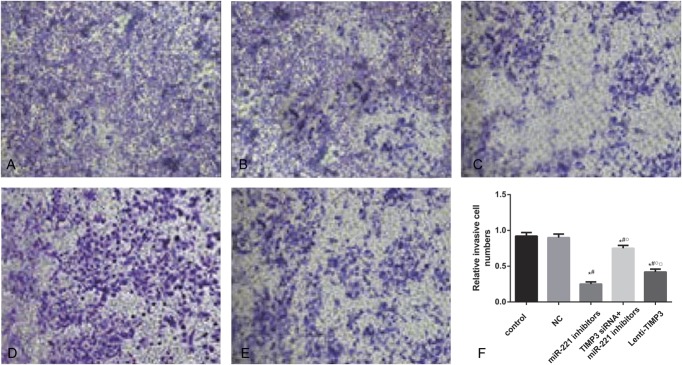
Compared with the control and NC group, cells transfected with miR-221 inhibitors exhibited significantly reduced proliferation rate after 72 hour (all P < 0.05, Table 6, Figure 4). Flow cytometry experiment revealed that the inhibitors group had more cells during G0/G1 phases and less cells in the S phases, whereas a significantly increased apoptosis rate was presented in the inhibitors group when compared with the control and NC group (all P < 0.05, Table 6, Figures 5, 6). Apart from that, wound-healing assay or Transwell assay indicated that the migration and invasion ability of cells was significantly restricted after transfection with miR-221 inhibitor (all P < 0.05, Table 6, Figures 7, 8).
Table 6.
Effects of miR-221 and TIMP3 on proliferation, apoptosis, migration, and invasion of TPC-1 cells.
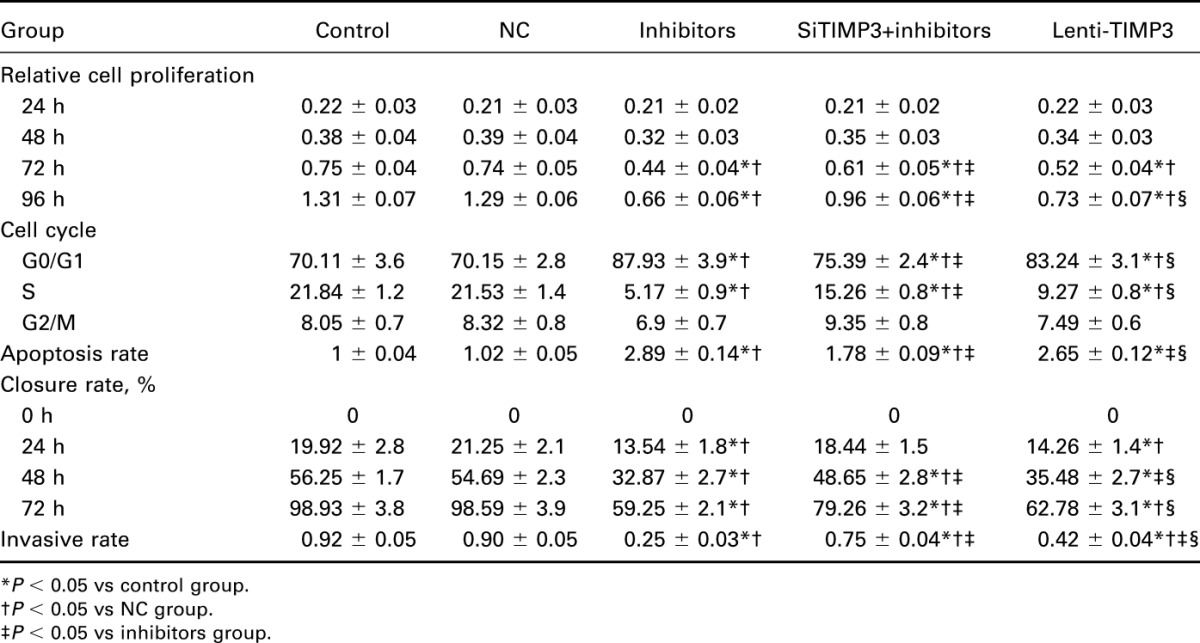
FIGURE 4.
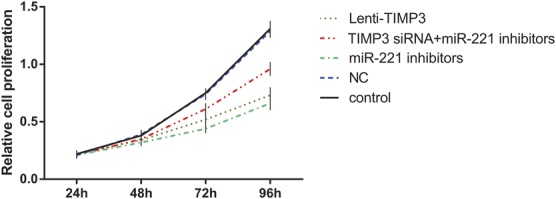
Effects of miR-221 inhibitors, TIMP3 siRNA and Lenti-TIMP3 on proliferation of TPC-1 cells with estimation of MTT assay. Data were presented as mean ± SD for 3 independent experiments.
FIGURE 5.
Distributions of cell cycles for each group of cells assessed by flow cytometry. (A–E) Distribution of cell DNA contents in groups of control (A), NC (B), miRNA-221 inhibitors (C), siTIMP3+ miRNA-221 inhibitors (D), and Lenti-TIMP3 (E). (F) Percentage of cells distributed in each phase of cell cycle. Data were presented as mean ± SD for 3 independent experiments. *P < 0.05 vs control group, #P < 0.05 vs NC group, ○P < 0.05 vs inhibitors group, □P < 0.05 vs siRNA+inhibitors group.
FIGURE 6.
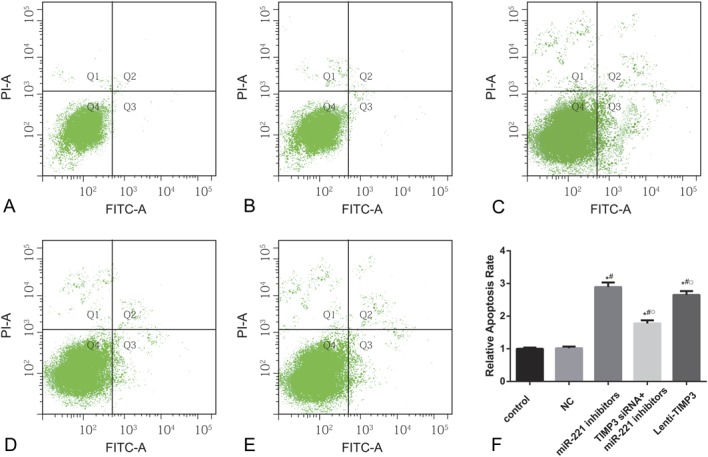
Apoptosis rate of cells in each group estimated by flow cytometry. (A–E) Apoptotic cell distribution of TPC-1 cells in groups of control (A), NC (B), miRNA-221 inhibitors (C), siTIMP3+ miRNA-221 inhibitors (D), and Lenti-TIMP3 (E). (F) Relative apoptosis rate of cells in each group. Data were represented as mean ± SD for 3 independent experiments. *P < 0.05 vs control group, #P < 0.05 vs NC group, ○P < 0.05 vs inhibitors group, □P < 0.05 vs siRNA+inhibitors group.
FIGURE 7.
Migration abilities of cells in each group evaluated by wound-healing assay. (A–E) Closure rates of cells in groups of control (A), NC (B), miRNA-221 inhibitors (C), siTIMP3+ miRNA-221 inhibitors (D), and Lenti-TIMP3 (E). (F) Closure rate of cells in each group at different time points (ie, 0, 24, 48, and 72 h). Data were presented as mean ± SD for 3 independent experiments.
FIGURE 8.
Invasion abilities of cells estimated by transwell experiments. (A–E) Amounts of cells that penetrated the insert membrane in groups of control (A), NC (B), miRNA-221 inhibitors (C), siTIMP3+miRNA-221 inhibitors (D), and Lenti-TIMP3 (E). (F) Relative invasive rates of cells in each group. Data were presented as mean ± SD for 3 independent experiments. *P < 0.05 vs control group, #P < 0.05 vs NC group, ○P < 0.05 vs inhibitors group, □P < 0.05 vs siRNA+inhibitors group.
Effects of TIMP3 expression on TPC-1 cell proliferation, apoptosis, migration, and invasion
When comparing the siTIMP3+inhibitors and Lenti-TIMP3 group, cells transfected with TIMP3 siRNA exhibited significantly stronger proliferation, migration, and invasion abilities along with lower apoptosis rate (all P < 0.05, Table 6, Figures 4–8), implying that TIMP3 siRNA could reverse the effects of miR-221 inhibitors on PTC cells. By contrast, cells in the Lenti-TIMP3 group which is characterized by overexpression of exogenous TIMP3 showed significantly impaired proliferation, migration, and invasion capacities along with higher apoptosis rate compared with the control, NC, and siRNA+inhibitors group (all P < 0.05, Table 6, Figures 4–8). Therefore, we suspected that the effects of Lenti-TIMP3 on PTC cells are similar to those of miR-221 inhibitors.
Results of animal model
To further investigate the effects of miR-221 and TIMP3 on PTC cells in vivo, a human PTC-bearing mice model was built by injecting TPC-1 cells to mice and forming transplantation tumors (Table 7, Figure 9). After tumors were separated from mice 21 days after model establishment, we discovered that the volume of tumor in the inhibitors and Lenti-TIMP3 group was close and was significantly smaller than that in the control, NC, and siTIMP3+inhibitors group (all P < 0.05, Table 8, Figure 10). In addition, the tumor volumes in the siTIMP3+inhibitors group were significantly higher than those of the miR-221 inhibitors and Lenti-TIMP3 group, but still lower than those of the control and NC group (all P < 0.05, Table 8, Figure 10).
Table 7.
Expression level of miR-221 and TIMP3 in mice models.

FIGURE 9.
Expressions of miR-221 and TIMP3 in nude mice model. (A) Quantitative data of mRNA level of miR-221 in mice models within 4 groups. (B) Western blot analysis of TIMP3 in mice models with GAPDH as internal controls. (C) Quantitative protein level of TIMP3 in mice models. Data were presented as mean ± SD for 3 independent experiments. *P < 0.05 vs control group, #P < 0.05 vs inhibitors group, ○P < 0.05 vs siRNA+inhibitors group.
Table 8.
Tumor volumes of mice model in each group.

FIGURE 10.
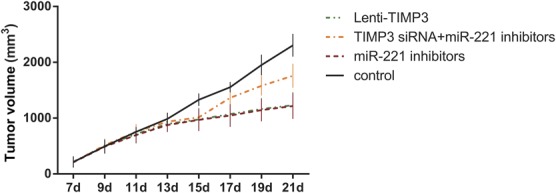
Effects of miR-221 inhibitors, TIMP3 siRNA, and Lenti-TIMP3 on tumor growth in vivo. Data were presented as mean ± SD for 3 independent experiments.
DISCUSSION
In this study, miR-221 expression was significantly elevated in both PTC tissues and TPC-1 cell lines. Upregulated miR-221 can impair the translation of TIMP3 mRNA by binding to its 3′ UTR, ultimately contributing to the proliferation, invasion, and metastasis of PTC cells. The interactive effects of miR-221 and TIMP3 on PTC cells in vivo were also validated using a human PTC-bearing mice model.
MiR-221, encoded in tandem on the human X chromosome, is highly conserved in vertebrates,22–24 and it has been manifested to be associated with various types of cancer. Mazeh et al25 reported that miR-221 has a relatively high diagnostic accuracy for thyroid cancer, with a sensitivity of 95% and a specificity of 100%. A study by Hu et al26 suggested that miR-221 may be a potential biomarker in diagnosing breast cancer. Furthermore, downregulated expressions of miR-221/222 cluster have been confirmed to enable glioma cells to enhance their sensitivity to temozolomide, which is a common chemical substance used in chemotherapy.27 This sensitization might be explained by the participation of MiR-221 in mediating damage repair DNA induced by radiotherapy within glioma cells through the activation of Akt,28 indicating the crucial role of miR-221 in the progression of cancer, including thyroid cancer.
TIMP3, a tumor suppressor, was found to be silenced by promoter methylation in PTC cells, and it was correlated with BRAFV600E mutation.29 Abnormal expression of TIMP3 has been demonstrated to be linked with pathogenesis of non–small-cell lung cancer, melanoma, gastric cancer, and prostate cancer.30–33 TIMP3 primarily affects tumor progression through modulating angiogenesis, endothelial cell apoptosis, and metastasis. To be specific, TIMP3 exerted its antiangiogenic effect through its direct interaction with vascular endothelial growth factor receptor-2 and apoptosis may be induced because of the potential association between TIMP3 and caspase-independent cell death pathway or another FAK-dependent survival pathway.34 Previous studies have illustrated that downregulation of miR-221 enhanced the sensitivity of breast cancer cells to tamoxifen through the upregulation of TIMP3,18 suggesting inhibitory effects of decreased miR-221 and increased TIMP3 on cancer development.
To sum up, proliferation and invasion of PTC cells were exacerbated when miR-221 was bound to TIMP3, both in vivo and in vitro. Nonetheless, because subjects incorporated in this study did not undergo chemotherapy or radiotherapy, it might be intriguing to explore the interactive effects of miR-221 and TIMP3 on tissues with diverse chemical substances.
Footnotes
The authors have no conflicts of interest to declare.
REFERENCES
- 1.Howlader N, Noone AM, Krapcho M, et al. SEER Cancer Statistics Review, 1975–2011. Bethesda, MD: National Cancer Institute; 2014:19. [Google Scholar]
- 2.Siegel RL, Miller KD, Jemal A. Cancer statistics, 2015. CA Cancer J Clin. 2015;65:5–29. [DOI] [PubMed] [Google Scholar]
- 3.Jemal A, Bray F, Center MM, et al. Global cancer statistics. CA Cancer J Clin. 2011;61:69–90. [DOI] [PubMed] [Google Scholar]
- 4.Shore R, Fleck F. Lessons from Fukushima: scientists need to communicate better. Bull World Health Organ. 2013;91:396–397. [DOI] [PMC free article] [PubMed] [Google Scholar]
- 5.Xing M. Molecular pathogenesis and mechanisms of thyroid cancer. Nat Rev Cancer. 2013;13:184–199. [DOI] [PMC free article] [PubMed] [Google Scholar]
- 6.Xing M, Haugen BR, Schlumberger M. Progress in molecular-based management of differentiated thyroid cancer. Lancet. 2013;381:1058–1069. [DOI] [PMC free article] [PubMed] [Google Scholar]
- 7.Jay C, Nemunaitis J, Chen P, et al. miRNA profiling for diagnosis and prognosis of human cancer. DNA Cell Biol. 2007;26:293–300. [DOI] [PubMed] [Google Scholar]
- 8.Li R, Liu J, Li Q, et al. miR-29a suppresses growth and metastasis in papillary thyroid carcinoma by targeting AKT3. Tumour Biol. 2015. 10.1007/s13277-015-4165-9. [DOI] [PubMed] [Google Scholar]
- 9.Huang C, Cai Z, Huang M, et al. miR-219-5p modulates cell growth of papillary thyroid carcinoma by targeting estrogen receptor alpha. J Clin Endocrinol Metab. 2015;100:E204–E213. [DOI] [PMC free article] [PubMed] [Google Scholar]
- 10.Liu L, Wang J, Li X, et al. MiR-204-5p suppresses cell proliferation by inhibiting IGFBP5 in papillary thyroid carcinoma. Biochem Biophys Res Commun. 2015;457:621–626. [DOI] [PubMed] [Google Scholar]
- 11.Wen Q, Zhao J, Bai L, et al. miR-126 inhibits papillary thyroid carcinoma growth by targeting LRP6. Oncol Rep. 2015;34:2202–2210. [DOI] [PubMed] [Google Scholar]
- 12.He H, Jazdzewski K, Li W, et al. The role of microRNA genes in papillary thyroid carcinoma. Proc Natl Acad Sci U S A. 2005;102:19075–19080. [DOI] [PMC free article] [PubMed] [Google Scholar]
- 13.Mardente S, Mari E, Consorti F, et al. HMGB1 induces the overexpression of miR-222 and miR-221 and increases growth and motility in papillary thyroid cancer cells. Oncol Rep. 2012;28:2285–2289. [DOI] [PubMed] [Google Scholar]
- 14.Suresh R, Sethi S, Ali S, et al. Differential expression of MicroRNAs in papillary thyroid carcinoma and their role in racial disparity. J Cancer Sci Ther. 2015;7:145–154. [DOI] [PMC free article] [PubMed] [Google Scholar]
- 15.Yip L, Kelly L, Shuai Y, et al. MicroRNA signature distinguishes the degree of aggressiveness of papillary thyroid carcinoma. Ann Surg Oncol. 2011;18:2035–2041. [DOI] [PMC free article] [PubMed] [Google Scholar]
- 16.Zhou YL, Liu C, Dai XX, et al. Overexpression of miR-221 is associated with aggressive clinicopathologic characteristics and the BRAF mutation in papillary thyroid carcinomas. Med Oncol. 2012;29:3360–3366. [DOI] [PubMed] [Google Scholar]
- 17.Garofalo M, Di Leva G, Romano G, et al. miR-221&222 regulate TRAIL resistance and enhance tumorigenicity through PTEN and TIMP3 downregulation. Cancer Cell. 2009;16:498–509. [DOI] [PMC free article] [PubMed] [Google Scholar] [Retracted]
- 18.Gan R, Yang Y, Yang X, et al. Downregulation of miR-221/222 enhances sensitivity of breast cancer cells to tamoxifen through upregulation of TIMP3. Cancer Gene Ther. 2014;21:290–296. [DOI] [PubMed] [Google Scholar]
- 19.Brierley JD, Panzarella T, Tsang RW, et al. A comparison of different staging systems predictability of patient outcome. Thyroid carcinoma as an example. Cancer. 1997;79:2414–2423. [PubMed] [Google Scholar]
- 20.Ou DL, Chen CL, Lin SB, et al. Chemokine receptor expression profiles in nasopharyngeal carcinoma and their association with metastasis and radiotherapy. J Pathol. 2006;210:363–373. [DOI] [PubMed] [Google Scholar]
- 21.Qian X, Dong H, Hu X, et al. Analysis of the interferences in quantitation of a site-specifically PEGylated exendin-4 analog by the Bradford method. Anal Biochem. 2014;465:50–52. [DOI] [PubMed] [Google Scholar]
- 22.Galardi S, Mercatelli N, Giorda E, et al. miR-221 and miR-222 expression affects the proliferation potential of human prostate carcinoma cell lines by targeting p27Kip1. J Biol Chem. 2007;282:23716–23724. [DOI] [PubMed] [Google Scholar]
- 23.Garofalo M, Quintavalle C, Romano G, et al. miR221/222 in cancer: their role in tumor progression and response to therapy. Curr Mol Med. 2012;12:27–33. [DOI] [PMC free article] [PubMed] [Google Scholar]
- 24.Waters PS, McDermott AM, Wall D, et al. Relationship between circulating and tissue microRNAs in a murine model of breast cancer. PLoS One. 2012;7:e50459. [DOI] [PMC free article] [PubMed] [Google Scholar]
- 25.Mazeh H, Mizrahi I, Halle D, et al. Development of a microRNA-based molecular assay for the detection of papillary thyroid carcinoma in aspiration biopsy samples. Thyroid. 2011;21:111–118. [DOI] [PubMed] [Google Scholar]
- 26.Hu Z, Dong J, Wang LE, et al. Serum microRNA profiling and breast cancer risk: the use of miR-484/191 as endogenous controls. Carcinogenesis. 2012;33:828–834. [DOI] [PubMed] [Google Scholar]
- 27.Chen L, Zhang J, Han L, et al. Downregulation of miR-221/222 sensitizes glioma cells to temozolomide by regulating apoptosis independently of p53 status. Oncol Rep. 2012;27:854–860. [DOI] [PubMed] [Google Scholar]
- 28.Li W, Guo F, Wang P, et al. miR-221/222 confers radioresistance in glioblastoma cells through activating Akt independent of PTEN status. Curr Mol Med. 2014;14:185–195. [DOI] [PubMed] [Google Scholar]
- 29.Anania MC, Sensi M, Radaelli E, et al. TIMP3 regulates migration, invasion and in vivo tumorigenicity of thyroid tumor cells. Oncogene. 2011;30:3011–3023. [DOI] [PubMed] [Google Scholar]
- 30.Das AM, Seynhaeve AL, Rens JA, et al. Differential TIMP3 expression affects tumor progression and angiogenesis in melanomas through regulation of directionally persistent endothelial cell migration. Angiogenesis. 2014;17:163–177. [DOI] [PubMed] [Google Scholar]
- 31.Shin YJ, Kim JH. The role of EZH2 in the regulation of the activity of matrix metalloproteinases in prostate cancer cells. PLoS One. 2012;7:e30393. [DOI] [PMC free article] [PubMed] [Google Scholar]
- 32.Yu JL, Lv P, Han J, et al. Methylated TIMP-3 DNA in body fluids is an independent prognostic factor for gastric cancer. Arch Pathol Lab Med. 2014;138:1466–1473. [DOI] [PubMed] [Google Scholar]
- 33.Xu C, Hou Z, Zhan P, et al. EZH2 regulates cancer cell migration through repressing TIMP-3 in non-small cell lung cancer. Med Oncol. 2013;30:713. [DOI] [PubMed] [Google Scholar]
- 34.Qi JH, Anand-Apte B. Tissue inhibitor of metalloproteinase-3 (TIMP3) promotes endothelial apoptosis via a caspase-independent mechanism. Apoptosis. 2015;20:523–534. [DOI] [PMC free article] [PubMed] [Google Scholar]


