Abstract
Most cochlear implants (CIs) activate their electrodes non-simultaneously in order to eliminate electrical field interactions. However, the membrane of auditory nerve fibers needs time to return to its resting state, causing the probability of firing to a pulse to be affected by previous pulses. Here, we provide new evidence on the effect of pulse polarity and current level on these interactions. In experiment 1, detection thresholds and most comfortable levels (MCLs) were measured in CI users for 100-Hz pulse trains consisting of two consecutive biphasic pulses of the same or of opposite polarity. All combinations of polarities were studied: anodic-cathodic-anodic-cathodic (ACAC), CACA, ACCA, and CAAC. Thresholds were lower when the adjacent phases of the two pulses had the same polarity (ACCA and CAAC) than when they were different (ACAC and CACA). Some subjects showed a lower threshold for ACCA than for CAAC while others showed the opposite trend demonstrating that polarity sensitivity at threshold is genuine and subject- or electrode-dependent. In contrast, anodic (CAAC) pulses always showed a lower MCL than cathodic (ACCA) pulses, confirming previous reports. In experiments 2 and 3, the subjects compared the loudness of several pulse trains differing in current level separately for ACCA and CAAC. For 40 % of the electrodes tested, loudness grew non-monotonically as a function of current level for ACCA but never for CAAC. This finding may relate to a conduction block of the action potentials along the fibers induced by a strong hyperpolarization of their central processes. Further analysis showed that the electrodes showing a lower threshold for ACCA than for CAAC were more likely to yield a non-monotonic loudness growth. It is proposed that polarity sensitivity at threshold reflects the local neural health and that anodic asymmetric pulses should preferably be used to convey sound information while avoiding abnormal loudness percepts.
Keywords: polarity sensitivity, channel interactions, auditory nerve, facilitation, cathodal block
Introduction
Several studies have shown that direct electrical field interactions between cochlear implant (CI) electrodes can be eliminated by presenting pulses sequentially instead of simultaneously (e.g., Favre and Pelizzone 1993). This finding has formed the basis of most modern CI coding schemes which are derived from the continuous interleaved sampling strategy (Wilson et al. 1991). However, the membrane of auditory nerve fibers needs time to return to its resting state, causing the probability of firing in response to a pulse to be affected by previous pulses. This implies that continuous interleaved sampling (CIS)-like strategies also lead to temporal interactions within and between channels. These interactions result from a combination of several processes operating at different time ranges at the level of the auditory nerve (see Boulet et al. 2016 for a review). Short-term interactions (<1 ms), which include facilitation and refractoriness are particularly important in contemporary strategies that use relatively high pulse rates and short interpulse intervals (Middlebrooks 2004).
To measure these short-term interactions psychophysically, the paradigm used in several studies has been to present a pre-pulse at suprathreshold or subthreshold level and to measure the detection threshold of a probe pulse presented subsequently on the same or on an adjacent electrode (Eddington et al. 1994; de Balthasar et al. 2003; Karg et al. 2013). When the first pulse is suprathreshold, the second pulse is masked (i.e., its threshold increases), likely reflecting the effect of refractoriness. These masking effects have been observed both psychophysically and in eCAP studies (Nelson and Donaldson 2001; de Balthasar et al. 2003; Morsnowski et al. 2006). When the pre-pulse is subthreshold, however, the detection of the probe pulse can sometimes be enhanced (facilitated). Interestingly, this effect was shown to depend on the relative polarity of the pre- and probe pulses. When the second phase of the pre-pulse and the first phase of the probe pulse have the same polarity, threshold is reduced compared to when they are different.
These observations are consistent with a simple leaky integrator model of the neural membrane. Figure 1 shows how the simulated transmembrane potential evolves as a function of time for pairs of pulses with adjacent phases having the same or opposite polarities (Macherey et al. 2007). As shown by the upward-pointing arrows, when the adjacent phases have the same polarity (Fig. 1a, b), the transmembrane potential reaches a higher absolute value than when they are different (Fig. 1c, d), thereby yielding a lower threshold. In extracellular stimulation such as in CIs, a current of any polarity induces depolarization and hyperpolarization of the neural membrane at different locations while a current of opposite polarity produces the opposite pattern of polarization. This means that the transmembrane potential shown in Figure 1 would be valid for particular sites on a given fiber but that a qualitatively opposite pattern would be obtained at other sites, with the precise pattern depending on the membrane characteristics at each site. This implies that the reduction in threshold observed when presenting two pulses with adjacent phases of the same polarity may be expected when these adjacent phases are both either cathodic (Fig. 1a) or anodic (Fig. 1b). We will refer to this effect as a temporal interaction based on the “relative” polarity of the pulses. Nevertheless, if the depolarization produced by a given polarity is stronger than that produced by a current of opposite polarity, this temporal interaction measure may also be influenced by which absolute polarity the two adjacent phases have.
FIG. 1.
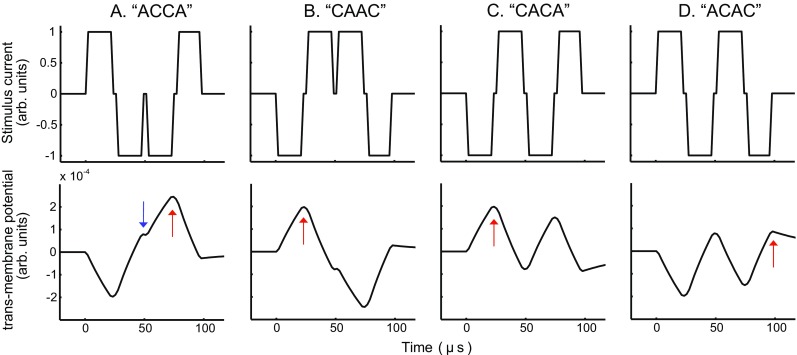
Simulated transmembrane potential in response to pairs of pulses differing in polarity. The simulations correspond to the leaky integrator unit of the model of Macherey et al. (2007) which has a time constant of 94 μs. A, B: response to a pair of pulses with different leading polarities; C, D: response to a pair of pulses with the same leading polarities. The upward-pointing arrows show the peak potentials obtained for the different pulse shapes while the downward-pointing arrow in panel A shows the peak potential that would be obtained for the AC biphasic pulse shape
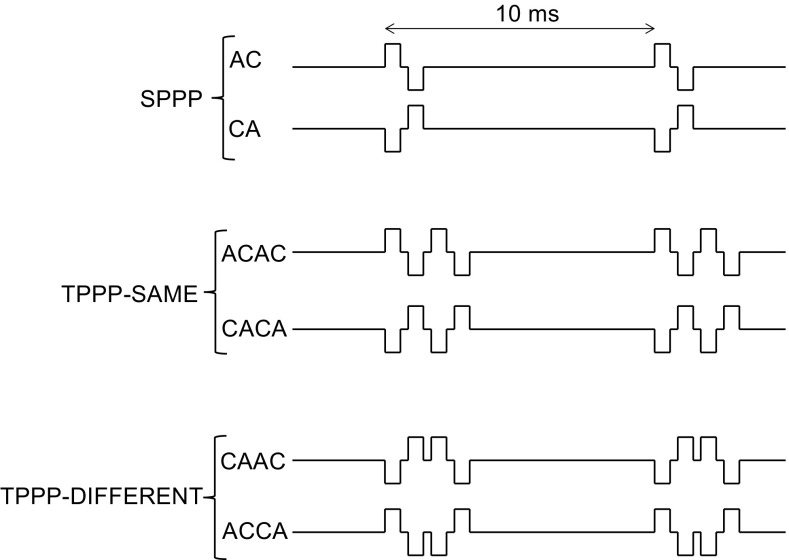
In previous studies, the leading polarity of the probe pulse was fixed while the leading polarity of the pre-pulse changed during the psychophysical procedure. In one study, the probe pulse had a cathodic-leading polarity (Eddington et al. 1994), while in another study, it had an anodic-leading polarity (de Balthasar et al. 2003). The fact that these two studies both reported that threshold was lower when the adjacent phases had the same polarity than when they were different suggest that both polarities may be effective at threshold and that both would induce temporal interactions at the auditory nerve level. However, it remains unclear whether one polarity has a stronger effect than the other because these data were not collected in the same subjects. Only recently, Karg et al. (2013) investigated all four combinations of pre- and probe pulse polarities in the same group of subjects. They fixed the pre-pulse at 80 % of its detection threshold and measured the threshold of a probe pulse. They also found a greater threshold reduction when the adjacent phases had the same polarity than when they were different. One potential limitation of studies using subthreshold pre-pulses is the fact that, although the pre-pulse is subthreshold at the perceptual level, it does not imply that it is subthreshold at the neural level. The pre-pulse may still excite some fibers, thereby contributing itself to the detection of the stimulus. By reversing the polarity of this pre-pulse and measuring the threshold of an opposite polarity probe pulse, two factors may influence detection threshold. First, the number of fibers excited by the pre-pulse may be different from one leading polarity to another and, second, the amount of facilitation (or enhancement) may vary depending on the polarity of the adjacent phases. Because it is not possible to disentangle these two effects, it remains difficult to evaluate the effect of the absolute polarity of the adjacent phases in such a paradigm. In experiment 1, we replicate the interaction measure of Karg et al. (2013) using two-pulse stimuli for which pre- and probe pulses have an equal amplitude that is varied across the procedure. In this configuration, any difference in detection threshold between ACCA and CAAC (Fig. 2) would imply an effect of absolute polarity because each of these two pulse shapes is made of the same two biphasic pulses; only their order of presentation changes. This means that any threshold difference between ACCA and CAAC would necessary be due to interactions between the two biphasic pulses they each contain.
FIG. 2.
Schematics of the stimuli used in the different experiments. “SPPP” and “TPPP” stand for single-pulse-per-period and two-pulses-per-period, respectively; “A” and “C” for anodic and cathodic, respectively
Furthermore, to our knowledge, the effect of pulse polarity on temporal interactions has not been measured when both pre- and probe pulses are presented at a relatively high current level. This situation is relevant because it is representative of what subjects experience everyday with their CI processor. When the current level is increased, it is possible that refractory effects dominate and that the polarity of the second pulse relative to the first pulse matters less. Alternatively, we have shown in several studies that at high current levels, the auditory nerve fibers are mainly excited by the anodic phase of the pulse so we may expect an effect of absolute polarity at such levels (e.g., Macherey et al. 2008). We therefore also present loudness balancing data between the different pulse configurations shown in Figure 2. Finally, experiments 2 and 3 focus on measuring the shape of the loudness growth functions for a subset of pulse combinations. We show that loudness growth is always monotonic for the CAAC stimuli but is often non-monotonic for ACCA stimuli, and discuss the results in terms of biophysical principles of electrical stimulation of the auditory nerve.
Experiment 1: Temporal Interactions at Threshold and Most Comfortable Loudness
Rationale and Methods
Seven users of the Cochlear CI24M, CI24RE, or CI512 device (subjects C1-C7) took part; their details are shown in Table 1. They were all implanted with a nucleus contour advance electrode array. The experiment was performed using the APEX2 software (Laneau et al. 2005) which served as an interface with the Nucleus Implant Communicator (NIC2) library provided by Cochlear Corporation. All stimuli were presented via the L34 research processor. Detection thresholds and most comfortable levels (MCLs) were measured for six different 400-ms electrical pulse trains presented in monopolar MP1 + 2 mode on a middle channel of the array (electrode 11). The period of all pulse trains was 10 ms. Two of the stimuli were anodic-first (AC; Fig. 2a) and cathodic-first (CA; Fig. 2b) single-pulse-per-period (SPPP) pulse trains. The remaining four stimuli were two-pulses-per-period pulse trains (TPPP) consisting of a symmetric biphasic pulse followed by another identical pulse of the same or of opposite leading polarity. As shown in Fig. 2, all four combinations of pulse polarities were studied. The TPPP pulses either had the same leading polarity (“ACAC” and “CACA”) or different leading polarities (“ACCA” and “CAAC”). The phase duration was 42 μs, and the pulses had an interphase gap of 8 μs. For the TPPP pulse trains, the two pulses were also separated by an interpulse interval of 8 μs.
TABLE 1.
Subject details including age, duration of deafness (DD), and duration of cochlear implant use (CI use) in years (y), as well as etiology and type of implant
| Age (y) | DD (y) | CI use (y) | Etiology | Implant | Electrode | |
|---|---|---|---|---|---|---|
| C1 | 57 | 1 | 8 | Rubella | CI24M | Contour advance |
| C2 | 55 | 4 | 3 | Genetic, progressive | CI24RE | Contour advance |
| C3 | 79 | 1 | 4 | Genetic | CI24RE | Contour advance |
| C4 | 73 | 5 | 2 | Genetic, hereditary | CI512 | Contour advance |
| C5 | 57 | 1 | 25 | Genetic | CI24RE | Contour advance |
| C6 | 25 | 1 | 3 | Post-chemotherapy | CI512 | Contour advance |
| C7 | 49 | Unknown | 2 | Unknown | CI512 | Contour advance |
| C8 | 49 | 1 | 8 | Genetic | CI24RE | Contour advance |
| A1 | 69 | Unknown | 4 | Unknown | HiRes90k | HiFocus 1j |
| A2 | 55 | Unknown (onset at 33 years) | 6 | Acquired, post-ototoxicity | HiRes90k | HiFocus 1j |
| A3 | 54 | 5 | 2.5 | Idiopathic | HiRes90k | HiFocus 1j |
| A4 | 70 | 7 | >12 | Unknown, progressive | HiRes90k | HiFocus 1j |
| A5 | 83 | Unknown | 3 | Unknown | HiRes90k | HiFocus 1j |
Thresholds were measured in a two-down, one-up, two-interval adaptive forced-choice task with feedback. For each measure, the procedure stopped after eight reversals with the mean of the last six reversals taken as the threshold estimate. The initial step size was 0.70 dB for subject C1 and 0.63 dB for subjects C2-C7 and switched to 0.18 and 0.16 dB after the second reversal, respectively. The order of presentation was randomized across conditions, and three estimates were initially obtained. For conditions for which the standard deviation was larger than 0.5 dB in a given subject, at least two more measures were performed, and all measures were then averaged.
The six stimuli were then loudness-balanced at their MCL. A first estimate of MCL was obtained for each stimulus using a loudness chart labeled from 1 (inaudible) to 10 (too loud), 6 corresponding to the MCL. The current level was progressively increased, starting from 0 up to a level perceived as “loud but comfortable” and labeled “7” on the chart. The loudness balancing procedure was then identical to that used in several previous publications (e.g., Macherey et al. 2006). Each of the five stimuli AC, CA, ACAC, CACA, CAAC was first balanced to ACCA. The subjects heard two sounds separated by a gap of 400 ms. The first sound was ACCA fixed at its MCL (level “6” on the chart), and the second sound was one of the other five stimuli presented either at a “soft” or at a “comfortably loud” level. The subjects were asked to press virtual buttons displayed on a PC screen that could either increase or decrease the level of the second sound by 0.18, 0.35, or 0.53 dB for S1, and by 0.16, 0.31, and 0.47 dB for S2–S7. After each button press, the same two sounds were presented again except that the level of the second sound was updated according to the subject’s previous response. When the subjects perceived the two sounds as being equal in loudness, they were asked to press a button labeled “ok”. At least two estimates per comparison were obtained, half for each starting level. Then, the order of the two sounds was swapped and the subjects had to adjust the level of ACCA to match the loudness of each of the other sounds presented at the mean level obtained in the previous adjustments. Once more, at least two adjustments per condition were performed in this counterbalanced order. The loudness-balanced MCL of all stimuli except ACCA was finally obtained by subtracting the mean difference obtained in the adjustments from the MCL of ACCA.
All the experiments presented here were approved by the appropriate research committees for Marseille (CPP Sud-Méditerranée 2) and the East of England.
Results
Figure 3 shows the mean thresholds and standard errors obtained for each subject (panel C1-C7), as well as the mean across subjects (bottom right panel). The data were analyzed in a two-way repeated measure ANOVA with factors PULSE SHAPE (3 levels: SPPP, TPPP “same”, and TPPP “different”) and POLARITY (2 levels: “anodic” and “cathodic”). According to previous animal data (Macherey and Cazals 2016), we expect the polarity of the leading phase of symmetric pulses (SPPP and TPPP “same”) to have a dominant effect on neural excitation while we expect the polarity of the central phases of the TPPP “different” to be dominant. Therefore, the so-called “anodic” pulse shapes were AC, ACAC, and CAAC while the “cathodic” pulse shapes were CA, CACA, and ACCA.
FIG. 3.
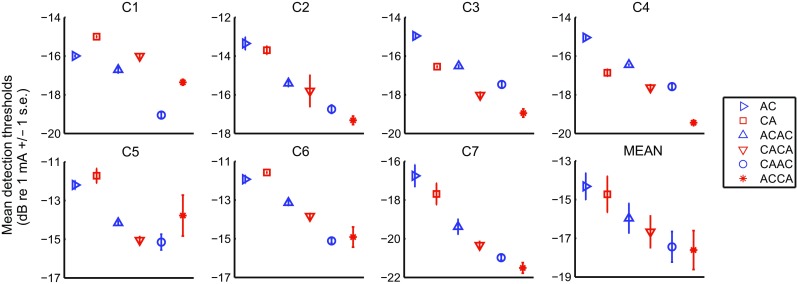
Results of experiment 1. Individual threshold data and mean across subjects for the six stimuli. Error bars represent standard errors of the mean, as in subsequent panels
There was a highly significant effect of pulse shape (F(2,12) = 74.51, p < 0.001) but no effect of polarity (F(1,6) = 1.30, p = 0.30) nor of the interaction (F(2,12) = 1.88, p = 0.19). Not surprisingly, paired-samples t tests with Bonferroni correction showed that the mean threshold of the two SPPP stimuli were 1.8 and 3 dB higher than the mean thresholds of the TPPP-same (p = 0.002) and TPPP-different (p < 0.001) stimuli, respectively. However, when compared in terms of charge units, the SPPP stimuli required less charge to reach threshold than all TPPP stimuli. This is consistent with previous data showing that increasing the phase duration and/or adding polarity reversals into a pulse makes it less effective (Moon et al. 1993; Bahmer and Baumann 2013). Thresholds were also 1.2 dB lower (p = 0.008) for TPPP-different (ACCA and CAAC) than for TPPP-same (ACAC and CACA). This difference confirms previous reports that there is an effect of relative polarity on temporal interactions between consecutive pulses.
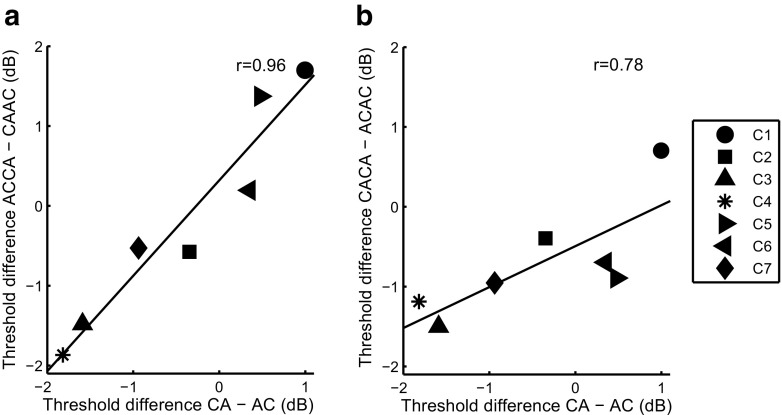
Closer inspection of individual data indicates that different subjects showed differences in polarity sensitivity at threshold. For example, C1 and C5 had lower thresholds for CAAC than for ACCA while C3 and C4 had lower thresholds for ACCA than for CAAC. Interestingly, this sensitivity to polarity was also observed for AC vs. CA and for ACAC vs. CACA. This is illustrated in Fig. 4a which shows the threshold difference between AC and CA plotted against the threshold difference between CAAC and ACCA. These threshold differences were strongly correlated, as can be seen from the fact that, for each subject, the difference between the two leftmost and two rightmost points was always in the same direction (two-tailed test, r = 0.96, p < 0.001). There was also a trend for the threshold difference between ACAC and CACA to be correlated with the threshold difference between AC and CA (r = 0.78, p = 0.039; cf Fig. 4b) and with the threshold difference between CAAC and ACCA (r = 0.72, p = 0.066), although none of these two correlations are significant after Bonferroni correction. These findings seem consistent with the assertion, made at the start of this section, that threshold is dominated by the initial phase of SPPP and TPPP-same stimuli, and by the central phases of TPPP-different stimuli (ACCA and CAAC). The strong correlation between the threshold differences obtained for the SPPP stimuli and those obtained for the TPPP-different stimuli also suggests that the subject-specificity polarity effects are genuine, rather than due to measurement noise.
FIG. 4.
Correlation between polarity differences in threshold for different pulse shapes
Figure 5 shows the loudness-balanced MCLs for the different conditions and the seven subjects. The same analysis as for the threshold data was performed. Here again, the effect of pulse shape was significant (F(2,12) = 127.67, p < 0.001), showing lower MCLs for TPPP-same (p = 0.001) and TPPP-different (p < 0.001) than for SPPP stimuli. These differences were, however, smaller than for the threshold data and amounted to 0.6 and 1.7 dB, respectively. Hence, when expressed in terms of charge, the greater efficiency for SPPP compared to TPPP stimuli, observed at threshold, was even more pronounced at MCL. The MCL for the TPPP-different was also lower than for the TPPP-same stimuli by 1 dB on average (p < 0.001). In contrast to the threshold data, both the effect of polarity (F(1,6) = 76.34, p < 0.001) and the interaction between pulse shape and polarity (F(2,12) = 35.08, p < 0.001) were significant. Although the effect of polarity was not consistent across subjects for the SPPP and for the TPPP-same pulse shapes, it was consistent and large in magnitude for the TPPP-different pulse shape. More specifically, the level of ACCA was adjusted 2.9 dB higher on average than that of CAAC to reach the same loudness. This is consistent with findings obtained at MCL by Carlyon et al. (2013) with similar pulse shapes. This effect of polarity was specific to this pulse shape and, contrary to the threshold data, no correlation between the MCL polarity differences across pulse shapes was observed.
FIG. 5.
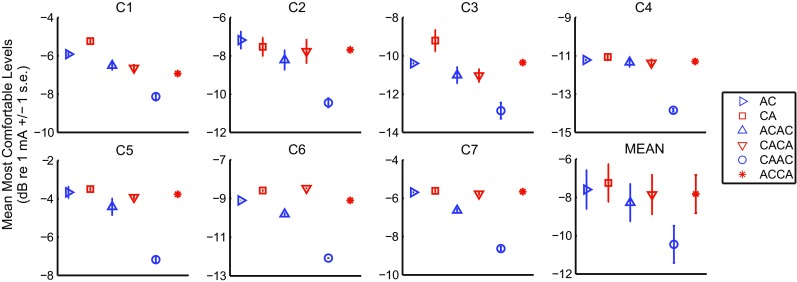
Results of experiment 1. Individual MCL data and mean across subjects for the six stimuli
Discussion
The results of experiment 1 confirm previous publications showing that there is an effect of the relative polarity of consecutive biphasic pulses on the temporal interactions produced at threshold level. More specifically, thresholds are overall smaller for TPPP-different than for TPPP-same (Eddington et al. 1994; de Balthasar et al. 2003; Karg et al. 2013). Our data also extend this finding to higher levels (MCLs).
Our results also reveal an effect of absolute polarity on the magnitude of these interactions. At threshold, although no effect of polarity was observed in the main analysis, individual subjects showed consistent polarity differences across pulse shapes, as reflected by the significant correlation between the threshold difference CAAC and ACCA-CAAC (cf Fig. 4a). To illustrate the potential mechanisms responsible for this polarity effect, let us consider the subjects showing a lower threshold for CA than for AC. Their polarity sensitivity may possibly reflect the combination of two mechanisms. First, it is possible that threshold is reached when the site depolarized by the cathodic phase reaches a certain potential. As shown by the arrows in Figure 1, the maximum value of the potential reached during the cathodic phase of CA (which is equal to that obtained at the end of the first phase of the CAAC waveform as shown by the upward-pointing arrow in Figure 1b) is larger than that reached during the cathodic phase of AC (which is equal to that obtained at the end of the second phase of the ACCA waveform as shown by the downward-pointing arrow in Fig. 1a). For the same reason, it is larger for CACA (Fig. 1c) than for ACAC (Fig. 1d). Finally, it is also larger for ACCA, in which the two cathodic phases are adjacent and for which the maximum potential is reached at the end of the third phase (upward-pointing arrow in Fig. 1a), than for CAAC, where the cathodic phases are separated by two anodic phases. Another possibility that cannot be excluded is that, for these same subjects, AC, ACAC, and CAAC mainly excite the fibers with their anodic phase (s), i.e., at locations where the membrane is depolarized by the anodic phase (and hyperpolarized by the cathodic phase), but that the magnitude of this depolarization remains smaller than that produced by the so-called cathodic pulses (i.e., their polarity-inverted version). A similar reasoning can be applied to subjects showing a higher sensitivity to the anodic pulses (AC, ACAC, and CAAC) than to the cathodic pulses (CA, CACA, and ACCA).
Most data from the literature investigating polarity effects in CI users have focused on the differences obtained at MCL. At threshold, however, no overall effect of polarity was previously found for pseudomonophasic pulses consisting of a first high-amplitude, short-duration phase followed by a lower-amplitude and longer-duration second phase (Macherey et al. 2006; Undurraga et al. 2013). The data of Karg et al. (2013) did show individual variability in threshold difference between AC and CA but these across-subject differences were not specifically investigated. The data of experiment 1 demonstrate that, at threshold, auditory nerve fibers are sometimes polarity sensitive and that a cathodic current can, in some cases, be more effective than an anodic current. This is, to our knowledge, the first time such polarity sensitivity is observed at threshold in CI subjects.
Modeling studies have suggested that the polarity sensitivity of auditory nerve fibers may relate to the degeneration and/or demyelination state of the peripheral processes (Rattay et al. 1999, 2001). In these studies, Rattay et al. predicted that degenerated fibers would be more sensitive to anodic currents while fibers with healthy peripheral processes would be more sensitive to cathodic currents. It is possible that the effect of polarity observed in experiment 1 reflects different degrees of degeneration in our subjects, and the implications of this hypothesis will be considered further in the discussion section of experiment 3.
The observation that CAAC requires less current to reach MCL than ACCA is consistent with several studies showing that for a wide range of asymmetric pulse shapes, including pseudomonophasic, triphasic, or quadraphasic pulses, MCLs are lower for anodic than for cathodic pulse shapes (Macherey et al. 2006, 2008; Carlyon et al. 2013). Note, we found this higher sensitivity to CAAC in all our subjects, including those who showed the opposite polarity sensitivity at threshold. For triphasic and quadraphasic pulse shapes, which are most similar to the TPPP-different stimuli used here, the polarity effect found by Carlyon et al. (2013) ranged from 0.34 to 1.7 dB on average, which is slightly smaller than the mean of 2.9 dB observed in our subjects. It is also worth noting that this polarity effect has only been observed with asymmetric pulses in the past, and not with symmetric pulses (Macherey et al. 2006). Similarly, here, there was no effect of polarity at MCLs for SPPP and TPPP-same stimuli.
Experiment 2: Effect of Pulse Polarity on the Shape of the Loudness Growth Function
Rationale and Methods
While measuring the MCL for ACCA using the loudness chart in experiment 1, three subjects spontaneously reported the loudness of the stimulus to sometimes decrease despite the fact that the experimenter always increased the current level. Experiment 2 was designed to test if this informal report could be confirmed in a controlled experiment.
The same seven subjects took part in a loudness ranking task where they had to compare the loudness of pulse trains only differing in current level. This task was performed solely and separately for ACCA and CAAC. The stimulus parameters were the same as in experiment 1. For each pulse combination, the top ¾ of the dynamic range was sampled in 11 current steps equally spaced on a dB scale. The current level difference between two stimuli ranged from 0.31 to 1.1 dB depending on the subject’s dynamic range. The ranking task used the mid-point comparison procedure which has the advantage of not requiring a monotonic relationship between the physical dimension of interest (here the current level) and the percept (Macherey and Carlyon 2014). This optimally efficient procedure has been described in detail in previous publications (e.g., Long et al. 2005) and consisted of making loudness comparisons between pairs of sounds to rank them in loudness. Twelve repeats of the procedure per condition were obtained, leading to a mean rank and standard error of the mean. The presentation of the ACCA and CAAC blocks alternated, and no feedback was provided.
Results
Figure 6 shows the loudness ranks obtained for ACCA and CAAC for each of the seven subjects as a function of current level expressed in percentage of the dynamic range. Note that although the two functions are plotted in the same panel, they were obtained separately, and therefore, do not reflect loudness differences between pulse shapes. The loudness growth function was monotonic for all subjects for CAAC (circles), showing an increase in loudness as a function of current level. For ACCA (asterisks), however, five subjects showed a non-monotonic growth. At some point in the dynamic range, loudness decreased with increases in level. This decrease could sometimes be large as illustrated by subject C6 who showed that the loudness of a stimulus at 60 % of its dynamic range was the same as that of a stimulus at 25 % of the dynamic range.
FIG. 6.
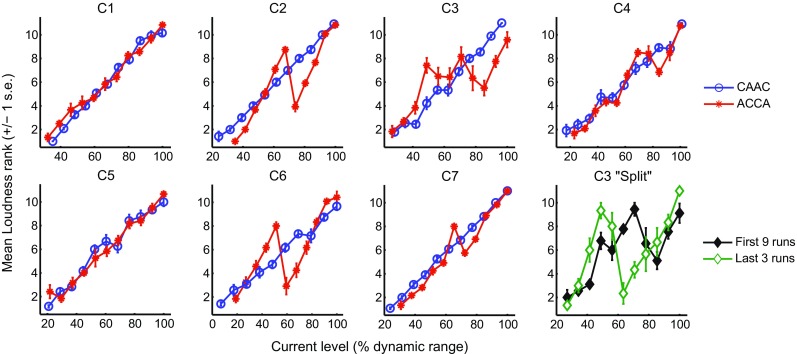
Results of experiment 2. Mean loudness ranks obtained for ACCA and CAAC as a function of current level (expressed as a percentage of the dynamic range in dB). The means were calculated over 12 repetitions. The bottom right panel shows the data of subject C3 for ACCA separately for the first nine and the last three repetitions of the procedure. Note the CAAC loudness rank function for C6 only shows 10 points because the very first level tested in this subject was subthreshold due to a mistake in setting up the experiment file. Its corresponding rank does not have any meaning and is, therefore, not shown
Paired-sample t tests were performed on the individual ranks obtained in each subject comparing the rank of level i with that of level i + 1 (for i ranging from 1 to 10) and also comparing the rank of level i with that of level i + 2 (for i ranging from 1 to 9). The analyses showed that the loudness reversal was significant for four out of the five subjects, i.e., for C2, C4, C6, and C7 (p < 0.05). Among these p values, three survived the Bonferroni correction (for C2, C4, and C6) while that for C7 did not. Closer inspection of the data of subject C3 revealed that the 12 iterations of the procedure could be divided into two blocks. The means of the first nine and of the last three iterations are shown in the bottom right panel of Figure 6. While the two functions both show a clear loudness reversal, the level at which this reversal occurs differs. Nothing particular occurred between these two blocks of trials except that the subject took a short break.
Discussion
Although non-monotonic loudness growths were only obtained for the ACCA and not for the CAAC pulse shape, a major difference between these two pulse shapes was their dynamic range. As shown in Fig. 5, the MCLs of CAAC were much lower than those of ACCA and, in four out of the five non-monotonic subjects, the current level at which the loudness reversal occurred for ACCA was above the MCL of CAAC. It is, therefore, unclear whether the loudness reversals were specific to the ACCA pulse shape or specific to a certain current level. To address this question and to test whether this non-monotonic loudness growth could occur for clinical biphasic pulses, three subjects (C2, C3, and C6) performed an additional set of loudness comparisons for the CA pulse shape (cf Fig. 2) which is the pulse shape used in clinical processors. For C2 and C3, 11 stimulus levels were ranked while only 9 levels were ranked for C6 due to his limited dynamic range. Figure 7 shows the same loudness ranks as in Figure 6 replotted as a function of absolute current level as well as the results obtained for the CA pulse shape in these three patients (square symbols). It is clear that, for C2 and C3, at the same current level at which the non-monotonic behavior is observed for ACCA, the shape of the loudness growth function remains monotonic for CA. For C6, the CA loudness function also grows monotonically, but the minimum level tested was above the reversal obtained for ACCA. In conclusion, the non-monotonic trend seems specific to the ACCA pulse shape and not to a particular current level. We also note that the two subjects (C1 and C5) who showed a monotonic behavior for ACCA are those who showed lower thresholds for CAAC than for ACCA. We will investigate in experiment 3 if this relation holds when testing more subjects and more electrodes.
FIG. 7.
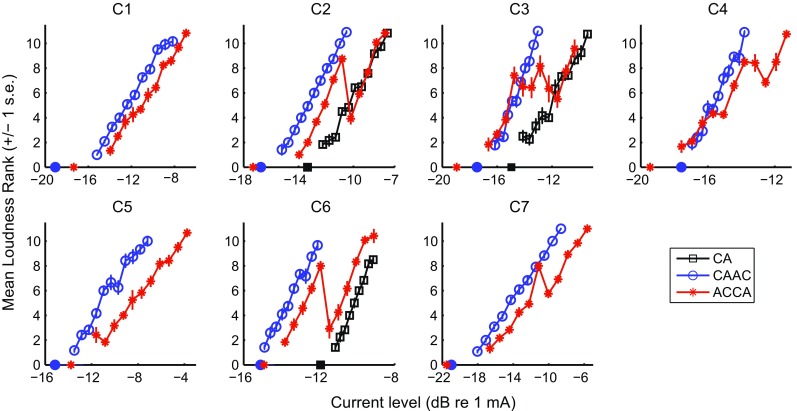
Results of experiment 2. Same as Figure 6 except that the ranks are illustrated as a function of absolute current level. For C2, C3, and C6, the additional ranking data obtained with the CA stimulus are also shown. The isolated symbols displayed on the x-axis represent the threshold values for the different pulse shapes
A possible neural correlate of this loudness decrease might be a decrease in the amount of neural activity produced at the level of the auditory nerve. Reductions in neural responses with increases in current level have been previously observed in several electrophysiological and modeling studies. Hartmann et al. (1984) measured cat single-auditory nerve fibers responses to sinusoidal electrical stimulation and found that the function relating discharge rate to current level was sometimes non-monotonic, showing a decrease after an initial increase. Miller et al. (1998) measured the amplitude of the electrically evoked compound action potential for implanted cats and guinea pigs using monophasic cathodic and anodic pulses. One of their cats showed non-monotonic eCAP growth functions. This non-monotonic behavior was observed both for anodic and cathodic stimulation and occurred at the same current level for both. Recently, Macherey and Cazals (2016) observed non-monotonic growth functions of the inferior colliculus evoked potential in response to intracochlear stimulation of the guinea pig. They also reported that this behavior occurred more often for cathodic than for anodic pulse shapes which seems consistent with the present data. A hypothesis that we will describe in the General Discussion is that the loudness reversals may relate to a decrease in firing induced by the blocking of action potentials along the auditory nerve fibers. In their computational model of the guinea pig cochlea, Frijns et al. (1996) predicted such blocking in response to cathodic stimulation but not in response to anodic stimulation. Finally, an alternative explanation for the loudness reversals could be that they reflect a change in sound quality (for example a change in pitch) that subjects label as a change in loudness. However, we will see in experiment 3 that this non-monotonic behavior can also occur at detection threshold, making this possibility quite unlikely.
Experiment 3: Effect of Electrode Location and Implant Design on the Shape of the Loudness Growth Function
Rationale and Methods
Experiment 3 was an exploratory experiment aimed to evaluate how often this non-monotonic loudness effect occurred and whether or not it was specific to subjects, electrodes, and/or devices. We also wanted to evaluate the validity of our observation that subjects with lower thresholds for CAAC than for ACCA showed a monotonic loudness growth for ACCA. Six of the seven subjects (all except C7) who participated in experiments 1 and 2 took part. Another user of the Cochlear device was included (C8). Most subjects who participated in experiment 2 were tested on two additional electrodes (one apical and one basal). The apical electrode was always electrode 20. The basal electrode was in general electrode 3. For subjects for whom this basal electrode elicited uncomfortable sensations before reaching a comfortably loud percept, another electrode was selected. C1 was therefore tested on electrode 4, and C3 and C8 were tested on electrode 6. In addition, (i) C8 was tested on the middle electrode (electrode 11) because she was not a participant in experiment 2, (ii) C3 was only tested on the apical electrode because she found the basal electrode sounds to elicit uncomfortable sound sensations at high current levels, and (iii) C6 was tested on an additional fourth electrode (electrode 10). Finally, five subjects (A1-A5, cf Table 1) implanted with the Advanced Bionics HiRes90k CI, and a HiFocus 1j electrode array also took part. For them, only the middle electrode (electrode 9) was tested.
For each electrode measured, detection thresholds and loudness-balanced MCLs were first obtained for ACCA and CAAC using the methods described in experiment 1. The same loudness ranking task as in experiment 2 was then performed separately for these two pulse shapes. For the Advanced Bionics subjects, the stimuli were designed to be as similar as possible to those used with the Cochlear subjects. The only difference was that the phase duration was 43 μs, and the interphase gap and interpulse interval were 11 μs (instead of 8 μs). The stimuli were delivered in monopolar mode with reference to the case electrode of the implant. Here again, the APEX2 software was used and served as an interface with the BEDCS software library provided by Advanced Bionics. The methods were also identical except that the current steps of the threshold procedure were 16 and 2 μA before and after the second reversal, respectively, while the increment and decrement steps of the loudness balancing procedure were 4, 8, and 12 μA.
Results
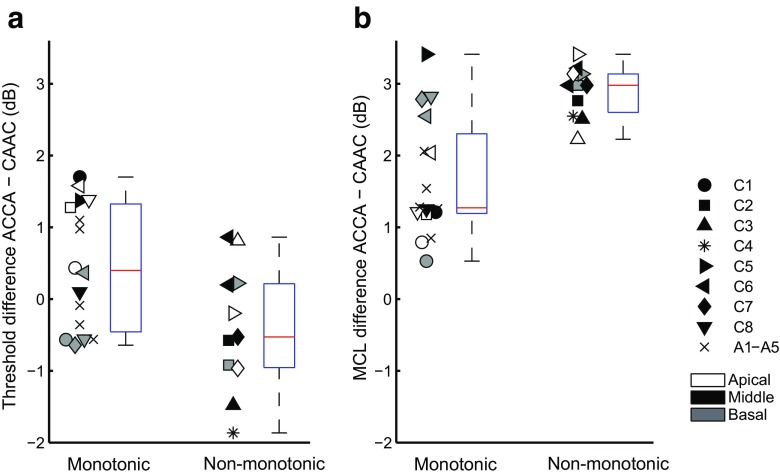
Each loudness function was considered as non-monotonic if the rank obtained for one level was significantly lower than the rank of one of the next two lower-level stimuli. To remain concise, we have summarized in Figure 8 all functions collected in experiments 2 and 3 as either monotonic or not. The figure combines the measures of 27 electrodes collected in 13 subjects. Note, the seven electrodes collected in experiment 2 are included in this set of data. For all electrodes and all subjects, the loudness growth function of CAAC was monotonic. In contrast, the loudness growth function of ACCA was non-monotonic in about 40 % of the electrodes tested. The x-axis of Figure 8a, b indicates the presence or absence of a non-monotonicity for ACCA. The symbols on the left indicate a monotonic loudness growth while the symbols on the right indicate a non-monotonic growth. White, black, and gray symbols represent apical, medial, and basal electrodes, respectively. The y-axis of Figure 8a shows the difference in threshold between ACCA and CAAC for each electrode tested. Similarly, the y-axis of Figure 8b shows the MCL difference between ACCA and CAAC.
FIG. 8.
A, Difference in threshold between ACCA and CAAC for the monotonic electrodes (left) and the non-monotonic electrodes (right). The two boxplots next to the data points represent the distribution of this threshold difference showing median, 25th and 75th percentiles and most extreme data points. B, Same as A for the difference in MCL between ACCA and CAAC
Several Informal Observations Can Be Made
First, the non-monotonic behavior does not seem to be subject-specific. It could occur on some electrodes of a given subject but not necessarily on all of them. For example, subject C6 showed a non-monotonic growth on electrodes 10 and 11 but not on electrode 3 or 20. Only two Cochlear subjects (C1 and C8) did not show any non-monotonicity on the three electrodes tested.
Second, non-monotonic shapes were observed in 6/14 cases in the middle of the array, 3/7 cases at the apex and 2/6 cases at the base. This shows that non-monotonic loudness growths can potentially occur at any location in the cochlea.
Third, this behavior was not observed in the five Advanced Bionics subjects, neither formally on electrode 9 nor informally when measuring loudness growth functions on other electrodes using the loudness chart (data not shown).
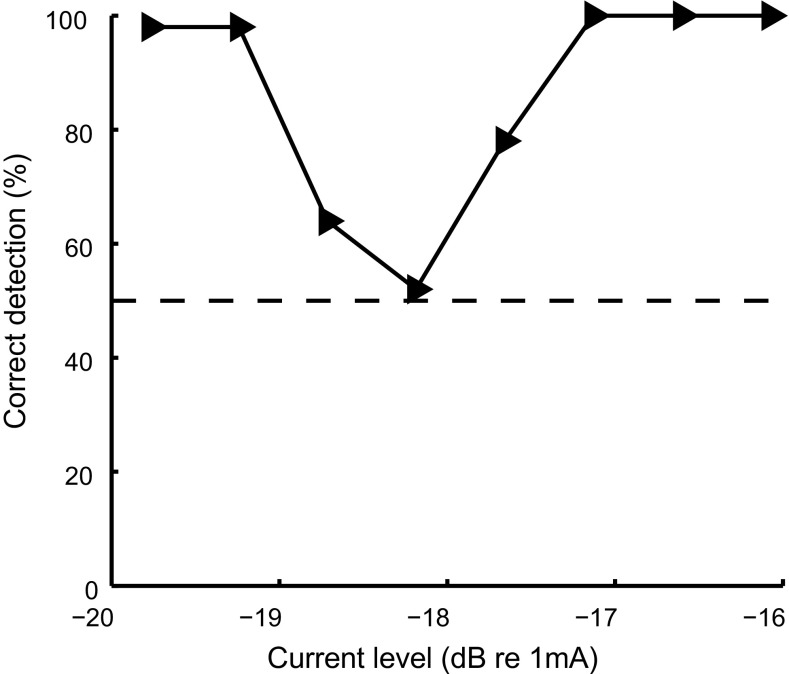
Because our loudness ranking procedure only sampled the upper 75 % of the dynamic range, all non-monotonicities were observed at suprathreshold levels. The only exception was for subject C5 tested on the apical electrode. When measuring thresholds and MCLs for this particular electrode, it appeared that the detection thresholds were bimodally distributed for ACCA. In other words, the stimulus became audible at a certain current level then became inaudible and audible again with further increases in level. The loudness growth of this electrode in the upper part of the dynamic range remained, however, monotonic. Figure 9 shows the proportion of signals detected as a function of current level in a two-alternative forced-choice detection task for this particular case. Each point is based on 50 repetitions. At −18.2 dB re 1 mA, the stimulus was undetectable (chance level is at 50 %) whereas the subject could clearly detect it at both higher and lower current levels. This observation makes it unlikely that the non-monotonic loudness functions reflect a change in sound quality rather than a change in loudness. It also reinforces the hypothesis that the loudness reversal reflects a decrease in the amount of neural activity.
FIG. 9.
Results of the additional detection threshold experiment performed in subject C5 for the ACCA stimulus. The function shows the proportion of trials where C2 could detect the stimulus as a function of current level. The proportions were calculated based on the results of 50 trials
Finally, it appears that the difference in threshold between ACCA and CAAC is smaller or more negative for electrodes showing a non-monotonic behavior than for others (Fig. 8a). Conversely, the difference in MCL between ACCA and CAAC is overall larger for the non-monotonic electrodes (Fig. 8b). The threshold data were fitted with linear mixed-effects models using the MLwiN software (Rasbah et al. 2009). Subjects were included as a random intercept factor. Adding the shape of the loudness growth function for ACCA by dummy coding as a fixed factor improved the model fit (χ2 = 6.3; df = 1; p < 0.05). The same analysis performed on the MCL data showed that including the loudness growth shape as a fixed factor also significantly improved the model fit compared to the random intercept model (χ2 = 12.6; df = 1; p < 0.05).
Discussion
To test whether the absence of non-monotonic electrodes in the Advanced Bionics group could be due to the small size of our subject group, we calculated the proportion of non-monotonic electrodes for each subject. The arcsine-transformed proportions obtained with the Cochlear and with the Advanced Bionics subject groups were compared in an unequal variance t test and were found to be significantly different (t (7) = 3.99, p = 0.005). This difference may have several possible explanations. First, although the stimulus parameters were very similar across devices, the Cochlear device shorts the electrodes between consecutive pulses whereas the Advanced Bionics device does not. It is, however, unclear at present why/how this could have a level-dependent effect on the loudness percept. Another possible explanation for the absence of a non-monotonic behavior in the Advanced Bionics subjects could be the electrode placement. The Cochlear subjects were implanted with the Contour Array which is meant to be closer to the modiolus than the Advanced Bionics HiFocus 1j array. Third, the geometry of the electrodes is different in both devices. The HiFocus 1j uses rectangular plate electrodes while the Contour array uses half-band electrodes which may differently target the peripheral and central part of the fibers. Finally, we cannot exclude that this device difference may be due to the fact that overall fewer electrodes were tested in the Advanced Bionics subject group.
General Discussion
In this section, we first consider possible device problems then introduce a conceptual model that provides a possible explanation of the data collected in the three experiments and finally discuss implications for CI coding.
Can the Non-monotonic Behavior Be Explained by a Device Failure?
Because such non-monotonic loudness growths have never been reported in the past, we first consider the possibility that the device failed to deliver a monotonically increasing current. Several observations make this possibility unlikely. First, all pulse shapes were carefully checked using a digital storage oscilloscope (LeCroy HRO 64Zi) measuring the output voltage of a CI24-RE test implant discharging through resistors matching the subjects’ specific impedances. We found that the current level continued to grow as expected, including at the levels at which the non-monotonicities were observed. It is also worth noting that among the two subjects who did not show this non-monotonic behavior in experiments 2 and 3 (C1 and C8), one of them had the same device and was stimulated at similar current levels as the other subjects who did show it. Finally, we also checked in subject C2 that the non-monotonic growth was still present when changing the test device from an L34 to an SP12 speech processor, which is another processor manufactured by Cochlear. Therefore, the non-monotonic behavior does not appear to be linked to a device failure. We do not have an explanation for why the level at which the reversal occurred changed during the testing session for C3, as reported in experiment 2. Note that this behavior was not observed for other subjects. For example, C2 repeated the exact same procedure several months after this experiment, and the loudness reversal still occurred at the same current level.
Conceptual Model
The observation that the shape of the loudness growth was related to the threshold difference between ACCA and CAAC suggests that these may share a common basis. Below, we propose that both of these observations reflect the degeneration or demyelination state of the fibers’ peripheral processes. Let us assume that ACCA and CAAC mimic the excitation produced by monophasic cathodic and anodic pulses, respectively. Following the modeling work of Rattay et al. (1999, 2001) mentioned in the “Discussion” section of experiment 1, the difference in threshold between ACCA and CAAC would reflect the proportion of fibers with remaining healthy peripheral processes at a given electrode location. Relatively, low thresholds for ACCA compared to CAAC would therefore reflect a high proportion of healthy fibers while relatively low thresholds for CAAC than for ACCA would reflect a high proportion of degenerated fibers.
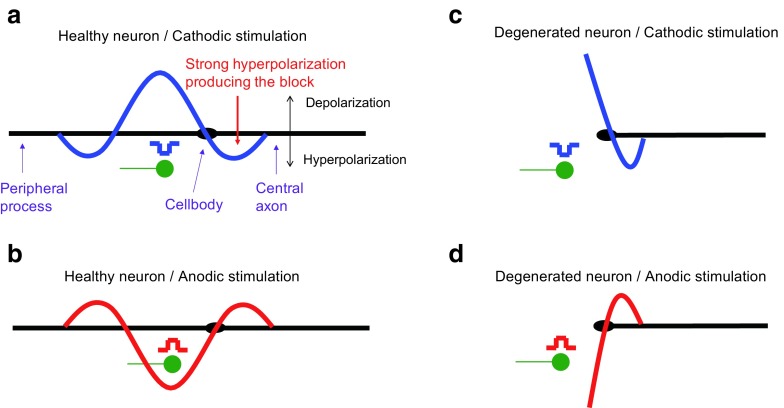
At low current levels for cathodic stimulation (ACCA), action potentials are assumed to be elicited at the periphery of healthy fibers where the depolarization is maximum (Fig. 10a). The action potentials need to cross both the soma barrier and travel down the central axon before exciting more central neurons. When the current level increases, the action potentials need to travel through central sites on the fiber that may be strongly hyperpolarized as indicated by the downward-pointing arrow in Figure 10a. At some current level, this hyperpolarization may be so strong that the action potential fails to go through. This is the phenomenon of cathodal block which has been observed experimentally in other neural stimulation studies (e.g., Ranck 1975). As previously mentioned, it has also been predicted by a computational model of the guinea pig cochlea (Frijns et al. 1996). The model predicted this blocking effect to only occur for cathodic and not for anodic monophasic pulses. Still, assuming that the ACCA and CAAC pulses approximate monophasic cathodic and anodic pulses, respectively, our data seem consistent with these predictions. If the number of fibers that are blocked at a certain current level exceeds the number of newly recruited fibers, we may expect the total amount of neural activity to decrease, thereby making the loudness percept decrease too. Even at a higher current level, the number of newly recruited fibers may exceed the number of additional fibers that are blocked, hence, making the loudness increase again. This could, for example, result from the recruitment of fibers that are distant from the stimulating electrode. In contrast, for anodic stimulation, the depolarization is expected to occur at a more central site on the fiber (Fig. 10b) and does not need to cross a strongly hyperpolarized region, hence, the monotonic increase in loudness as a function of current level.
FIG. 10.
Schematic illustration of hypothetical patterns of excitation produced by cathodic and anodic stimulation for healthy (A and B) and peripherally degenerated (C and D) nerve fibers
For fibers with a demyelinated or no peripheral process, Rattay et al. (1999, 2001) predicted that thresholds should be very high for cathodic stimulation because the depolarization would occur at the level of the cell body which is very difficult to excite due to the fact that it is unmyelinated in humans. This is schematically represented in Figure 10c although note that the exact patterns of polarization predicted by Rattay et al.’s models are more complex than those illustrated here. For anodic stimulation (Fig. 10d), however, the action potential is expected to be generated at the level of the central axon and therefore, once again, does not need to cross the soma barrier or a zone of strong hyperpolarization on the fibers to go through.
To summarize, this conceptual model may provide an explanation of the relation observed between polarity sensitivity at threshold and the (non-) monotonicity of the loudness growth function of ACCA. In a region with healthy neurons, we would expect lower thresholds for cathodic than for anodic pulses and more chances to observe a non-monotonic loudness growth due to the blocking. In a region with degenerated neurons, we would expect lower thresholds for anodic than for cathodic pulses and less chances to induce a blocking.
If cathodal blocking is the cause of these loudness reversals, it may well occur for individual fibers even if the shape of the loudness growth function is monotonic. By increasing the current level simultaneously, more fibers will be recruited and more fibers, albeit different ones, will be blocked. Assuming that the loudness is proportional to the total amount of neural activity, which of these two effects dominates will dictate the shape of the loudness growth function. Therefore, even if the loudness growth function is monotonic, blocking may still occur and alter sound coding at the individual nerve fiber level. In line with this hypothesis, it is worth noting that the polarity effect at MCL was larger than at threshold for 81 % (13 out of 16 cases) of the monotonic electrodes (cf Fig. 8). This implies that loudness grows less steeply as a function of the current level for ACCA than for CAAC for most monotonic and all non-monotonic electrodes. The blocking hypothesis therefore provides a basis explanation for the higher sensitivity to anodic stimulation observed at suprathreshold levels here and in previous publications. In other words, it is possible that the higher MCLs observed for ACCA compared to CAAC is a consequence of the blocking and that this MCL difference is larger when the blocking is strong, i.e., for the non-monotonic electrodes as suggested by the results of the linear mixed-effects modeling.
The observation that the non-monotonic behavior could be observed at threshold deserves some additional consideration. At the individual fiber level, cathodal block is meant to occur at relatively high levels. For example, Ranck (1975) mentioned that it should occur when the current level is more than 8 times larger than the fiber’s threshold. Considering the rather narrow dynamic range of CI users (<10 dB), additional modeling work would be needed to test if this blocking hypothesis is realistic. In addition, other alternative or complementary explanations for our results should not be excluded as polarity sensitivity results from a complex interplay between the orientation of the fibers relative to the electrode and the excitability of the different sites along each fiber (Rubinstein et al. 1993; Rattay et al. 2001).
Implications for CI Coding
There is a growing body of evidence in the literature showing that CI subjects perform differently on a variety of single-electrode psychophysical tasks depending on which electrode is being stimulated (e.g., Cosentino et al. 2016). Part of this interelectrode variability is often ascribed to differences in neural survival across the cochlea (cf Bierer 2010 for a review). However, there is currently no way to quantify neural survival using imaging methods. If the explanation given in the previous paragraph holds, polarity sensitivity at threshold may provide a measure of neural health proximal to each electrode.
While more data are needed to fully characterize these non-monotonic loudness effects, they may have implications for the coding of sounds in CIs. We would indeed expect them to distort the transmission of both temporal and spectral information. First, non-monotonic loudness growth should distort the transmission of amplitude modulations and could, in turn, negatively affect speech intelligibility. Second, Frijns et al. (1996) predicted that the first fibers which are blocked should be those closest to the electrode. This means that this blocking effect may also degrade spatial selectivity because a given electrode would mostly excite fibers at a remote location. This suggests that novel strategies that use asymmetric pulse shapes should employ anodic rather than cathodic pulses or, alternatively, find a way to recruit fibers in a more natural manner using cathodic stimulation. It is at present unsure whether any non-monotonic neural recruitment can occur with a symmetric biphasic pulse shape such as used in clinical processors. However, we know that the phase producing most of the excitation for symmetric biphasic pulses is the anodic phase, at least at high current levels (Macherey et al. 2008). Another, counter-intuitive, implication would arise if the non-monotonic growth is due to central blocking of action potentials produced by the cathodic phase at peripheral sites, and if this blocking effect occurs for the symmetric pulses used clinically. The conceptual model presented above suggests that healthy neurons should be more susceptible to this blocking effect. Although very poor neural survival is likely to degrade the spectral transmission of information, especially when it is non-uniform (as in the case of “dead regions”), very good neural survival could lead to non-monotonic neural recruitment. This could be one of the reasons why no consistent correlations have been found between the number of surviving neurons as measured post-mortem and performance on speech tasks in CI listeners (Nadol et al. 2001; Khan et al. 2005).
Acknowledgements
This project was supported by a grant from the Agence Nationale de la Recherche (Grant No. ANR-11-PDOC-0022) and a collaborative grant between Marseille and Cambridge funded by the CNRS (PICS). Author RPC is funded by the UK Medical Research Council programme MC-A060-5PQ70. We thank Gaston Hilkhuysen for his help on the linear mixed-effects modeling and for the helpful comments on a previous version of this manuscript.
References
- Bahmer A, Baumann U. Effects of electrical pulse polarity shape on intra cochlear neural responses in humans: triphasic pulses with cathodic second phase. Hear Res. 2013;306:123–130. doi: 10.1016/j.heares.2013.10.001. [DOI] [PubMed] [Google Scholar]
- Bierer JA. Probing the electrode-neuron interface with focused cochlear implant stimulation. Trends Amplif. 2010;14:84–95. doi: 10.1177/1084713810375249. [DOI] [PMC free article] [PubMed] [Google Scholar]
- Boulet J, White M, Bruce IC. Temporal considerations for stimulating spiral ganglion neurons with cochlear implants. J Assoc Res Otolaryngol. 2016;17:1–17. doi: 10.1007/s10162-015-0545-5. [DOI] [PMC free article] [PubMed] [Google Scholar]
- Carlyon RP, Deeks JM, Macherey O. Polarity effects on place pitch and loudness for three cochlear-implant designs and at different cochlear sites. J Acoust Soc Am. 2013;134:503–509. doi: 10.1121/1.4807900. [DOI] [PubMed] [Google Scholar]
- Cosentino S, Carlyon RP, Deeks JM, Parkinson W, Bierer JA. Rate discrimination, gap detection and ranking of temporal pitch in cochlear implant users. J Assoc Res Otolaryngol. 2016;17:371–382. doi: 10.1007/s10162-016-0569-5. [DOI] [PMC free article] [PubMed] [Google Scholar]
- de Balthasar C, Boëx C, Cosendai G, Valentini G, Sigrist A, Pelizzone M. Channel interactions with high-rate biphasic electrical stimulation in cochlear implant subjects. Hear Res. 2003;182:77–87. doi: 10.1016/S0378-5955(03)00174-6. [DOI] [PubMed] [Google Scholar]
- Eddington DK, Noel VA, Rabinowitz WM, Svirsky MA, Tierney J, Zissman MA (1994) Speech processors for auditory prostheses. Eighth quarterly progress report, NIH Contract N01-DC-2-2402.
- Favre E, Pelizzone M. Channel interactions in patients using the Ineraid multichannel cochlear implant. Hear Res. 1993;66:150–156. doi: 10.1016/0378-5955(93)90136-O. [DOI] [PubMed] [Google Scholar]
- Frijns JH, de Snoo SL, ten Kate JH. Spatial selectivity in a rotationally symmetric model of the electrically stimulated cochlea. Hear Res. 1996;95:33–48. doi: 10.1016/0378-5955(96)00004-4. [DOI] [PubMed] [Google Scholar]
- Hartmann R, Topp G, Klinke R. Discharge patterns of cat primary auditory fibers with electrical stimulation of the cochlea. Hear Res. 1984;13:47–62. doi: 10.1016/0378-5955(84)90094-7. [DOI] [PubMed] [Google Scholar]
- Karg SA, Lackner C, Hemmert W. Temporal interaction in electrical hearing elucidates auditory nerve dynamics in humans. Hear Res. 2013;299:10–18. doi: 10.1016/j.heares.2013.01.015. [DOI] [PubMed] [Google Scholar]
- Khan AM, Handzel O, Burgess BJ, Damian D, Eddington DK, Nadol JB., Jr Is word recognition correlated with the number of surviving spiral ganglion cells and electrode insertion depth in human subjects with cochlear implants? Laryngoscope. 2005;115:672–677. doi: 10.1097/01.mlg.0000161335.62139.80. [DOI] [PubMed] [Google Scholar]
- Laneau J, Boets B, Moonen M, van Wieringen A, Wouters J. A flexible research auditory platform using acoustic or electric stimuli for adults and young children. J Neurosci Methods. 2005;142:131–136. doi: 10.1016/j.jneumeth.2004.08.015. [DOI] [PubMed] [Google Scholar]
- Long CJ, Nimmo-Smith I, Baguley DM, O’Driscoll M, Ramsden R, Otto SR, Axon PR, Carlyon RP. Optimizing the clinical fit of auditory brain stem implants. Ear Hear. 2005;26:251–262. doi: 10.1097/00003446-200506000-00002. [DOI] [PubMed] [Google Scholar]
- Macherey O, van Wieringen A, Carlyon RP, Deeks JM, Wouters J. Asymmetric pulses in cochlear implants: effects of pulse shape, polarity and rate. J Assoc Res Otolaryngol. 2006;7:253–266. doi: 10.1007/s10162-006-0040-0. [DOI] [PMC free article] [PubMed] [Google Scholar]
- Macherey O, Carlyon RP, van Wieringen A, Wouters J. A dual-process integrator-resonator model of the electrically stimulated human auditory nerve. J Assoc Res Otolaryngol. 2007;8:84–104. doi: 10.1007/s10162-006-0066-3. [DOI] [PMC free article] [PubMed] [Google Scholar]
- Macherey O, Carlyon RP, van Wieringen A, Deeks JM, Wouters J. Higher sensitivity of human auditory nerve fibers to positive electrical currents. J Assoc Res Otolaryngol. 2008;9:241–251. doi: 10.1007/s10162-008-0112-4. [DOI] [PMC free article] [PubMed] [Google Scholar]
- Macherey O, Carlyon R. Re-examining the upper limit of temporal pitch. J Acoust Soc Am. 2014;136:3186–3199. doi: 10.1121/1.4900917. [DOI] [PMC free article] [PubMed] [Google Scholar]
- Macherey O, Cazals Y. Effects of pulse shape and polarity on sensitivity to cochlear implant stimulation: a chronic study in guinea pigs. Adv Exp Med Biol. 2016;894:133–142. doi: 10.1007/978-3-319-25474-6_15. [DOI] [PubMed] [Google Scholar]
- Middlebrooks JC. Effects of cochlear-implant pulse rate and inter-channel timing on channel interactions and thresholds. J Acoust Soc Am. 2004;116:452–468. doi: 10.1121/1.1760795. [DOI] [PubMed] [Google Scholar]
- Miller CA, Abbas PJ, Rubinstein JT, Robinson BK, Matsuoka AJ, Woodworth G. Electrically evoked compound action potentials of guinea pig and cat: responses to monopolar, monophasic stimulation. Hear Res. 1998;119:142–154. doi: 10.1016/S0378-5955(98)00046-X. [DOI] [PubMed] [Google Scholar]
- Moon AK, Zwolan TA, Pfingst BE. Effects of phase duration on detection of electrical stimulation of the human cochlea. Hear Res. 1993;67:166–178. doi: 10.1016/0378-5955(93)90244-U. [DOI] [PubMed] [Google Scholar]
- Morsnowski A, Charasse B, Collet L, Killian M, Müller-Deile J. Measuring the refractoriness of the electrically stimulated auditory nerve. Audiol Neurootol. 2006;11:389–402. doi: 10.1159/000095966. [DOI] [PubMed] [Google Scholar]
- Nadol JB, Jr, Shiao JY, Burgess BJ, Ketten DR, Eddington DK, Gantz BJ, Kos I, Montandon P, Coker NJ, Roland JT, Jr, Shallop JK. Histopathology of cochlear implants in humans. Ann Otol Rhinol Laryngol. 2001;110:883–891. doi: 10.1177/000348940111000914. [DOI] [PubMed] [Google Scholar]
- Nelson DA, Donaldson GS. Psychophysical recovery from single-pulse forward masking in electric hearing. J Acoust Soc Am. 2001;109:2921–2933. doi: 10.1121/1.1371762. [DOI] [PubMed] [Google Scholar]
- Ranck JB., Jr Which elements are excited in electrical stimulation of mammalian central nervous system: a review. Brain Res. 1975;98:417–440. doi: 10.1016/0006-8993(75)90364-9. [DOI] [PubMed] [Google Scholar]
- Rattay F. The basic mechanism for the electrical stimulation of the nervous system. Neuroscience. 1999;89:335–346. doi: 10.1016/S0306-4522(98)00330-3. [DOI] [PubMed] [Google Scholar]
- Rasbah J, Steele F, Browne W, Goldstein H (2009) A user’s guide to MLwiN, version 2.10. Centre for Multilevel Modelling, University of Bristol, Bristol, UK.
- Rattay F, Lutter P, Felix H. A model of the electrically excited human cochlear neuron. I. Contribution of neural substructures to the generation and propagation of spikes. Hear Res. 2001;153:43–63. doi: 10.1016/S0378-5955(00)00256-2. [DOI] [PubMed] [Google Scholar]
- Rubinstein JT. Axon termination conditions for electrical stimulation. IEEE Trans Biomed Eng. 1993;40:654–663. doi: 10.1109/10.237695. [DOI] [PubMed] [Google Scholar]
- Wilson BS, Finley CC, Lawson DT, Wolford RD, Eddington DK, Rabinowitz WM. Better speech recognition with cochlear implants. Nature. 1991;352:236–238. doi: 10.1038/352236a0. [DOI] [PubMed] [Google Scholar]


