

Summary
With aging, there is progressive loss of tissue homeostasis and functional reserve, leading to an impaired response to stress and an increased risk of morbidity and mortality. A key mediator of the cellular response to damage and stress is the transcription factor NF‐κB. We demonstrated previously that NF‐κB transcriptional activity is upregulated in tissues from both natural aged mice and in a mouse model of a human progeroid syndrome caused by defective repair of DNA damage (ERCC1‐deficient mice). We also demonstrated that genetic reduction in the level of the NF‐κB subunit p65(RelA) in the Ercc1 −/∆ progeroid mouse model of accelerated aging delayed the onset of age‐related pathology including muscle wasting, osteoporosis, and intervertebral disk degeneration. Here, we report that the largest fraction of NF‐κB ‐expressing cells in the bone marrow (BM) of aged (>2 year old) mice (C57BL/6‐NF‐κBEGFP reporter mice) are Gr‐1+CD11b+myeloid‐derived suppressor cells (MDSCs). There was a significant increase in the overall percentage of MDSC present in the BM of aged animals compared with young, a trend also observed in the spleen. However, the function of these cells appears not to be compromised in aged mice. A similar increase of MDSC was observed in BM of progeroid Ercc1 −/∆ and BubR1 H/H mice. The increase in MDSC in Ercc1 −/∆ mice was abrogated by heterozygosity in the p65/RelA subunit of NF‐κB. These results suggest that NF‐κB activation with aging, at least in part, drives an increase in the percentage of MDSCs, a cell type able to suppress immune cell responses.
Keywords: myeloid‐derived suppressor cell, NF‐κB, senescence
Introduction
Aging is characterized by a loss of tissue homeostasis and an impaired ability to respond to stress, which results in a dramatically increased risk of morbidity and mortality (Rattan, 2006; van Deursen, 2014). On a molecular level, DNA damage, mitochondrial dysfunction, telomere shortening, and the accumulation of macromolecular waste are all thought to contribute to driving aging. This cellular damage promotes aging by leading to dysfunction, apoptosis, or cellular senescence (Rattan, 2006; van Deursen, 2014).
A key mediator of the cellular response to damage and stress is the heterodimeric transcription factor NF‐κB (Gasparini & Feldmann, 2012). The NF‐κB cascade canonically organizes and executes pro‐inflammatory transcriptional programs. The NF‐κB family consists of five transcription factors p50, p52, p65, c‐REL, and RelB (regulated by IκB proteins). In unstimulated cells, NF‐κB is associated with IκB proteins and is sequestered in the cytoplasm. When stimulated, IκB is phosphorylated by IκB kinase, ubiquitinized, and degraded in the proteasome. NF‐κB is then released and translocated into the nucleus, where it can activate promoters. The IKK complex is composed of the catalytic subunits IKKα and IKKβ, and a regulatory subunit IKKγ (NEMO). IKKβ coordinates the classical arms of the two distinct NF‐kB activation pathways and mediates the major activity of IKK. In particular, genotoxic and oxidative stress triggers the activation of NF‐κB through the ATM (ataxia telangiectasia mutated kinase), which, in turn, can induce cellular senescence and inflammation (Tilstra et al., 2011; McCool & Miyamoto, 2012). Following activation by DNA damage, ATM associates with NEMO, a component of the IKK regulatory complex. The association of ATM with NEMO leads to the phosphorylation of NEMO, resulting in the shuttling of this complex from the nucleus to the cytoplasm where it binds and activates the IKK complex (IKKα and IKKβ). IKK phosphorylates IκB, resulting in its degradation and permitting nuclear translocation and thus activation of NF‐κB (Oeckinghaus et al., 2011; Ruland, 2011).
We demonstrated previously that NF‐κB transcriptional activity is upregulated stoichastically in a variety of tissues with both natural aging and in a mouse model of a human progeroid syndrome caused by defective repair of DNA damage, Ercc1 −/∆ hypomorphic mouse (Tilstra et al., 2012). In addition, genetic reduction in the level of the NF‐κB subunit p65/RelA in Ercc1 −/∆ mice, with a lifespan 6 months, delayed the onset of age‐related pathology including osteoporosis, neurodegeneration, BM hypoplasia, epidermal atrophy, sarcopenia, liver and kidney dysfunction. Similarly, inhibition of NF‐κB activation by chronic, systemic administration of a peptide inhibitor of the IKK complex, 8K‐NBD, altered gene expression networks, improved pathology, and delayed the onset of age‐related disease in the Ercc1 −/∆ mice.
Myeloid‐derived suppressor cells (MDSCs) represent a subset of myeloid cells that originate in the BM with not fully understood actions (Gabrilovich & Nagaraj, 2009; Ribechini et al., 2010; Talmadge & Gabrilovich, 2013). MDSC suppression on lymphocyte function can occur through cytokines such as IL‐10, through direct receptor–ligand interactions, and via short‐lived chemical mediators (Gabrilovich & Nagaraj, 2009; Talmadge & Gabrilovich, 2013). MDSCs also can suppress T‐cell function through a mechanism involving the production of reactive oxygen species (ROS) (Corzo et al., 2009; Lu et al., 2011). These mechanisms collectively increase the threshold of activation for lymphocytes, thereby preventing inappropriate responses to self‐proteins.
Several studies have suggested there is an increase in the frequency of MDSCs in both elderly patients and aged mice (Hurez et al., 2012; Jackaman et al., 2013; Verschoor et al., 2013). In naturally aged mice, the increase in the percent of MDSCs was observed in the spleen, lymph nodes, and BM (Enioutina et al., 2011; Hurez et al., 2012; Jackaman et al., 2013). However, most of the studies have been performed during cancer development where the percentage of MDSC is much higher than in ‘healthy age’ conditions.
The overall aim of this study was to understand in what cell types NF‐κB becomes activated with age and how this activation affects the aging process. Using mice transgenic for an EGFP reporter under the regulation of a NF‐κB ‐dependent promoter (NF‐κBEGFP), we observed an increase in the percent of EGFP‐positive cells in different tissues with natural aging (Tilstra et al., 2012; unpublished observations). Here we demonstrate that the EGFP+ cells found in the BM of naturally aged mice are positive for CD11b+ and Gr‐1+, markers used to identify MDSCs. We also observed a significant increase in the overall fraction of MDSCs, both EGFP+ and EGFP−, in the BM. A similar increase in Gr‐1+CD11b+ cells was observed in the BM of two different progeroid mouse models, Ercc1 −/∆ and BubR1H/H. Heterozygosity in the p65/RelA subunit of NF‐κB in the Ercc1 −/∆ mice prevented the increase in the Gr‐1+CD11b+. These results suggest that both natural and accelerated aging drives an expansion in MDSC, a cell type known to suppress both the adaptive and innate immune response, in part through a NF‐κB‐dependent mechanism.
Results
Expansion of NF‐κBEGFP+Gr‐1+CD11b+ cells in the BM of natural aged mice
To assess the impact of NF‐κB on the aging process, we utilized C57BL/6 mice transgenic for a synthetic NF‐κB‐dependent promoter driving an EGFP reporter (NF‐κBEGFP) (Magness et al., 2004). We detected an increase in the number of EGFP‐positive cells in old mice (≥ 2 years) in several tissues including the gastrointestinal tract, lungs, and pancreas (Tilstra et al., 2012; data not shown). In these mice, the percent of EGFP+ cells was particularly high in the BM (Fig. 1A, histogram 1). In the BM, the majority of NF‐kBEGFP+ cells were also CD11b positive (dot plot 2), which was greater in 2‐year‐old mice than in 1‐year‐old mice (Fig. 1A). T and B cells constituted the rest of the age‐dependent NF‐κBEGFP activity in the BM (dot plot 3). In contrast, there was a marginal increase in the percent of EGFP‐positive cells in the spleen of 2‐year‐old mice (Fig. 1B) with a distribution similar to the BM. Quantitative analysis showed that there was a significant increase in the percentage of EGFP+CD11b+ cells in both the SPL and BM (Fig. 1C).
Figure 1.
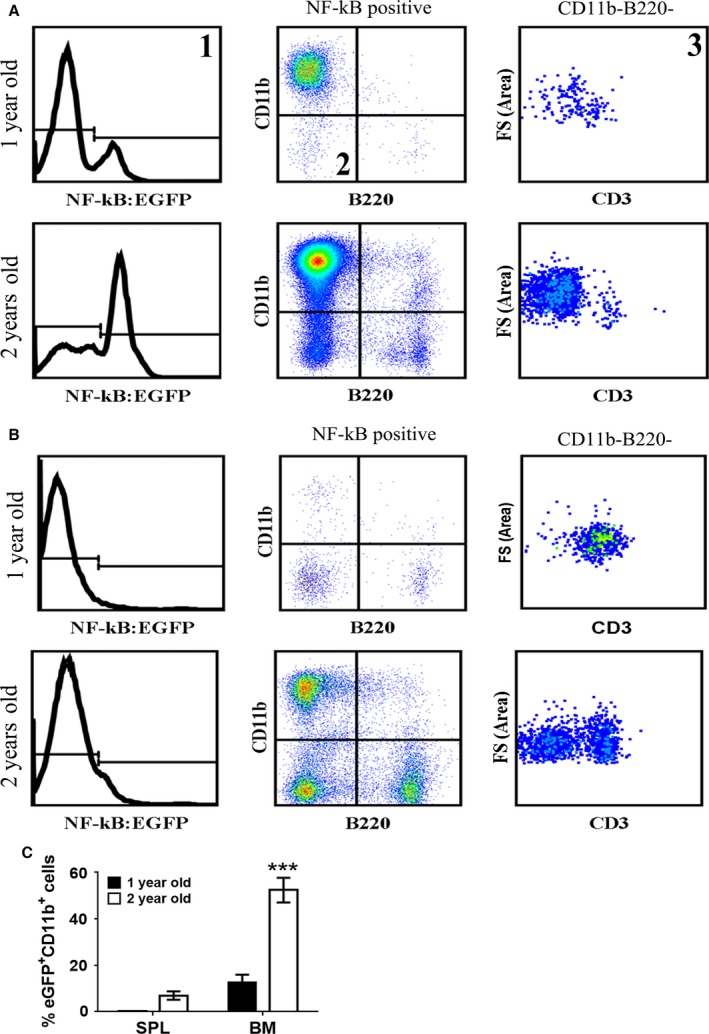
NF‐κB is highly activated in CD11b+ cells of BM with age. BM was extracted from the femur and tibia of the hind legs of mice. RBCs were depleted and the BM was washed extensively prior to flow cytometry. As shown in histogram (1), NF‐κBEGFP‐positive cells were selected. From the NF‐κBEGFP+ cells, CD11b+ cells were gated against B220+ cells (dot plot 2). The majority of the NF‐κBEGFP+ cells were CD11b+ in the BM (A) and in spleen (B). The remaining NF‐κBEGFP‐positive cells (i.e., CD11b B220 double negative cells) were CD3+ T cells in the BM (A) (dot plot 3) and particularly in the spleen (B). (C) The percentage of EGFP+CD11b+ cells in the BM and SPL of naturally aged mice is shown. The results shown represent three young mice and three old mice. The data were analyzed using nonparametric two‐way ANOVA (Mann–Whitney) ± SEM (***P < 0.001).
We focused our attention on identifying cells that expressed high levels of EGFP in addition to CD11b; thus, we probed the BM for the expression of innate immune cell markers Gr‐1, CD11c, and F4/80 (Fig. 2). A majority of the EGFP+ signal present in the BM of old mice was detected in Gr‐1+CD11b+ cells, which in young mice was expressed at substantially lower levels in this population of cells (Fig. 2A and B). Both Gr‐1 and CD11b are markers for MDSCs, which, as previously stated, represents a heterogeneous group of immune cells encompassing cells from myeloid progenitors to immature differentiated myeloid cells (Gabrilovich & Nagaraj, 2009; Ribechini et al., 2010; Talmadge & Gabrilovich, 2013). In the BM, a majority of the EGFP+ cells were Gr‐1+CD11b+ MDSC (Fig. S1). However, in the spleen, most of the EGFP+ cells were either MDSCs (Fig. S1) or CD11b single positive cells (data not shown). Further analysis revealed that the expression of EGFP by Gr‐1+CD11b+ in the BM of old mice was considerably higher in these cells than cells that were either single positive for CD11b (dotted histogram) or Gr‐1 (solid histogram) which in young mice turned out to be much less (Fig. 2A,B). A direct comparison between the two age groups revealed that EGFP was expressed at higher levels in MDSC from old mice than young mice (Fig. 2C). There was also a greater percentage of MDSCs present in the BM of old mice (Fig. 2D), including both EGFP‐positive and EGFP‐negative MDSCs, than in young mice. However, we observed no difference in the cellularity of the BM between old and young mice (Fig. 2E). Additionally, we detect no differences in the distribution of MDSC subsets in the BM of old or young mice (CD11b+Ly‐6GhiLy‐6Clo granulocytic MDSC and CD11b+Ly‐6C+Ly‐6Glo monocytic MDSC; Fig. S2). However, we did detect a significantly greater percentage of CD11b+F4/80+ macrophages (MΦ) present in the BM of old mice but not that of CD11b+CD11c+ dendritic cells (DC) (Fig. 2F). Analysis of MΦ and DCs from the BM of old mice exhibited higher levels of NF‐κBEGFP in these cells than in young mice (Fig. S3). Independent of the age of the mouse, NF‐kBEGFP+ MΦ and DC expressed higher levels of CD86 (Fig. S4).
Figure 2.
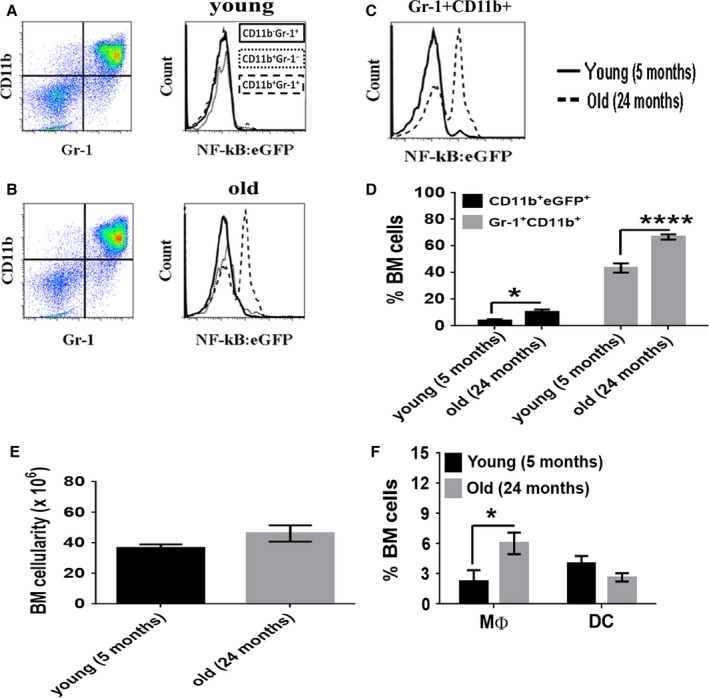
Expansion of NF‐κBEGFP myeloid suppressor cells in the BM of naturally aged mice. BM was extracted from the femur and tibia of the hind legs of mice. RBCs were depleted and the BM was washed extensively prior to flow cytometry. Dot plots of Gr‐1+CD11b+ cells from young (A) and old (B) mice are shown. The expression of EGFP in Gr‐1+CD11b+ cells (dash) compared with Gr‐1 (solid) and CD11b (dotted) single positive cells is shown in adjacent histograms. (C) The expression of EGFP by Gr‐1+CD11b+ cells from old and young mice is directly compared. (D) Quantitative analysis comparing the frequency of CD11b+EGFP+ and Gr‐1+CD11b+ between old and young mice. (E) The cellularity of the BM is shown. (F) The percent of MΦ (CD11b+F4/80+) and DC (CD11b+CD11c+) in the BM is shown. The results shown represent four young mice and eight aged mice. The data were analyzed using nonparametric two‐way ANOVA (Mann–Whitney) ± SEM (*P < 0.05, ****P < 0.0001).
In the SPL, there was a significant increase in the percentage of MDSC in old mice than in young mice (Fig. 3A,B). Similar to the BM, the level of NF‐κBEGFP expressed in splenic MDSC from old mice was greater than that seen in CD11b+ or Gr‐1+ cells. However, in young mice, the level of expression of NF‐κBEGFP in CD11b+ cells appears to be slightly greater than that of MDSC (Fig. 3A,B). A direct comparison between old and young NF‐κBEGFP reporter mice showed that a greater percentage of EGFP+ MDSCs from old mice than in young mice (Fig. 3C). The percentage of NF‐κBEGFP+ MDSCs was elevated in the SPL of old mice, as well as the overall frequency of MDSCs (Fig. 3D). The cellularity of the spleen was greater in old mice as compared to young (Fig. 3E) which differed from what was seen in the BM. There were no significant differences in the percentage of MΦ or DCs in the spleen (Fig. 3F) or the distribution of MDSC subsets between the age groups (data not shown). These results suggest that EGFP+ cells are present at a high frequency in the spleen of old mice.
Figure 3.
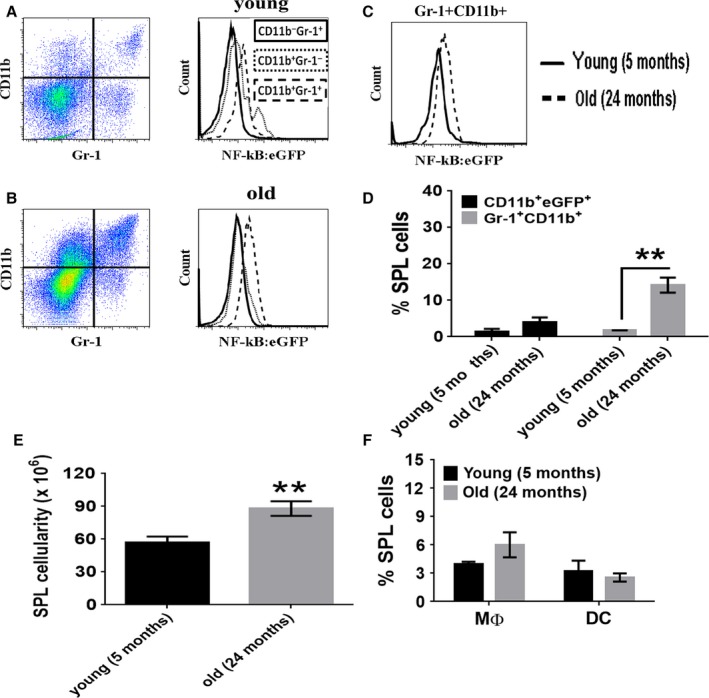
Significant expansion of NF‐κBEGFP myeloid suppressor cells in the spleens of naturally aged mice. Splenocytes were depleted of RBC and washed extensively prior to flow cytometry. Gr‐1+CD11b+ cells from young (A) and old (B) mice are shown in dot plots. The expression of EGFP in Gr‐1+CD11b+ cells (dash) was compared to Gr‐1 (solid) and CD11b (dotted) single positive cells and shown in adjacent histograms. (C) The expression of EGFP by Gr‐1+CD11b+ cells from old and young mice is directly compared. (D) Quantitative analysis comparing the frequency of CD11b+EGFP+ and Gr‐1+CD11b+ cells in splenic (SPL) tissue from old and young mice. (E) The cellularity of the SPL is shown. (F) The percent of MΦ (CD11b+F4/80+) and DC (CD11b+CD11c+) in the SPL is shown. The results shown represent four young mice and eight naturally aged mice. The data were analyzed using nonparametric two‐way ANOVA (Mann–Whitney) ± SEM (**P < 0.01).
Functional analysis of MDSCs
To determine whether the aging process had an impact on MDSC function, we stimulated whole SPL and BM cells with either phorbol 12‐myristate 13‐acetate (PMA) or lipopolysaccharides (LPS) for short time intervals. To screen the production of ROS, cells were incubated with an ROS‐sensitive dye DC‐FDA for 30 min after which the cells were counterstained with Gr‐1 and CD11b mAb and analyzed by flow cytometry. The production of ROS following PMA stimulation did not differ between old and young MDSCs from either the BM or the SPL (Fig. 4A). When BM and splenic cells were stimulated with LPS for 24 h, MDSCs from both old and young mice expressed similar levels of CD86 (Fig. 4B). Supernatants from LPS‐stimulated cells showed that the production of nitric oxide (NO) was also similar between old and young mice (Fig. 4C). We also did not detect differences in the secretion of IL‐12p40/p70 in the supernatants between old and young BM cells following LPS stimulation (Fig. 4D). Naive splenocytes from old mice were producing IL‐12p40/p70, likely indicating a low‐grade inflammatory response associated with aging (Bartlett et al., 2012; Tchkonia et al., 2013). However, following stimulation with LPS, the production of IL‐12p40/p70 was equalized between the splenocytes from the different aged mice. Taken together, these results suggest that although there are differences in the frequency of MDSC between old and young mice, their MDSCs appear to function similarly.
Figure 4.
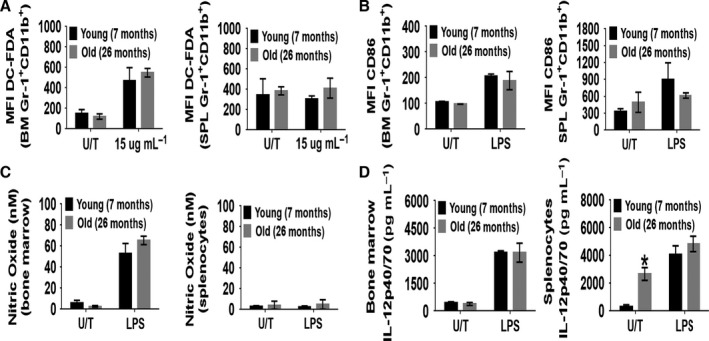
The activation of BM or splenic MDSCs from young and old mice is similar. To test for ROS production by MDSCs, 5 × 10⁵ BM and splenic cells were cultured with 2.5 μm DC‐FDA ± PMA (15 μg mL−1) for 30 min. Afterward, the cells were counterstained with anti‐Gr‐1 and anti‐CD11b mAb and analyzed by flow cytometry. (A) The mean fluorescent intensity (MFI) of DC‐FDA in MDSC is shown (U/T = untreated). To determine whether BM or splenic cells could achieve full activation, and their capacity to produce nitric oxide or cytokines, 5 × 10⁵ cells were stimulated with LPS (1 μg mL−1) for 24 h. (B) The activation status of MDSCs was assess by measuring the expression of CD86 and shown as the MFI. The supernatants were analyzed for nitric oxide (C) using a Griess reagent‐based kit and cytokine production by ELISA (D). The data shown are from three mice for (A) and (C) while for (B) and (D) the results represent five mice. The data were analyzed using nonparametric two‐way ANOVA (Mann–Whitney) ± SEM (*P < 0.05).
MDSCs are increased in the BM of Ercc1−/∆ mice and reduced in p65 heterozygous background
We hypothesized that if NF‐κB activation and MDSC expansion are age related, these processes should be accelerated in progeroid mice. The BM from Ercc1 −/∆ mice carrying the NF‐κBEGFP transgene was examined. The Ercc1 −/∆ mouse has reduced expression of the DNA endonuclease ERCC1‐XPF (Gregg et al., 2012; Tilstra et al., 2012), which results in accelerated aging in mice, like humans (Niedernhofer et al., 2006). Analogous to old NF‐κBEGFP reporter mice, there were more EGFP+CD11b+ (Fig. 5A) cells in the BM of 3‐month‐old Ercc1 −/∆ mice compared with control littermates; however, the differences were not statistically significant. No differences in this population of cells were observed in the SPL (Fig. 5A). The percentage of MDSCs was increased in the BM of Ercc1 −/∆ mice, like old WT mice. Heterozygosity in NF‐κB (p65/RelA), previously shown to improve pathology in Ercc1 −/∆ mice, resulted in a reduction in the percent of MDSCs back to control levels (Fig. 5B). However, haploinsufficiency of p65 had no effect on the percentages of MΦ, DC, T, and B cells in these mice (Fig. 5B) nor did it improve the cellularity of the BM in these mice (data not shown). In addition, there were no differences in the distribution of the major MDSC subsets in either the BM or SPL (Fig. S2). Collectively, the data suggest that NF‐κB plays a key role in driving the increased percentage of MDSC in progeroid Ercc1 −/∆ mice like naturally aged mice.
Figure 5.
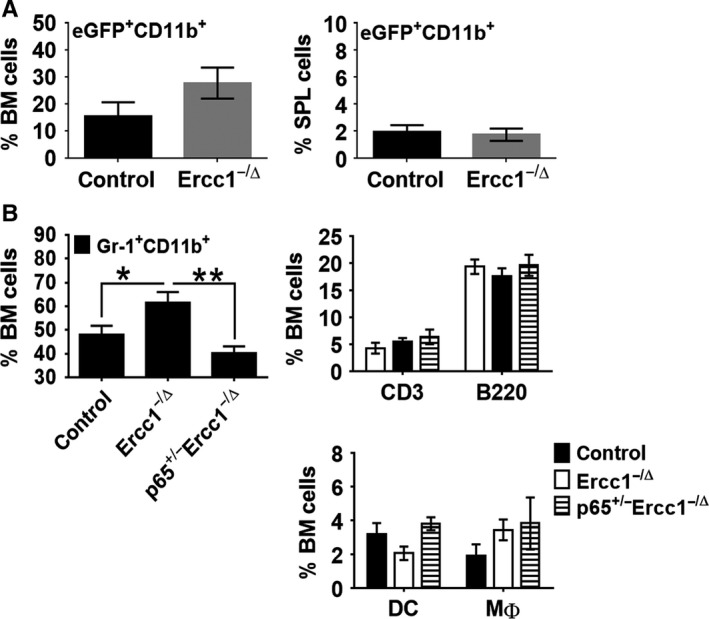
Expansion of myeloid suppressor cells in the BM of the Ercc1 −/∆ mouse model of a human progeroid syndrome. BM was extracted from the femur and tibia of the hind legs of mice. RBCs were depleted and the BM was washed extensively and prepared for FACS analysis. (A) The percent of NF‐κBEGFP+CD11b+ cells for both the BM and SPL from Ercc1 −/∆ NF‐κBEGFP reporter mice (n = 5) is shown compared with WT control mice (n = 5). (B) The frequency of MDSCs, T cells, and B cells is compared between WT (n = 9), Ercc1 −/∆ (n = 6), and p65+/− Ercc1 −/∆ (n = 7) mice. The data were analyzed using nonparametric two‐way ANOVA (Mann–Whitney) ± SEM (*P < 0.05, **P < 0.01).
To extend these observations, we analyzed the BM and SPL of a second model of accelerated aging, BubR1 hypomorphic (BubR1 H/H) mice. BubR1 is a component of the spindle assembly checkpoint that insures orderly progression through mitosis and accurate segregation of chromosomes by contributing to the attachment of the kinetochores to the spindle microtubules (Karess et al., 2013). BubR1 H/H hypomorphic mice have a short lifespan and exhibit increased senescence and accelerated age‐related decline in muscle, adipose tissue, and the eye (Baker et al., 2004, 2008). Similar to our observations from Ercc1 deficient animals, we observed a significant increase in MDSCs in the BM of BubR1 H/H mice (Fig. 6A) at both 12 and 20 weeks. In the SPL, there also was a difference in the percentage of both MΦ and DCs (Fig. 6B). However, in the BM, the percentage of both MΦ and DCs significantly decreased, which was different from what was observed in both naturally aged and Ercc1 −/∆ mice (Fig. 6C). Of note, the old WT, Ercc1 −/∆ and BubR1 H/H mice were in three different genetic backgrounds (C57Bl/6, C57Bl/6:FVB f1, and C57Bl/6 mixed), indicating that the age‐related changes in immune cell profile is not strain specific.
Figure 6.
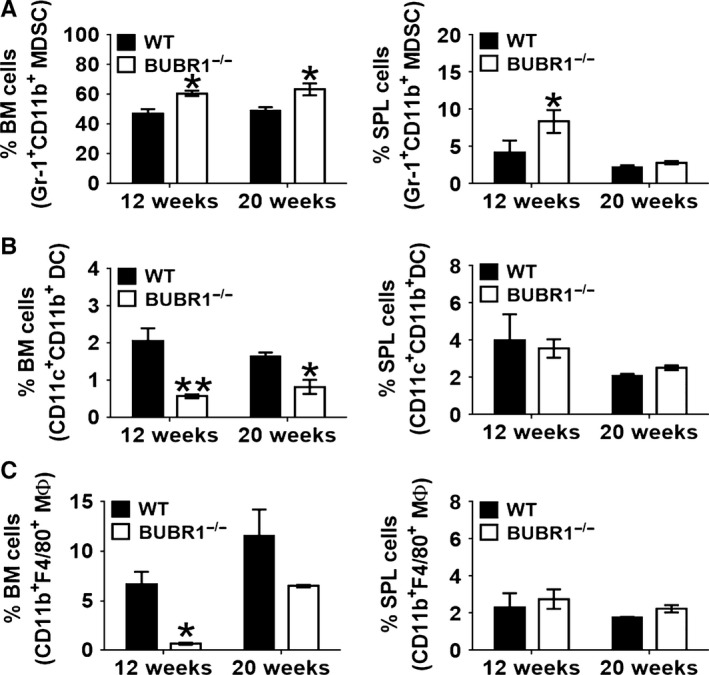
A significant increase in the percent MDSCs detected in the BM and SPL from progeroid Bubr1H/H hypomorphic mice. BM and splenic cells were depleted of RBCs and washed extensively prior to FACS. The percentage of MDSCs and its subsets in the BM (A) and SPL (B) from Bubr1H/H mice is shown in comparison with WT mice. The mice were analyzed at 12 (n = 3) and 20 (n = 3) weeks of age. The data were analyzed using nonparametric two‐way ANOVA (Mann–Whitney) ± SEM (*P < 0.05, **P < 0.01).
Discussion
To examine the regulation of NF‐κB with natural aging, we utilized a transgenic NF‐κBEGFP reporter mouse. An increase in the percent of cells positive for the NF‐κBEGFP reporter was observed in the pancreas, gastrointestinal tract, and liver with age (Tilstra et al., 2012; data not shown). This suggests that stochastic events that occur over time can lead to activation of NF‐κB. Here, we demonstrate that the greatest NF‐κBEGFP signal in the BM was from Gr‐1+CD11b+ MDSCs, with a fraction of EGFP+ MDSCs increasing with the age of mice. We also detected a smaller, but still significant increase in the NF‐κBEGFP signal in splenic MDSCs. There was also an overall increase in the percent of MDSCs, both EGFP positive and negative with aging in both tissues. Notably, when aging is accelerated, as in progeroid mouse strains, the accumulation of NF‐κBEGFP+ MDSCs is accelerated, illustrating that it is an age‐related event. Also of note, despite the increase in NF‐κB activity and the overall percent of MDSCs, the aged MDSCs appeared to function similarly to those from young mice. It is likely that activation of NF‐κB is mediated by cellular stress including oxidative or genotoxic stress or inflammation, which then drives expansion of the MDSCs. Indeed, genotoxic or oxidative stress is known to increase nuclear ATM activity, which phosphorylates the IKK kinase regulatory subunit NEMO to activate the NF‐κB pathway (McCool & Miyamoto, 2012; Salminen et al., 2012). It is also possible that inflammatory factors secreted by senescent cells accumulating with age can drive NF‐κB activation.
Interestingly, reduction in the level of NF‐κB/RelA prevents the expansion of MDSC in progeroid Ercc1 −/∆ mice. This suggests that activation of NF‐κB with age drives, at least in part, expansion of MDSCs. This also suggests that although not all the MDSCs are positive for EGFP, NF‐κB activity is increased in this cell population. How NF‐κB is activated in a subset of immune cells is unclear. Previous studies have shown that cytokines like TNF‐α that stimulate NF‐κB can drive the expansion of MDSC (Sade‐Feldman et al., 2013). TNF‐α also can block the differentiation of immature myeloid cells into MΦ/DCs, driving differentiation only to the MDSC stage, as well as contribute to the suppressive functional activity of MDSC. The Ercc1 −/∆ mice, like naturally aged mice, have an increase in TNF‐α (Chen et al., 2013). However, it is likely that NF‐κB also is activated by stochastic cell autonomous events such as cellular stress including genomic and oxidative stress with age.
MDSCs represent a group of myeloid cells that originate in the BM possessing a variety of suppressive actions already described (Gabrilovich & Nagaraj, 2009; Ribechini et al., 2010; Talmadge & Gabrilovich, 2013). MDSCs suppress lymphocytes through classical mechanisms involving cytokines like IL‐10. However, MDSC‐mediated suppression is most effective on a cell‐to‐cell level, either through direct receptor–ligand interaction or through small short‐lived chemical mediators (Gabrilovich & Nagaraj, 2009; Talmadge & Gabrilovich, 2013). MDSC production of small short‐lived chemical mediators is associated with the metabolism of L‐arginine (Rodriguez & Ochoa, 2008). MDSCs express the enzymes arginase I and iNOS that metabolize L‐arginine into either urea and L‐ornithine or nitric oxide, respectively. The expression of these enzymes can be influenced by the type of differentiated T cells they encounter. For instance, Th1 cells (IFNγ+) can drive MΦ to express iNOS (Hesse et al., 2001; Ribechini et al., 2010). However, we observed no difference in the ability of BM or splenic cells from old mice to produce NO following stimulation with LPS compared with young mice (Fig. 4C). Furthermore, when we assess the activation of MDSC (CD86 MFI), no differences were observed between old and young MDSC (Fig. 4C) or between WT and Ercc1 −/∆ mice (data not shown).
MDSCs can modulate the function of T cells through an oxidative stress mechanism involving the production of ROS. ROS, a by‐product of NADPH oxidase, is produced by MDSCs in response to certain cytokines like IFNγ, IL‐6, or TGF‐β (Gabrilovich & Nagaraj, 2009). ROS can suppress T‐cell secretion of cytokines and induce apoptosis (Malmberg et al., 2001). However, in this study, we observed no difference in the production of ROS by MDSCs from either the BM or SPL between old and young mice (Fig. 4A). This functional similarity between MDSCs derived from mice of different ages extends to their expression of IL‐10 (data not shown), and IL‐12 (Fig. 4D), where no significant differences were detected. The one exception was the increased production of IL‐12 by unstimulated splenocytes from old mice. This production of IL‐12 may reflect the ongoing low‐grade inflammatory response present in geriatric humans and aged mice, independent of infection, which is commonly referred to ‘inflammaging’ (Bartlett et al., 2012; Tchkonia et al., 2013).
MDSCs can also exhibit pro‐inflammatory activity. For example, MDSCs can exacerbate the immune response in mouse models of experimental autoimmune encephalomyelitis and collagen‐induced arthritis (Yi et al., 2012; Guo et al., 2014; Zhang et al., 2015). In these studies, MDSCs enhanced the generation of Th17 cells through a mechanism dependent on IL‐1β. In vitro, the production of IL‐17A is enhanced in the presence of MDSCs and decreased by an IL‐1 inhibitor (Yi et al., 2012; Zhang et al., 2015). Thus, the increase in MDSCs with aging may contribute to inflammaging.
The majority of our understanding of MDSC biology comes from the role these cells play in tumor pathobiology. MDSCs are detected in tumors from cancer patients and from tumor‐bearing mice. Furthermore, MDSCs are present in the blood of cancer patients, while in tumor‐bearing mice, the percentage of MDSC in the spleen can reach as high as 30% (Diaz‐Montero et al., 2009; Hurez et al., 2012; Jackaman et al., 2013; Verschoor et al., 2013). Disproportionate expansion of MDSCs can impede in the migration of T cells. Tumor‐derived factors can recruit and induce the differentiation of immature myeloid cells into MDSCs. Cytokines like granulocyte–macrophage‐derived soluble factor (GM‐CSF) and vascular endothelial growth cell factor (VEGF), which promote myelopoiesis toward MDSCs, are factors secreted by tumor cells (Ostrand‐Rosenberg & Sinha, 2009; Youn & Gabrilovich, 2010; Gabrilovich et al., 2012; Talmadge & Gabrilovich, 2013). Our data shows not only an expansion of MDSCs in the BM, but also a preferential expansion of MΦ over DC (Fig. 2F) with aging. This suggests that the differentiation of myeloid cells to DCs is actively suppressed. Tumor‐derived MDSCs also suppress T‐cell activity by facilitating the recruitment and induction of Tregs (Huang et al., 2006; Hurez et al., 2012). The induction of Tregs associated with the expansion of MDSC could be exacerbated and thus more prominent during tumor development (Rosin et al., 2011). However, both natural aged and progeroid Ercc1−/∆ mice show no differences in Tregs when compared to appropriate control mice (data not shown). Thus, the mechanisms that MDSCs use to mediate immune suppression apparently are intact in aged mice.
A reduction in the ability to combat infectious diseases and tumor immune surveillance are comorbidities associated with old age. Studies have shown an increase in the frequency of the MDSC population in both elderly patients and mice (Hurez et al., 2012; Jackaman et al., 2013; Verschoor et al., 2013). In one particular study, elderly patients were shown to have elevated levels of CD33+HLA‐DR−CD11b+CD15+ MDSCs circulating in their blood compared with healthy adults (Verschoor et al., 2013). In frail elderly patients and those with a history of cancer, the frequency of MDSCs is further elevated. In naturally aged mice, the frequency of MDSCs in the SPL, lymph nodes, and BM is elevated compared with young mice, similar to our current findings (Enioutina et al., 2011; Hurez et al., 2012; Jackaman et al., 2013). However, here we extend this analysis by demonstrating that the increase in the percentage of MDSCs with age is mediated by NF‐κB/RelA activation in not only naturally aged mice, but also two different progeriod mouse strains. Also, within the multiple cell populations in the bone marrow and spleen, NF‐κB/RelA is activated with age primarily in MDSCs.
Although it has been demonstrated that the percent of MDSC as well as MDSC with NF‐κB activation increases with accelerated and natural aging, the role of the MDSC, if any, in the aging process is unclear. It is also unclear whether the expansion of MDSCs drives aging or only is a consequence of aging. However, given that MDSCs accumulate in the spleen, peripheral lymph nodes, bone marrow, and blood of normal aged mice and are significantly increased in the circulation of aged individuals, it is likely that MDSCs contribute to age‐associated immune dysfunction. Similarly, the increase in MDSCs with aging could contribute to the increased risk of cancer.
Experimental procedures
Mice
Naturally aged C57BL/6 wild‐type (WT) mice were purchased for the National Institute of Aging and maintained under specific pathogen‐free conditions. The NF‐κBEGFP reporter mice (C57BL/6) were provided by Christian Jobin (UNC, Chapel Hill) and have been described previously (Magness et al., 2004). Additionally, Ercc1 −/∆ and Bubr1H/H mice were housed and maintained under specific pathogen‐free conditions and experimented with procedures approved by the Institutional Animal Care and Use Committee of the University of Pittsburgh and Scripps Florida (Baker et al., 2004, 2008; Niedernhofer et al., 2006). All mice used in this study were euthanized by carbon dioxide fixation.
Phenotypic analysis of BM and spleen by flow cytometry
The ends of bones were clipped and the BM flushed with a syringe prefilled with media using a 27‐gauge needle. The BM was converted into single cell suspension by mechanically disrupting the small aggregates of tissue by flushing it through an 18‐gauge needle. The BM was washed with sterile PBS and then red blood cells (RBC) were depleted using RBC lysis buffer (150 mm ammonia chloride, 1 mm sodium bicarbonate, and 0.1 mm EDTA at pH 7.7). The cells were extensively washed and passed through a cell strainer. Subsequently, the cells were resuspended in FACS buffer (2% FBS, 1× PBS, 2 mm EDTA, and 0.04% sodium azide) at a concentration of 3.75 × 10⁶ cells per ml. A 200‐μL aliquot of each sample was transferred into 96‐well polypropylene round‐bottom plates (BD Bioscience). Fc receptors were blocked using anti‐CD16/CD32 mAb at a 1:600 dilution for 20 min at 10°C. The cells were stained with fluorochrome‐conjugated mAb at the appropriate titer for 45 min at 10°C (anti‐CD11b, CD86, CD4, and Fc block were purchased from BD Pharmingen; anti‐CD19, B220, Ly‐6G, Ly‐6C, F4/80, Gr‐1, and CD11c mAb were purchased from eBioscience). The cells were washed with FACS buffer twice and then fixed in 2% paraformaldehyde. For each sample, 50 000 cells were passed through a BD LSR II flow cytometer (BD Bioscience) and analyzed using Flowjo (Tristar, Inc. Ashland, OR).
In vitro functional analysis of BM MDSC
BM cells from three naturally aged mice were pooled, the RBC depleted and cells washed thoroughly with sterile PBS. The BM cells were resuspended at 5 × 10⁵ cells per well and stimulate with LPS (1 μg mL−1) for 24 h. The culture supernatants were saved and analyzed for the presence of nitric oxide (NO) utilizing a NO kit from Cayman Chemical (Ann Arbor, MI USA). Additionally, the treated cells were phenotypically analyzed for the expression of activation markers by flow cytometry as described in the previous subsection. To assay for ROS production, 5 × 10⁵ cells were cultured with 2.5 μm oxidative sensitive dye DC‐FDA (Invitrogen) and PMA (30 μg mL−1) at 37°C for 30 min. The cells then were counterstained with anti‐Gr‐1 and anti‐CD11b mAb and analyzed by flow cytometry. As a comparison, splenocytes were tested in parallel with the BM cells.
Author's contributions
RRF designed and performed experiments and wrote the manuscript. CLC, JC, and, SJM performed experiments while BCL, DJB, LJN, and PDR helped to design experiments and edited this manuscript.
Funding
This work was supported by grants AG024827, AR051456, and AG043376 from the National Institutes of Health. R.R.F was supported by a T32 grant from NIH on Autoimmunity and Immunopathology.
Conflict of interest
The authors report no conflict of interest relevant to this article.
Supporting information
Fig. S1 A majority of bone marrow NF‐κBEGFP+ cells are Gr‐1+CD11b+ MDSC but not in the spleen of naturally aged mice.
Fig. S2 No difference in the percentage of MDSC subsets in the bone marrow of naturally aged or the Ercc1 −/∆ progeroid mouse model of aging.
Fig. S3 A greater level of NF‐κB activity detected in MΦ and DCs in the BM of old mice compared to young adult.
Fig. S4 The expression of CD86 is increased in EGFP+ MΦ and DCs in the BM of old mice.
Acknowledgments
The authors would like to thank Dewayne Faulkner (University of Pittsburgh) for his assistance with flow cytometry and Joan Nash (University of Pittsburgh) for her administrative support. The authors would also like to thank Drs. Jing Zhao, Matthew Yousefzadeh, and Robert Brooks for their critical review of this manuscript.
References
- Baker DJ, Jeganathan KB, Cameron JD, Thompson M, Juneja S, Kopecka A, Kumar R, Jenkins RB, de Groen PC, Roche P, van Deursen JM (2004) BubR1 insufficiency causes early onset of aging‐associated phenotypes and infertility in mice. Nat. Genet. 36, 744–749. [DOI] [PubMed] [Google Scholar]
- Baker DJ, Perez‐Terzic C, Jin F, Pitel KS, Niederlander NJ, Jeganathan K, Yamada S, Reyes S, Rowe L, Hiddinga HJ, Eberhardt NL, Terzic A, van Deursen JM (2008) Opposing roles for p16Ink4a and p19Arf in senescence and ageing caused by BubR1 insufficiency. Nat. Cell Biol. 10, 825–836. [DOI] [PMC free article] [PubMed] [Google Scholar]
- Bartlett DB, Firth CM, Phillips AC, Moss P, Baylis D, Syddall H, Sayer AA, Cooper C, Lord JM (2012) The age‐related increase in low‐grade systemic inflammation (Inflammaging) is not driven by cytomegalovirus infection. Aging Cell 11, 912–915. [DOI] [PubMed] [Google Scholar]
- Chen Q, Liu K, Robinson AR, Clauson CL, Blair HC, Robbins PD, Niedernhofer LJ, Ouyang H (2013) DNA damage drives accelerated bone aging via an NF‐kappaB‐dependent mechanism. J. Bone Miner. Res. 28, 1214–1228. [DOI] [PMC free article] [PubMed] [Google Scholar]
- Corzo CA, Cotter MJ, Cheng P, Cheng F, Kusmartsev S, Sotomayor E, Padhya T, McCaffrey TV, McCaffrey JC, Gabrilovich DI (2009) Mechanism regulating reactive oxygen species in tumor‐induced myeloid‐derived suppressor cells. J. Immunol. 182, 5693–5701. [DOI] [PMC free article] [PubMed] [Google Scholar]
- van Deursen JM (2014) The role of senescent cells in ageing. Nature 509, 439–446. [DOI] [PMC free article] [PubMed] [Google Scholar]
- Diaz‐Montero CM, Salem ML, Nishimura MI, Garrett‐Mayer E, Cole DJ, Montero AJ (2009) Increased circulating myeloid‐derived suppressor cells correlate with clinical cancer stage, metastatic tumor burden, and doxorubicin‐cyclophosphamide chemotherapy. Cancer Immunol. Immunother. 58, 49–59. [DOI] [PMC free article] [PubMed] [Google Scholar]
- Enioutina E, Bareyan D, Daynes RA (2011) A role for immature myeloid cells in immune senescence. J. Immunol. 186, 697–707. [DOI] [PubMed] [Google Scholar]
- Gabrilovich DI, Nagaraj S (2009) Myeloid‐derived suppressor cells as regulators of the immune system. Nat. Rev. Immunol. 9, 162–174. [DOI] [PMC free article] [PubMed] [Google Scholar]
- Gabrilovich DI, Ostrand‐Rosenberg S, Bronte V (2012) Coordinated regulation of myeloid cells by tumours. Nat. Rev. Immunol. 12, 253–268. [DOI] [PMC free article] [PubMed] [Google Scholar]
- Gasparini C, Feldmann M (2012) NF‐kappaB as a target for modulating inflammatory responses. Curr. Pharm. Des. 18, 5735–5745. [DOI] [PubMed] [Google Scholar]
- Gregg SQ, Gutierrez V, Robinson AR, Woodell T, Nakao A, Ross MA, Michalopoulos GK, Rigatti L, Rothermel CE, Kamileri I, Garinis GA, Stolz DB, Niedernhofer LJ (2012) A mouse model of accelerated liver aging caused by a defect in DNA repair. Hepatology 55, 609–621. [DOI] [PMC free article] [PubMed] [Google Scholar]
- Guo C, Hu F, Yi H, Feng Z, Li C, Shi L, Li Y, Liu H, Yu X, Wang H, Li J, Li Z, Wang XY (2014) Myeloid‐derived suppressor cells have a proinflammatory role in the pathogenesis of autoimmune arthritis. Ann. Rheum. Dis. 75, 278–285. [DOI] [PMC free article] [PubMed] [Google Scholar]
- Hesse M, Modolell M, La Flamme AC, Schito M, Fuentes JM, Cheever AW, Pearce EJ, Wynn TA (2001) Differential regulation of nitric oxide synthase‐2 and arginase‐1 by type 1/type 2 cytokines in vivo: granulomatous pathology is shaped by the pattern of L‐arginine metabolism. J. Immunol. 167, 6533–6544. [DOI] [PubMed] [Google Scholar]
- Huang B, Pan PY, Li Q, Sato AI, Levy DE, Bromberg J, Divino CM, Chen SH (2006) Gr‐1+CD115+ immature myeloid suppressor cells mediate the development of tumor‐induced T regulatory cells and T‐cell anergy in tumor‐bearing host. Cancer Res. 66, 1123–1131. [DOI] [PubMed] [Google Scholar]
- Hurez V, Daniel BJ, Sun L, Liu AJ, Ludwig SM, Kious MJ, Thibodeaux SR, Pandeswara S, Murthy K, Livi CB, Wall S, Brumlik MJ, Shin T, Zhang B, Curiel TJ (2012) Mitigating age‐related immune dysfunction heightens the efficacy of tumor immunotherapy in aged mice. Cancer Res. 72, 2089–2099. [DOI] [PMC free article] [PubMed] [Google Scholar]
- Jackaman C, Radley‐Crabb HG, Soffe Z, Shavlakadze T, Grounds MD, Nelson DJ (2013) Targeting macrophages rescues age‐related immune deficiencies in C57BL/6J geriatric mice. Aging Cell 12, 345–357. [DOI] [PubMed] [Google Scholar]
- Karess RE, Wassmann K, Rahmani Z (2013) New insights into the role of BubR1 in mitosis and beyond. Int. Rev. Cell Mol. Biol. 306, 223–273. [DOI] [PubMed] [Google Scholar]
- Lu T, Ramakrishnan R, Altiok S, Youn JI, Cheng P, Celis E, Pisarev V, Sherman S, Sporn MB, Gabrilovich D (2011) Tumor‐infiltrating myeloid cells induce tumor cell resistance to cytotoxic T cells in mice. J. Clin. Invest. 121, 4015–4029. [DOI] [PMC free article] [PubMed] [Google Scholar]
- Magness ST, Jijon H, Van Houten Fisher N, Sharpless NE, Brenner DA, Jobin C (2004) In vivo pattern of lipopolysaccharide and anti‐CD3‐induced NF‐kappa B activation using a novel gene‐targeted enhanced GFP reporter gene mouse. J. Immunol. 173, 1561–1570. [DOI] [PubMed] [Google Scholar]
- Malmberg KJ, Arulampalam V, Ichihara F, Petersson M, Seki K, Andersson T, Lenkei R, Masucci G, Pettersson S, Kiessling R (2001) Inhibition of activated/memory (CD45RO(+)) T cells by oxidative stress associated with block of NF‐kappaB activation. J. Immunol. 167, 2595–2601. [DOI] [PubMed] [Google Scholar]
- McCool K, Miyamoto S (2012) DNA damage‐dependent NF‐kappaB activation: NEMO turns nuclear signaling inside out. Immunol. Rev. 246, 311–326. [DOI] [PMC free article] [PubMed] [Google Scholar]
- Niedernhofer LJ, Garinis GA, Raams A, Lalai AS, Robinson AR, Appeldoorn E, Odijk H, Oostendorp R, Ahmad A, van Leeuwen W, Theil AF, Vermeulen W, van der Horst GT, Meinecke P, Kleijer WJ, Vijg J, Jaspers NG, Hoeijmakers JH (2006) A new progeroid syndrome reveals that genotoxic stress suppresses the somatotroph axis. Nature 444, 1038–1043. [DOI] [PubMed] [Google Scholar]
- Oeckinghaus A, Hayden MS, Ghosh S (2011) Crosstalk in NF‐kappaB signaling pathways. Nat. Immunol. 12, 695–708. [DOI] [PubMed] [Google Scholar]
- Ostrand‐Rosenberg S, Sinha P (2009) Myeloid‐derived suppressor cells: linking inflammation and cancer. J. Immunol. 182, 4499–4506. [DOI] [PMC free article] [PubMed] [Google Scholar]
- Rattan SI (2006) Theories of biological aging: genes, proteins, and free radicals. Free Radical Res. 40, 1230–1238. [DOI] [PubMed] [Google Scholar]
- Ribechini E, Greifenberg V, Sandwick S, Lutz MB (2010) Subsets, expansion and activation of myeloid‐derived suppressor cells. Med. Microbiol. Immunol. 199, 273–281. [DOI] [PubMed] [Google Scholar]
- Rodriguez PC, Ochoa AC (2008) Arginine regulation by myeloid derived suppressor cells and tolerance in cancer: mechanisms and therapeutic perspectives. Immunol. Rev. 222, 180–191. [DOI] [PMC free article] [PubMed] [Google Scholar]
- Rosin FC, Pedregosa JF, de Almeida JS, Bueno V (2011) Identification of myeloid‐derived suppressor cells and T regulatory cells in lung microenvironment after Urethane‐induced lung tumor. Int. Immunopharmacol. 11, 873–878. [DOI] [PubMed] [Google Scholar]
- Ruland J (2011) Return to homeostasis: downregulation of NF‐kappaB responses. Nat. Immunol. 12, 709–714. [DOI] [PubMed] [Google Scholar]
- Sade‐Feldman M, Kanterman J, Ish‐Shalom E, Elnekave M, Horwitz E, Baniyash M (2013) Tumor necrosis factor‐alpha blocks differentiation and enhances suppressive activity of immature myeloid cells during chronic inflammation. Immunity 38, 541–554. [DOI] [PubMed] [Google Scholar]
- Salminen A, Kauppinen A, Kaarniranta K (2012) Emerging role of NF‐kappaB signaling in the induction of senescence‐associated secretory phenotype (SASP). Cell. Signal. 24, 835–845. [DOI] [PubMed] [Google Scholar]
- Talmadge JE, Gabrilovich DI (2013) History of myeloid‐derived suppressor cells. Nat. Rev. Cancer 13, 739–752. [DOI] [PMC free article] [PubMed] [Google Scholar]
- Tchkonia T, Zhu Y, van Deursen J, Campisi J, Kirkland JL (2013) Cellular senescence and the senescent secretory phenotype: therapeutic opportunities. J. Clin. Invest. 123, 966–972. [DOI] [PMC free article] [PubMed] [Google Scholar]
- Tilstra J, Clauson C, Niedernhofer L, Robbins P (2011) NF‐kappaB in aging and disease. Aging Dis. 2, 449–465. [PMC free article] [PubMed] [Google Scholar]
- Tilstra J, Robinson A, Wang J, Gregg S, Clauson C, Reay D, Nasto L, St. Croix C, Usas A, Vo N, Huard J, Clemens P, Stolz D, Guttridge D, Watkins S, Garinis G, Wang Y, Niedernhofer L, Robbins P (2012) NF‐kappaB inhibition delays DNA damage‐induced senescence and aging in mice. J. Clin. Invest. 122, 2601–2612. [DOI] [PMC free article] [PubMed] [Google Scholar]
- Verschoor CP, Johnstone J, Millar J, Dorrington MG, Habibagahi M, Lelic A, Loeb M, Bramson JL, Bowdish DM (2013) Blood CD33(+)HLA‐DR(‐) myeloid‐derived suppressor cells are increased with age and a history of cancer. J. Leukoc. Biol. 93, 633–637. [DOI] [PMC free article] [PubMed] [Google Scholar]
- Yi H, Guo C, Yu X, Zuo D, Wang XY (2012) Mouse CD11b+Gr‐1+ myeloid cells can promote Th17 cell differentiation and experimental autoimmune encephalomyelitis. J. Immunol. 189, 4295–4304. [DOI] [PMC free article] [PubMed] [Google Scholar]
- Youn JI, Gabrilovich DI (2010) The biology of myeloid‐derived suppressor cells: the blessing and the curse of morphological and functional heterogeneity. Eur. J. Immunol. 40, 2969–2975. [DOI] [PMC free article] [PubMed] [Google Scholar]
- Zhang H, Wang S, Huang Y, Wang H, Zhao J, Gaskin F, Yang N, Fu SM (2015) Myeloid‐derived suppressor cells are proinflammatory and regulate collagen‐induced arthritis through manipulating Th17 cell differentiation. Clin. Immunol. 157, 175–186. [DOI] [PMC free article] [PubMed] [Google Scholar]
Associated Data
This section collects any data citations, data availability statements, or supplementary materials included in this article.
Supplementary Materials
Fig. S1 A majority of bone marrow NF‐κBEGFP+ cells are Gr‐1+CD11b+ MDSC but not in the spleen of naturally aged mice.
Fig. S2 No difference in the percentage of MDSC subsets in the bone marrow of naturally aged or the Ercc1 −/∆ progeroid mouse model of aging.
Fig. S3 A greater level of NF‐κB activity detected in MΦ and DCs in the BM of old mice compared to young adult.
Fig. S4 The expression of CD86 is increased in EGFP+ MΦ and DCs in the BM of old mice.