Abstract
No methods proposed thus far have the capability to measure molecular flow in live cells at the single molecule level. Here, we review the potentiality of a newly established method based on the spatial correlation of fluorescence fluctuations at a pair of points in the sample (pair correlation method). The pair correlation function (pCF) offers a unique tool to probe the directionality of intracellular traffic, by measuring the accessibility of the cellular landscape and its role in determining the diffusive routes adopted by molecules. The sensitivity of the pCF method toward detection of barriers means that different structural elements of the cell can be tested in terms of penetrability and mechanisms of regulation imparted on molecular flow. This has been recently demonstrated in a series of studies looking at molecular transport inside live cells. Here, we will review the theory behind detection of barriers to molecular flow, the rules to interpret pCF data, and relevant applications to intracellular transport.
Keywords: Molecular flow, Pair correlation function, Intracellular transport, Spatial correlation
Introduction
Molecular diffusion is a fundamental process in physical, chemical, biochemical, and biological systems. Great effort has been devoted to investigate this process in cells, by different methods and for a variety of relevant molecules (Phair and Misteli 2000; Politz et al. 2003; Seksek et al. 1997). How intracellular diffusion is regulated does have significant physiological implications; as it determines the efficiency at which biologically active and inert molecules reach their target sub-cellular destinations. Given that diffusion is driven by thermally activated fluctuations and is dependent on the local viscosity, it cannot be regulated spatially and temporally unless the “local viscosity” can be rapidly changed by the cell. For small molecules, diffusion is essentially a default mechanism of motion. It has been postulated that structural features of the cell must impart retention at particular sites and control flux of movement between compartments (Lanctot et al. 2007; Phair and Misteli 2000).
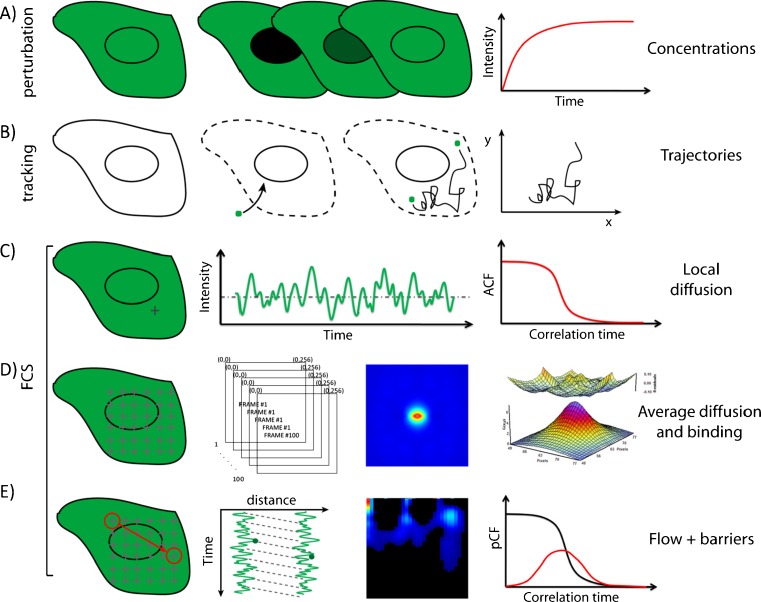
Current approaches to measure intracellular diffusion are based on fluorescence recovery after photobleaching (FRAP) (e.g., Calapez et al. 2002; Karpova et al. 2004; Seksek et al. 1997; Phair and Misteli 2000), single particle tracking (SPT) (e.g., Levi et al. 2005; Dange et al. 2008) and fluorescence correlation spectroscopy (FCS) (e.g., Kim et al. 2007; Politz et al. 1998; Dross et al. 2009) (Fig. 1). FRAP is a perturbation-based ensemble measurement that provides temporal information on the recovery of the concentration of molecules without knowledge of from where the fluorescence recovery originates (Fig. 1a). SPT, on the other hand, although high in spatial resolution, requires the observation of isolated and large particles for a long time which yields poor statistics (Fig. 1b). Moreover, the molecule of interest must be purified, properly labeled, and introduced into cells by complex experimental manipulations (e.g., microinjection, electroporation, permeabilization). FCS in contrast provides a single-molecule level of information in a selected intracellular location with good statistics by averaging the behavior of many molecules, and has thus emerged as the preferred method for studying the motions of intracellular molecules (Fig. 1c–e) in live, unperturbed cells. Traditionally, FCS is performed as a single point measurement (spFCS) (Fig. 1c) (Hinde et al. 2011). spFCS measures the average time a single fluorescent molecule employs to pass through a certain excitation volume (e.g., the point spread function, PSF, defined by the incident laser beam). If the volume of excitation is known, the local diffusion coefficient and concentration of molecules at the point of excitation can be derived. The limitation of this method of acquisition is that the spatial environment around the excitation volume and thus the route the molecules take prior to crossing the observation volume is not directly observed in the experiment. The idea of measuring correlation between separate points in the sample is not new. In the dual-foci FCS, for instance, two points are obtained by focusing two laser beams at a distance (fixed or variable). Using this approach, accurate measurements of diffusion coefficients can be achieved and the flow of molecules between the two points measured (Dertinger et al. 2008; Korlann et al. 2008). It has also been proposed that, by moving the illumination volume in a periodic pattern within the sample at a rate that is faster than the rate at which the molecules will move during a single scan period, the record of the intensity fluctuations along the path will contain spatial information about the location where the fluctuation occurred (Ries and Schwille 2006). This approach is called scanning-FCS and is equivalent of performing many single-point FCS measurements simultaneously. The key advantage being that a spatial component is now introduced into the measurement.
Fig. 1.
Comparison of the different methods available to probe intracellular diffusion. a FRAP is an ensemble measurement that provides temporal information on the recovery of the concentration of molecules without knowledge of where the fluorescence recovery originates from. b SPT requires purification, labeling and microinjection of the molecule of interest into cells; furthermore, a high statistic is needed to recover the molecular trajectories accurately. c The information obtained by the classical single-point FCS analysis is intrinsically local (one point at a time can be sampled in the cell). d RICS is a spatial temporal correlation method that takes into account how the cellular environment tested interacts with the molecules of interest, as well as what causes the net rate of molecular transport observed. Given the symmetry of the RICS correlation function, however, the direction of the flow or the behaviour of molecules at large distance cannot be determined. e The pair correlation method can measure the directionality of molecular flow by correlation the fluctuations at an arbitrary pair of points in the sample. By doing this, it is sensitive to the presence of barriers and/or obstacles to molecular diffusion
There are different ways to acquire a scanning-FCS measurement as well as different methods of analysis to extract the spatiotemporal information within a given experiment. For example, with raster scan image correlation spectroscopy (RICS), the sample is scanned in a raster pattern and the spatiotemporal information within the acquired frames extracted using spatial correlation functions (Rossow et al. 2011; Digman et al. 2005) (Fig. 1d). Thus, if a fluorescent molecule moves to a neighboring pixel, there will be a correlation in the intensity fluctuations at these two pixels with a certain time delay that is dependent upon the rate of diffusion and the size of the pixel. The unique feature of RICS is that, by adding a spatial component to the measurement via a raster scan, the process of diffusion and weak binding can, for example, be distinguished (Fig. 1d) (Digman and Gratton 2009a). Using RICS, we are able to probe more than just the temporal nature of diffusion and obtain a more accurate view of how the cellular environment tested interacts with the molecules of interest, as well as what causes the net rate of molecular transport observed. However, given the symmetry in the operation of calculating the RICS correlation-function, we cannot determine the direction of the flow or the behavior of molecules at large distance.
In this instance, we want to go one step further and determine where the observed molecular transport is going and how it is being directed by the presence of obstacles or scaffolds. Therefore, we need to extend the distance (>1 μm) over which we correlate the intensity fluctuations collected in a scanning-FCS experiment and use a different kind of correlation function which accounts for the direction of the motion. For this, we must apply a novel approach to spatiotemporal correlation analysis based on pair correlation functions (pCF) (Fig. 1e) (Digman and Gratton 2009b). The pCF method can show the diffusive (or directed) route taken by molecules along a scanning-FCS measurement by temporal cross correlation of every possible pair of points at a given distance in the pattern (Digman and Gratton 2009b). By detection of the same molecule at two different locations, we measure the average time a molecule takes to move between these two locations. If there is a delay from the expected average time to diffuse the distance between the two points, we can make inferences about the existence of barriers to diffusion between those two points (Digman and Gratton 2009b). This information cannot be obtained with FRAP or any other spatiotemporal correlation spectroscopy method. Instead, our method bridges two technologies (FCS and SPT) by providing single-molecule sensitivity in the presence of many molecules.
The pCF method thus offers a unique opportunity to probe the directionality of intracellular traffic, by measuring the accessibility of the cellular landscape and its role in determining the diffusive routes adopted by molecules. The sensitivity of the pCF method toward detection of barriers means that different structural elements of the cell can be tested in terms of penetrability and mechanisms of regulation imparted on molecular flow. This has been recently demonstrated in a series of studies of our group, looking at several different molecular transport mechanism on biological membranes, inside live cells or entire organisms (Cardarelli and Gratton 2010; Digman and Gratton 2009b; Hinde et al. 2010; Hinde et al. 2011). At this stage, we will review the theory behind the pair correlation approach, the experimental requirements to properly detect barriers to molecular flow, and the rules to interpret pCF data. Thus, we envision an exemplary experiment by which we are able to detect several possible barriers to molecular flow outside, inside and between cells. This will guide the reader through the presentation of the most relevant applications of the pair correlation approach so far realised.
The pair correlation function method: theory and data interpretation
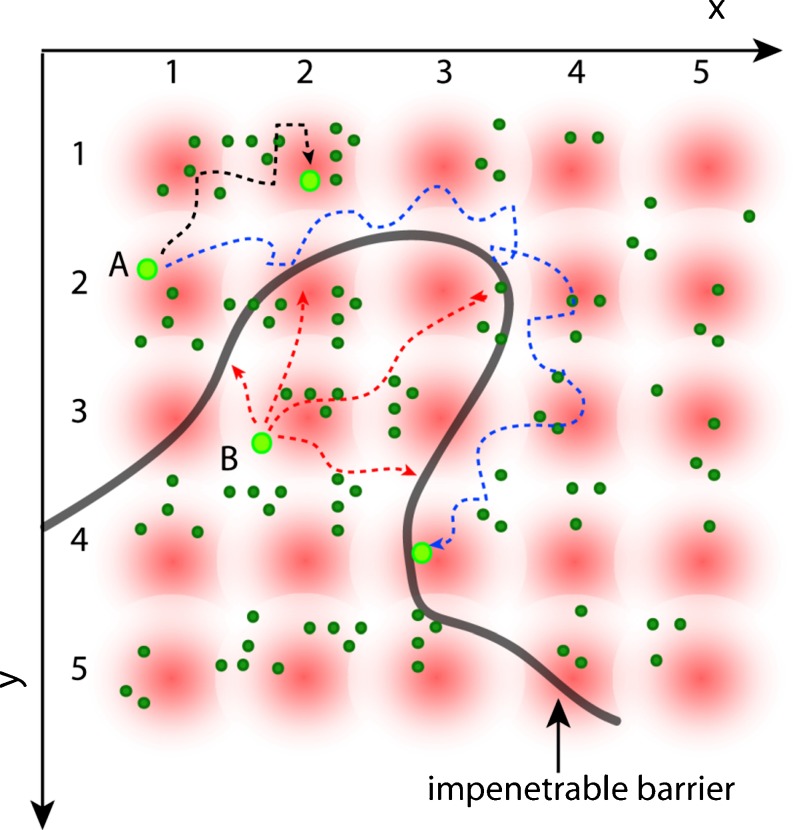
The basic idea of the pCF method is to statistically follow the same fluorescent molecule diffusing in the cell. The fluorescence intensity is rapidly sampled (compared to the motion of the molecules) at several points in a grid (see Fig. 2), and as molecules diffuse they appear at different points in the grid. Only the same molecule will produce a positive cross-correlation with a given time delay at two points in the grid. For example, a fluctuation in intensity at position 1 will statistically correlate with a fluctuation of the intensity at position 2 at a later time if the same molecule is moving (with some delay) from 1 to 2 (molecule ‘A’, dark trajectory; Fig. 2). If we place an obstacle to diffusion within the sampled grid, we could observe the same particle on the other side of the obstacle but with a delayed correlation (molecule ‘A’, blue trajectory; Fig. 2). Finally, if the obstacle is able to prevent molecular diffusion between two environments, we will see a discontinuity in the amount of correlation between points across the barrier (molecule ‘B’, red trajectories; Fig. 2). In the example of Fig. 2, we use two-dimensional (2D) diffusion, but the principle of the method is valid for diffusion in 3D. The diffusion propagator is given by:
| 1 |
where C(r,t) can be interpreted as being proportional to the probability of finding a particle at position r and time t if the particle was at position 0 at t = 0. The fluorescence intensity at any given time and position δr from the origin is given by:
| 2 |
where it is assumed that the fluorescence is proportional to the concentration, quantum yield Q, excitation-emission laser power, filter combination, and the position of the particle in the profile of illumination described by W(r). The pCF for two points at a distance δr as a function of the delay time τ is calculated using the following expression:
| 3 |
Fig. 2.
Schematic of the spatial pair-correlation method. The fluorescence intensity is rapidly sampled (compared with the motion of the particles) at several points in a grid (x, y) and repeatedly in time. An impenetrable barrier (black line) is placed in the grid defining two disconnected regions. Molecules are allowed to diffuse freely within both regions but not across the boundary. Only the same particle will produce an average cross-correlation with a given time delay at two different points in the grid. For example, the fluctuations of intensity at position (1,2) from molecule ‘A’ will correlate with the fluctuations at position (2,1) if the molecule ‘A’ is moving to that position. Analogously, the same molecule can be detected at position (3,4) in the grid, but after a certain delay due to the time needed to pass around the obstacle. Instead, if we consider the paths allowed for molecule ‘B’ to diffuse from position (2,3) we find that fluctuation of intensity will never correlate with points on the other side of the barrier. Thus, if we cross-correlate the intensity fluctuations at each point of the grid, we produce a map of molecular flow with a resolution given by the size of the PSF
We use the maximum of the derived pCF profile to determine the average time a molecule takes to travel the given distance (δr) and, because the measurement is exquisitely local to a pair of points, if there is a delay from the expected average time to diffuse the distance between the two points (expected on the basis of the mean square displacement law of diffusion), then we can make inferences about the existence of an obstacle or barrier to diffusion within the sample. By repeating the calculation at several pairs of adjacent locations, we can trace the contour of the barrier, if it exists.
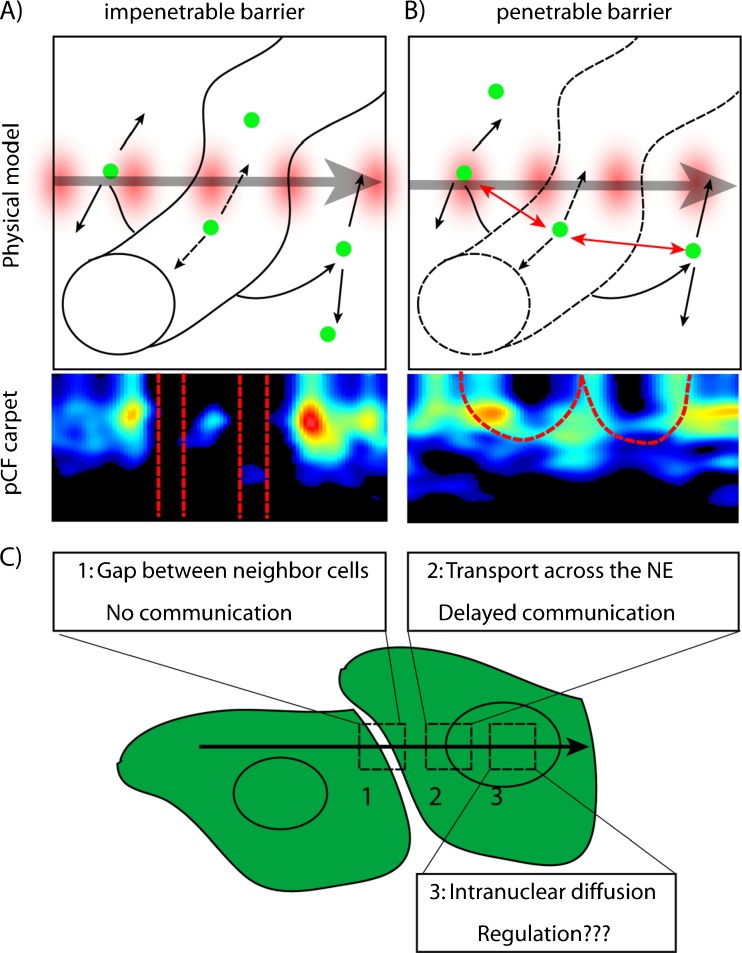
In our approach, we use only one laser beam that is moved rapidly at different locations in a repeated pattern, for example in a line. The pCF profile calculated for each pixel along the line measured is displayed in a carpet representation: the x-coordinate corresponds to the point along the line where the pair correlation function is calculated and the y-coordinate corresponds to the pair correlation time in a log-scale. Upon encountering a zone that behaves as a barrier, molecular diffusion will either be directed around or through this zone, depending on the degree of penetrability. These two different diffusive routes give rise to a distinct pattern of pair correlation in the pCF carpet representation.
In Fig. 3, we show through simulation how a penetrable barrier versus impenetrable barrier would appear in the pCF carpet representation. A line is scanned across two volumes which are separated by a barrier to molecular diffusion. As can be seen in Fig. 3a, if the barrier is impenetrable (molecules are diffusing within each of the two disconnected volumes but not across them) an absence of molecular flow is observed for diffusion in and out of the barrier, which causes characteristic gaps in the pCF carpet. In contrast, if the barrier is penetrable (molecules are allowed to diffuse across the barrier), there is a continuity of molecular flow, although with a delay, which causes characteristic arc shapes to appear in the pCF carpet (Fig. 3B). These two cases set important rules for the interpretation of pCF carpets by simple visual inspection, allowing the identification of impenetrable barriers or just obstacles to molecular flow.
Fig. 3.
Rules to interpret molecular flow in the pCF carpet. We simulate diffusion of a particle in a plane in the presence of a region with a barrier to enter and exit that can be impenetrable or penetrable. a The pCF carpet derived for the impenetrable barrier displays characteristic gap regions (absence of communication). b When communication is allowed between the two regions, the pCF carpet displays characteristic arc shapes due to delayed but positive communication. c We envision an experiment in which a line is scanned across different types of barriers: 1 the impenetrable gap between two non-communicating cells; 2 the nuclear envelope; 3 the nucleoplasm of the cell, where molecular diffusion will be evaluated with no ‘a priori’ knowledge. Panels (a) and (b) are partly taken from Hinde et al. (2011)
Molecular flow across obvious barriers: the border of non-communicating cells and the nuclear envelope
The border between two neighbor cells is an obvious barrier to diffusion, with no molecular transfer expected from one cell to the other, unless they are connected by specific channels (e.g. gap junctions) or cellular sub-structures (e.g. synapses). In our case, two adjacent CHO-K1 cells are expressing the fluorescent protein GFP throughout the cell (Fig., 4a). This exogenous fluorescent marker has no significant interactions with the intracellular environment; thus, it is not expected to exchange between cells. If a line is scanned across the border of the two cells and the pCF is calculated, a gap in correlation is observed in the carpet at the position of the gap, indicating the absence of molecular flow at that position along the scan line. The position of the gap locates the barrier while its width is related to the specific distance chosen for the analysis (i.e. larger the distance, wider the gap). This result matches with what obtained by simulating the case of disconnected molecular flow (Fig. 3a).
Fig. 4.
Application of pair correlation to expected barriers in cells. a A line is scanned across the border of two neighbor cells. b, c Intensity and pCF(7) carpets. The pCF(7) analysis highlights the presence of the impenetrable gap. The corresponding plot (right) does not yield a maximum of correlation in the gap (even at very long times). Scale bar 5 μm. d Here a line is scanned across the NE. e, f Intensity and pCF(11) carpets. The pCF(11) analysis highlights the presence of delayed communication across the NE. From the average pCF(11), two columns are extracted, 14 and 18, corresponding to regions of different cytoplasm-to-nucleus transport kinetics (i.e. passive diffusion and active import, see text). Scale bar of the image 5 μm. Figure partly taken from Cardarelli and Gratton (2010)
A second interesting case is the molecular transport across the nuclear envelope (NE). The NE is a crucial barrier across which both proteins and RNA have to be transported in a regulated manner (Gorlich and Kutay 1999; Macara 2001; Weis 2003). The sole mediators of this exchange are nuclear pore complexes (NPCs), which span pores in the NE to connect the nuclear and cytoplasmic compartments. NPCs are constructed from multiple copies of ∼30 different proteins collectively called nucleoporins (Cronshaw et al. 2002). Transport across the NPC has been reviewed in detail (Fahrenkrog and Aebi 2003) and can be divided into two modes. Small molecules, such as ions, metabolites, and intermediate-sized macromolecules, can pass unassisted by diffusion which becomes increasingly restricted as the particle approaches a size limit of ∼10 nm in diameter (Paine 1975). Above this threshold, molecules are ushered selectively by dedicated transport receptors, which recognize specific nuclear localization (NLS) or nuclear export signal (NES) peptides displayed by the cargo (Pemberton and Paschal 2005). Molecular transport across the NE has been quantitatively addressed by the classical SPT approach, with the calculation of passive/active translocation times and trajectories at the single-molecule and single-pore level in permeabilized or microinjected cells (Yang et al. 2004; Kubitscheck et al. 2005; Dange et al. 2008; Herrmann et al. 2009; Ma and Yang 2010). Here, we will show how similar results can be obtained using GFP, in unperturbed cells, and in the presence of many molecules. To this end, we use a GFP linked to a functional NLS and transfected into living CHO-K1 cells: the recombinant NLS-GFP protein can bind to molecular carriers mediating cytoplasm-to-nucleus active import as well as shuttle across the NPC by passive diffusion (its molecular weight is below the cut-off size limit of the NPC) (Cardarelli et al. 2007, 2008, 2009). The nuclear envelope barrier to NLS flow can be evaluated by sampling a line perpendicular to the NE and encompassing both the nuclear and the cytoplasmic compartments (Fig. 4b).
In our measurements, the laser beam scans in one direction (left-to-right) but we can choose the orientation of the pCF analysis and thus automatically select the process of interest across the NE. Here, we selectively analyze cytoplasm-to-nucleus transport (active import + passive diffusion). The pCF(11)-carpet shows the NLS-GFP transit times being spatially distributed according to the distance from the NE barrier. In particular, the pCF analysis yields the fastest transit times (and the largest number of transit events as well) near the NE barrier. This result is not surprising, as it correlates with the intracellular localization of Impα and Impβ carriers, which are both locally accumulated on the NE (Cardarelli et al. 2011, 2009; Ciciarello et al. 2004). Thus, close to the NE, we maximize the probability of detecting active transport events (fast); in contrast, distant from the NE, we average together all the possible events leading to successful transport (e.g., NLS-receptor binding, docking to the NPC, passive or active translocation). This obviously leads to a broadening of the transit times observed from the cytoplasm to the nucleus. We unequivocally linked the fast component to carrier-mediated active import by showing two internal controls: (1) the fast cytoplasm-to-nucleus component (1–30 ms) disappears in energy depleted cells, replaced by the characteristic transit delays of passively diffusing molecules (Cardarelli and Gratton 2010); and (2) the classical import carrier Impβ shows cytoplasm-to-nucleus transit times (in the 1–30 ms range; Cardarelli and Gratton 2010) in perfect agreement with the values reported for the NLS-GFP cargo.
Molecular flow within the nucleus
So far, we have used the pCF approach to measure molecular flow across obvious barriers inside or among cells (the nuclear envelope and the gap between neighbor cells, respectively). What if the location of the barrier to diffusion is not known? Can the pCF unveil the presence of ‘invisible’ barriers? As a clear example of this property, we shall show the applicability of the pCF method to measure the intranuclear diffusion of an inert molecule, GFP, with respect to the position and density of chromatin. Given the absence of membranes separating intranuclear substructures, it has been postulated that other structural features of the nucleus (e.g., the chromatin itself) must impart divisions which control molecular flows and segregate different activities. A key emerging contributor to genome function is the architectural organisation of the cell nucleus and, given that chromatin fills up to 12% of the cell nucleus, it must be considered a major obstacle to molecular diffusion (Wachsmuth et al. 2000; Tini et al. 2002).
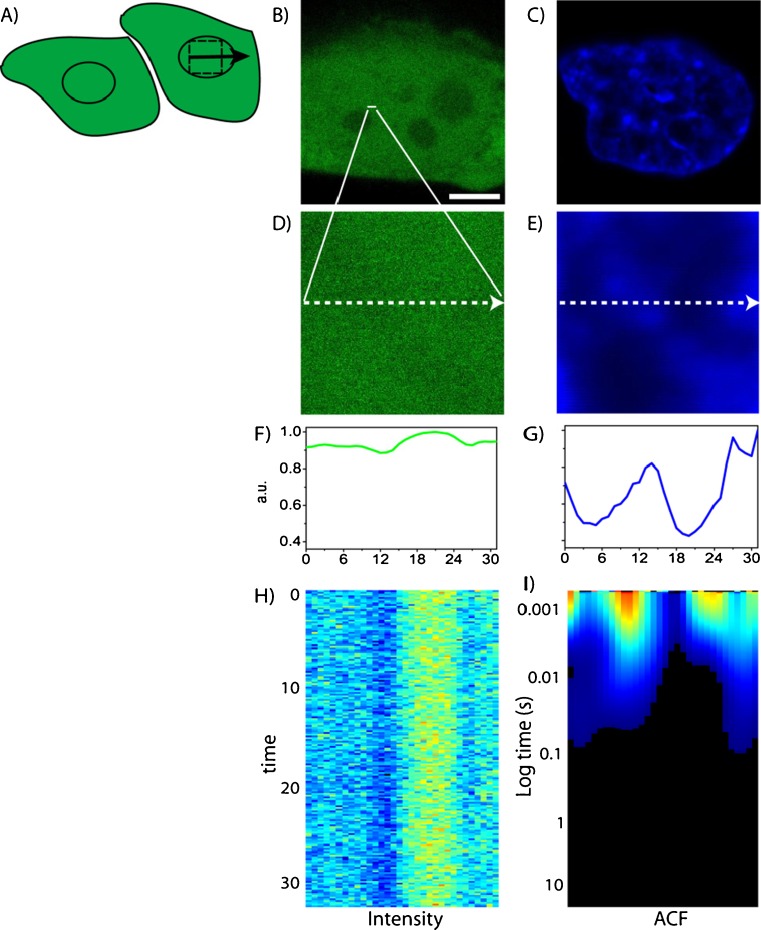
As a first example, we will show the analysis of molecular flow directed by interphase chromatin using CHO-K1 cells stably expressing GFP and stained with Hoechst 33342 to label the DNA and thus provide an estimate of local chromatin density (Fig. 5a–c). For each interphase cell tested, we performed several line scan experiments within the nucleus, with each line being deliberately positioned across a region of high chromatin density to test this zone as a barrier to GFP diffusion (Fig. 5d, e). The selected line was scanned rapidly in the GFP channel and constructed into an intensity carpet (Fig. 5h). First, we extracted the local diffusive information from the intensity carpet by calculation of the autocorrelation function (ACF) for in each pixel (Fig. 5i). We found that the concentration of GFP inversely correlates with chromatin density, and the diffusive behavior in all chromatin environments adequately fitted to a 2-diffusive component model (Hinde et al. 2010). From the diffusion coefficients derived, we found that GFP diffusion is neither impeded nor dependent upon chromatin density, which is in agreement with reported results (Wachsmuth et al. 2000; Dross et al. 2009). Thus, if there is a dependence of GFP diffusion on chromatin density, it must manifest itself on a length scale outside the resolution of the FCS technique employed (about 0.3 μm).
Fig. 5.
ACF carpet analysis of intranucelar diffusion in an interphase nucleus. a A line is scanned across the chromatin in the interphase nucleus (scale bar 5 μm). b– e Free GFP (green) in a CHOK1 nucleus stained with Hoechst 33342 (blue). f, g Intensity profiles of GFP and Hoechst 33342 across the line drawn. h, i Fluorescence intensity carpet and ACF carpet of the line drawn across freely diffusing GFP. Figure partly taken from Hinde et al. (2010)
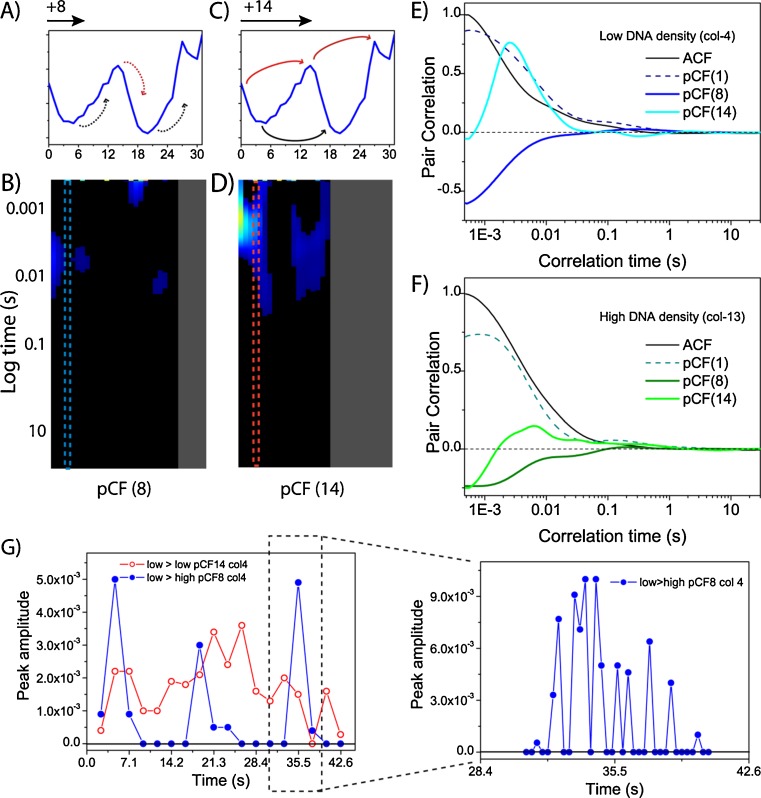
We therefore increased the distance at which we carry out pCF analysis from 0 pixels (ACF) to a distance over many pixels (microns) to test a potential dependence of the diffusive route adopted by GFP on chromatin density. In particular, we first investigate molecular flow in and out of the interphase chromatin by performing pCF analysis at a distance which cross-correlate pixels from either low-to-high or high-to-low chromatin density. For the example shown in Fig. 6a, this corresponds to pCF analysis at a distance of 8 pixels (0.8 μm), as indicated by the Hoechst-33342 intensity profile. In general, when testing this diffusive route, we find GFP diffusion from low-to-high or high-to-low chromatin density to be negligible on the time scale measured, as shown by the overall absence correlation in the pCF(8) carpet (Fig. 6b). This result suggests the interphase chromatin to be impenetrable and the flow of GFP molecules to be directed around this barrier to diffusion. To test this alternate diffusive route, we next performed pCF analysis at a distance which cross-correlate pixels from low-to-low chromatin density around a high-density region and from high-to-high chromatin density around a low-density region. At this distance [pCF(14) in Fig. 6c], we observe communication around a high-density chromatin region (i.e. low-to-low) in the timescale of 1–30 ms and around a low-density chromatin region (high-to-high) in the timescale of 10–80 ms. In the pCF carpet, this diffusive behavior is observed as delayed positive cross-correlation surrounded by columns of zero cross-correlation due to the lack of molecular flow through the interphase chromatin (Fig. 6d). If we observe absence of GFP molecular flow in and out of the interphase chromatin and yet GFP diffusion can be easily detected in both environments (Fig. 6e, f), how did GFP get in and out of the chromatin in the first place?
Fig. 6.
pCF carpet analysis of intranuclear diffusion. a, b Intensity profile of the Hoechst 33342 stain across the line measured. c, d pCF carpets corresponding to the distances of 8 and 14 pixels, respectively. e, f Plot of the amount of correlation for column 4 and 13 at each analysed distance (0, 8 and 14). Curves are normalized to 1 with respect to the ACF. g Decomposition of column 4 into shorter time fragments (5,000 lines, 2.36 s) at the two calculated distances. A plot of the maximum amplitude of correlation detected for each fragment against the time of acquisition is shown. A peak in the pCF(8) analysis is further decomposed every 600 lines (300 ms) (right plot). Figure partly taken from Hinde et al. (2010)
One possible explanation is that the transit through a change in chromatin density is a rare event limited in time, and our analysis resulted in the small population of molecules performing this transit becoming difficult to detect in the time-averaged experiment. We therefore repeated the pCF analysis of molecular flow in and out the interphase chromatin, decomposing the time of acquisition into smaller time increments (seconds); to increase the probability of detecting a rare event (Fig. 6g). Application of this temporal analysis to the columns originally observed to contain near zero correlation reveals intermittent periods of positive correlation; that is, bursts of communication. Furthermore, pCF analysis of the same ‘bursts’ in the opposite direction, reveals identical timing: thus these events are bidirectional (Hinde et al. 2010).
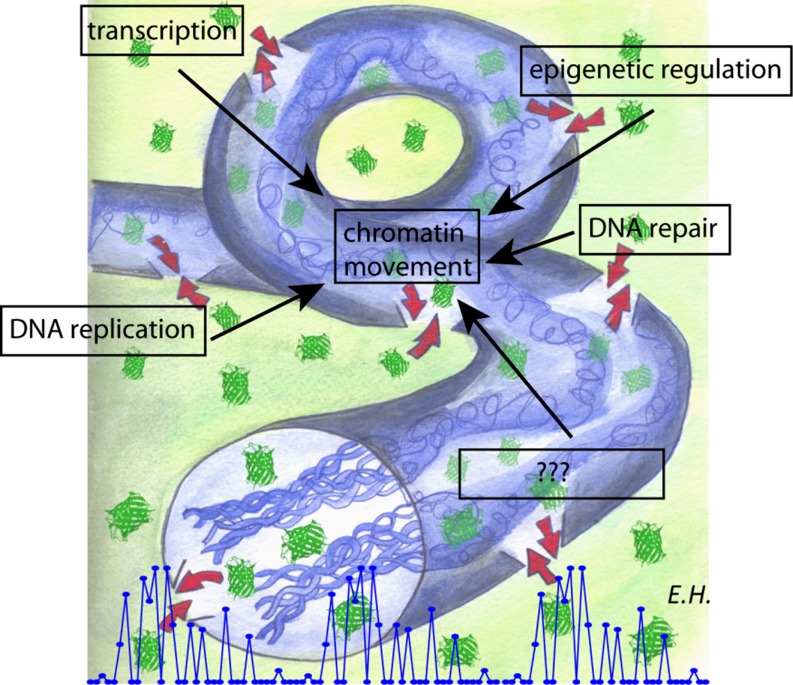
Together with the observation that the bursts are dependent on metabolic energy (Hinde et al. 2011), the results in interphase nuclei indicate that chromatin is organized as a networked channel which directs the diffusion of small molecules throughout and controls communication to the surrounding environment (Fig. 7). It is worth noting that most nuclear processes taking place on the chromatin (e.g., transcription, DNA replication and repair, epigenetic regulation, etc.; Fig. 7) rely on metabolic energy. Furthermore, all these processes involve the controlled movement/rearrangement of the chromatin structure (Woodcock and Ghosh 2010; Soutoglou and Misteli 2007). In particular, the timing of the bursts observed here is in keeping with the temporal dynamics involved with intrinsic localized changes in chromatin structure (Levi et al. 2005). This observation, in turn, opens the important question of how do different chromatin architectures taking place during the cell cycle affect the diffusion of small molecules. For example, are the rules of communication established for molecular flow of inert molecules in interphase nuclei conserved in mitosis, where all the energy-dependent processes are turned off (Woodcock and Ghosh 2010)? To address this issue, we measured the molecular flow of GFP in nuclei actively undergoing mitosis and during interphase, in the adult germ line of C. elegans expressing monomeric GFP (Fig. 8a) (Hinde et al. 2011): a biological system which enables the concomitant measurement of both cell cycle stages (in one sample!) (Cinquin et al. 2010).
Fig. 7.
Schematic representation of the ‘burst’ model. Two disconnected volumes are generated by the chromatin structure. The inert tracer GFP does diffuse throughout the high chromatin density networked channel (blue) as well as the low chromatin density surroundings, with intermittent bursts of molecules traversing the channel barrier (red arrows). Many possible intranuclear processes may be responsible for the observed GFP behavior. All of them are energy-consuming processes and involve the local dynamic rearrangement of chromatin structure
Fig. 8.
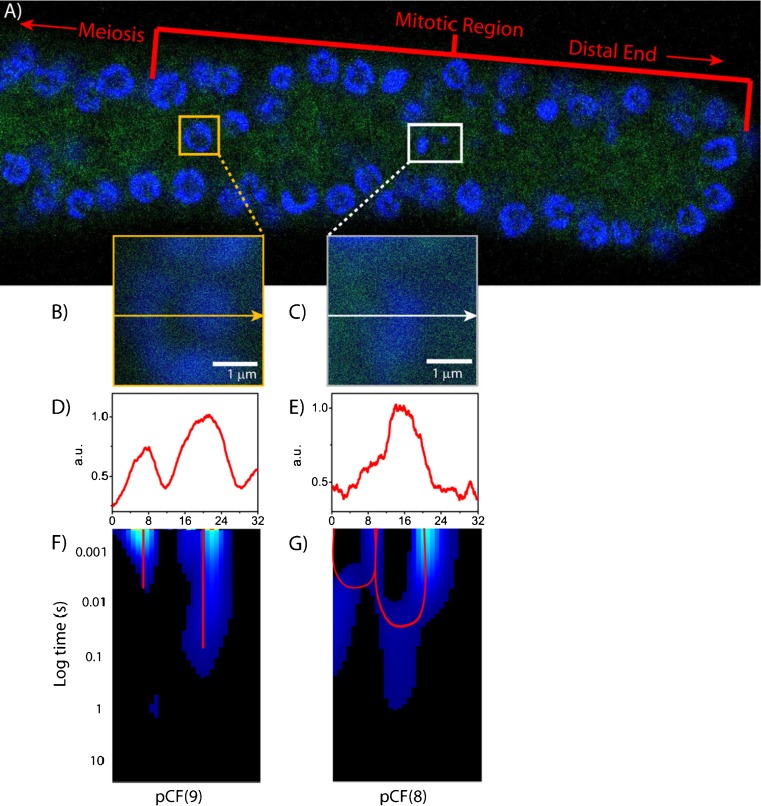
GFP molecular flow in the C.elegans germ line. a The adult germ line of C.elegans expressing monomeric GFP, with the nuclei stained with Hoechst 33342. b, c Overlay of GFP and Hoechst-33342 signals for two analyzed cells. d, e Intensity profile of GFP and Hoechst-33342 across the line measured. f The pCF(9) carpet derived in the interphase nucleus, showing gaps of correlation. g The pCF(8) carpet derived in a nucleus actively undergoing mitosis, showing delayed communication. Figure partly taken from Hinde et al. (2011)
The line experiments were thus conducted across a heterogeneous chromatin environment in each of the two cell cycle stages: (1) a dense region of interphase chromatin (Fig. 8B) or (2) a mitotic chromosome (Fig. 8C). The pCF analysis was then performed along the line at a distance determined in each case by the intensity profile of the Hoechst-33342 stain (Fig. 7d, e). For the interphase nuclei tested, we find that the disconnected molecular flow pattern previously observed in live CHO-K1 cells is conserved (pCF(9) in Fig. 8F). For the mitotic nuclei, instead, we observe GFP to adopt a markedly different diffusive route upon encountering the chromosome (pCF(8) carpet in Fig. 8g). In general, we observe GFP diffusion within both the low and the high chromatin density environments, with communication on the sub-millisecond time scale (free diffusion). We also observe flow of GFP through the change of chromatin density (border of the chromosome), with delayed communication occurring on the tens of millisecond timescale (obstructed diffusion). Together, these two observations cause the pCF carpet to mirror the shape of the chromosome that is being measured as a barrier: a characteristic arc shape upon entry into the chromosome, and another upon exit. This double-arc feature is analogous to that obtained upon simulation of a penetrable barrier (see Fig. 3).
In conclusion, we find that the molecular flow and mechanism of regulation imparted by chromatin (i.e. the passive obstruction in mitosis and bursts in interphase), that was initially observed in CHO-K1 cells, were also found in the C. elegans germ line. This in turn suggests that, despite differences in complexity, chromatin content and nuclear volume, the structural and functional rearrangements that chromatin must undergo during the cell cycle are retained on a more widespread level than cell type or organism. Fundamental questions remain as to which chromatin structural components (in the case of mitosis) or which chromatin-dependent activities/arrangements (in the case of interphase) are responsible for the observed regulation of molecular flow within the nucleus.
Future directions
The pair correlation method is a non-invasive, sensitive technique that follows the same molecule over a large area, thereby producing a map of molecular flow. Finally, we believe that many future developments can be built on this basis: the pCF method can be combined with other optical information (e.g., lifetime, polarization, etc.) and/or setups (e.g., orbital tracking, 2-channel acquisition, etc.) to provide a more detailed description of molecular transport in different intra- or extra-cellular environments. In a 2-channel acquisition, for instance, the pCF analysis (in this case better named as ‘cross-pair correlation’) has the potential to detect the molecular flow of interacting molecules, thus producing a 3D spatio-temporal map of protein-protein interactions and flow. In the near future, we envision the pair correlation approach as a common tool to look at single molecule behavior in cells, tissues, or live organisms.
Acknowledgements
The authors are grateful to Enrico Gratton for his invaluable contribution to this work through teaching, continuous motivation and discussion. The authors would also like to thank Michelle Digman for her precious help with planning experiments and discussion of data. This work was supported by NIH-P41-RRO3155, P50-GM076516 and NIH-U54 GM064346 Cell Migration Consortium.
References
- Calapez A, Pereira HM, Calado A, Braga J, Rino J, Carvalho C, Tavanez JP, Wahle E, Rosa AC, Carmo-Fonseca M. The intranuclear mobility of messenger RNA binding proteins is ATP dependent and temperature sensitive. J Cell Biol. 2002;159(5):795–805. doi: 10.1083/jcb.200203046. [DOI] [PMC free article] [PubMed] [Google Scholar]
- Cardarelli F, Gratton E. In vivo imaging of single-molecule translocation through nuclear pore complexes by pair correlation functions. PLoS One. 2010;5(5):e10475. doi: 10.1371/journal.pone.0010475. [DOI] [PMC free article] [PubMed] [Google Scholar]
- Cardarelli F, Serresi M, Bizzarri R, Giacca M, Beltram F. In vivo study of HIV-1 Tat arginine-rich motif unveils its transport properties. Mol Ther. 2007;15(7):1313–1322. doi: 10.1038/sj.mt.6300172. [DOI] [PubMed] [Google Scholar]
- Cardarelli F, Serresi M, Bizzarri R, Beltram F. Tuning the transport properties of HIV-1 Tat arginine-rich motif in living cells. Traffic. 2008;9(4):528–539. doi: 10.1111/j.1600-0854.2007.00696.x. [DOI] [PubMed] [Google Scholar]
- Cardarelli F, Bizzarri R, Serresi M, Albertazzi L, Beltram F. Probing nuclear localization signal-importin alpha binding equilibria in living cells. J Biol Chem. 2009;284(52):36638–36646. doi: 10.1074/jbc.M109.036699. [DOI] [PMC free article] [PubMed] [Google Scholar]
- Cardarelli F, Serresi M, Albanese A, Bizzarri R, Beltram F. Quantitative analysis of tat peptide binding to import carriers reveals unconventional nuclear transport properties. J Biol Chem. 2011;286(14):12292–12299. doi: 10.1074/jbc.M110.203083. [DOI] [PMC free article] [PubMed] [Google Scholar]
- Ciciarello M, Mangiacasale R, Thibier C, Guarguaglini G, Marchetti E, Di Fiore B, Lavia P. Importin beta is transported to spindle poles during mitosis and regulates Ran-dependent spindle assembly factors in mammalian cells. J Cell Sci. 2004;117(Pt 26):6511–6522. doi: 10.1242/jcs.01569. [DOI] [PubMed] [Google Scholar]
- Cinquin O, Crittenden SL, Morgan DE, Kimble J. Progression from a stem cell-like state to early differentiation in the C. elegans germ line. Proc Natl Acad Sci USA. 2010;107(5):2048–2053. doi: 10.1073/pnas.0912704107. [DOI] [PMC free article] [PubMed] [Google Scholar]
- Cronshaw JM, Krutchinsky AN, Zhang W, Chait BT, Matunis MJ. Proteomic analysis of the mammalian nuclear pore complex. J Cell Biol. 2002;158(5):915–927. doi: 10.1083/jcb.200206106. [DOI] [PMC free article] [PubMed] [Google Scholar]
- Dange T, Grunwald D, Grunwald A, Peters R, Kubitscheck U. Autonomy and robustness of translocation through the nuclear pore complex: a single-molecule study. J Cell Biol. 2008;183(1):77–86. doi: 10.1083/jcb.200806173. [DOI] [PMC free article] [PubMed] [Google Scholar]
- Dertinger T, Loman A, Ewers B, Muller CB, Kramer B, Enderlein J. The optics and performance of dual-focus fluorescence correlation spectroscopy. Opt Express. 2008;16(19):14353–14368. doi: 10.1364/OE.16.014353. [DOI] [PubMed] [Google Scholar]
- Digman MA, Gratton E. Analysis of diffusion and binding in cells using the RICS approach. Microsc Res Tech. 2009a;72(4):323–332. doi: 10.1002/jemt.20655. [DOI] [PMC free article] [PubMed] [Google Scholar]
- Digman MA, Gratton E. Imaging barriers to diffusion by pair correlation functions. Biophys J. 2009b;97(2):665–673. doi: 10.1016/j.bpj.2009.04.048. [DOI] [PMC free article] [PubMed] [Google Scholar]
- Digman MA, Brown CM, Sengupta P, Wiseman PW, Horwitz AR, Gratton E. Measuring fast dynamics in solutions and cells with a laser scanning microscope. Biophys J. 2005;89(2):1317–1327. doi: 10.1529/biophysj.105.062836. [DOI] [PMC free article] [PubMed] [Google Scholar]
- Dross N, Spriet C, Zwerger M, Muller G, Waldeck W, Langowski J. Mapping eGFP oligomer mobility in living cell nuclei. PLoS One. 2009;4(4):e5041. doi: 10.1371/journal.pone.0005041. [DOI] [PMC free article] [PubMed] [Google Scholar]
- Fahrenkrog B, Aebi U. The nuclear pore complex: nucleocytoplasmic transport and beyond. Nat Rev Mol Cell Biol. 2003;4(10):757–766. doi: 10.1038/nrm1230. [DOI] [PubMed] [Google Scholar]
- Gorlich D, Kutay U. Transport between the cell nucleus and the cytoplasm. Annu Rev Cell Dev Biol. 1999;15:607–660. doi: 10.1146/annurev.cellbio.15.1.607. [DOI] [PubMed] [Google Scholar]
- Herrmann M, Neuberth N, Wissler J, Perez J, Gradl D, Naber A. Near-field optical study of protein transport kinetics at a single nuclear pore. Nano Lett. 2009;9(9):3330–3336. doi: 10.1021/nl901598z. [DOI] [PubMed] [Google Scholar]
- Hinde E, Cardarelli F, Digman MA, Gratton E. In vivo pair correlation analysis of EGFP intranuclear diffusion reveals DNA-dependent molecular flow. Proc Natl Acad Sci USA. 2010;107(38):16560–16565. doi: 10.1073/pnas.1006731107. [DOI] [PMC free article] [PubMed] [Google Scholar]
- Hinde E, Cardarelli F, Digman MA, Kershner A, Kimble J, Gratton E. The impact of mitotic versus interphase chromatin architecture on the molecular flow of EGFP by pair correlation analysis. Biophys J. 2011;100(7):1829–1836. doi: 10.1016/j.bpj.2011.02.024. [DOI] [PMC free article] [PubMed] [Google Scholar]
- Karpova TS, Chen TY, Sprague BL, McNally JG. Dynamic interactions of a transcription factor with DNA are accelerated by a chromatin remodeller. EMBO Rep. 2004;5(11):1064–1070. doi: 10.1038/sj.embor.7400281. [DOI] [PMC free article] [PubMed] [Google Scholar]
- Kim SA, Heinze KG, Schwille P. Fluorescence correlation spectroscopy in living cells. Nat Methods. 2007;4(11):963–973. doi: 10.1038/nmeth1104. [DOI] [PubMed] [Google Scholar]
- Korlann Y, Dertinger T, Michalet X, Weiss S, Enderlein J. Measuring diffusion with polarization-modulation dual-focus fluorescence correlation spectroscopy. Opt Express. 2008;16(19):14609–14616. doi: 10.1364/OE.16.014609. [DOI] [PMC free article] [PubMed] [Google Scholar]
- Kubitscheck U, Grunwald D, Hoekstra A, Rohleder D, Kues T, Siebrasse JP, Peters R. Nuclear transport of single molecules: dwell times at the nuclear pore complex. J Cell Biol. 2005;168(2):233–243. doi: 10.1083/jcb.200411005. [DOI] [PMC free article] [PubMed] [Google Scholar]
- Lanctot C, Cheutin T, Cremer M, Cavalli G, Cremer T. Dynamic genome architecture in the nuclear space: regulation of gene expression in three dimensions. Nat Rev Genet. 2007;8(2):104. doi: 10.1038/nrg2041. [DOI] [PubMed] [Google Scholar]
- Levi V, Ruan Q, Gratton E. 3-D particle tracking in a two-photon microscope: application to the study of molecular dynamics in cells. Biophys J. 2005;88(4):2919–2928. doi: 10.1529/biophysj.104.044230. [DOI] [PMC free article] [PubMed] [Google Scholar]
- Ma J, Yang W. Three-dimensional distribution of transient interactions in the nuclear pore complex obtained from single-molecule snapshots. Proc Natl Acad Sci USA. 2010;107(16):7305–7310. doi: 10.1073/pnas.0908269107. [DOI] [PMC free article] [PubMed] [Google Scholar]
- Macara IG. Transport into and out of the nucleus. Microbiol Mol Biol Rev. 2001;65(4):570–594. doi: 10.1128/MMBR.65.4.570-594.2001. [DOI] [PMC free article] [PubMed] [Google Scholar]
- Paine PL. Nucleocytoplasmic movement of fluorescent tracers microinjected into living salivary gland cells. J Cell Biol. 1975;66(3):652–657. doi: 10.1083/jcb.66.3.652. [DOI] [PMC free article] [PubMed] [Google Scholar]
- Pemberton LF, Paschal BM. Mechanisms of receptor-mediated nuclear import and nuclear export. Traffic. 2005;6(3):187–198. doi: 10.1111/j.1600-0854.2005.00270.x. [DOI] [PubMed] [Google Scholar]
- Phair RD, Misteli T. High mobility of proteins in the mammalian cell nucleus. Nature. 2000;404(6778):604–609. doi: 10.1038/35007077. [DOI] [PubMed] [Google Scholar]
- Politz JC, Browne ES, Wolf DE, Pederson T. Intranuclear diffusion and hybridization state of oligonucleotides measured by fluorescence correlation spectroscopy in living cells. Proc Natl Acad Sci USA. 1998;95(11):6043–6048. doi: 10.1073/pnas.95.11.6043. [DOI] [PMC free article] [PubMed] [Google Scholar]
- Politz JC, Tuft RA, Pederson T. Diffusion-based transport of nascent ribosomes in the nucleus. Mol Biol Cell. 2003;14(12):4805–4812. doi: 10.1091/mbc.E03-06-0395. [DOI] [PMC free article] [PubMed] [Google Scholar]
- Ries J, Schwille P. Studying slow membrane dynamics with continuous wave scanning fluorescence correlation spectroscopy. Biophys J. 2006;91(5):1915–1924. doi: 10.1529/biophysj.106.082297. [DOI] [PMC free article] [PubMed] [Google Scholar]
- Rossow MJ, Sasaki JM, Digman MA, Gratton E. Raster image correlation spectroscopy in live cells. Nat Protoc. 2011;5(11):1761–1774. doi: 10.1038/nprot.2010.122. [DOI] [PMC free article] [PubMed] [Google Scholar]
- Seksek O, Biwersi J, Verkman AS. Translational diffusion of macromolecule-sized solutes in cytoplasm and nucleus. J Cell Biol. 1997;138(1):131–142. doi: 10.1083/jcb.138.1.131. [DOI] [PMC free article] [PubMed] [Google Scholar]
- Soutoglou E, Misteli T. Mobility and immobility of chromatin in transcription and genome stability. Curr Opin Genet Dev. 2007;17(5):435–442. doi: 10.1016/j.gde.2007.08.004. [DOI] [PMC free article] [PubMed] [Google Scholar]
- Tini M, Benecke A, Um SJ, Torchia J, Evans RM, Chambon P. Association of CBP/p300 acetylase and thymine DNA glycosylase links DNA repair and transcription. Mol Cell. 2002;9(2):265–277. doi: 10.1016/S1097-2765(02)00453-7. [DOI] [PubMed] [Google Scholar]
- Wachsmuth M, Waldeck W, Langowski J. Anomalous diffusion of fluorescent probes inside living cell nuclei investigated by spatially-resolved fluorescence correlation spectroscopy. J Mol Biol. 2000;298(4):677–689. doi: 10.1006/jmbi.2000.3692. [DOI] [PubMed] [Google Scholar]
- Weis K. Regulating access to the genome: nucleocytoplasmic transport throughout the cell cycle. Cell. 2003;112(4):441–451. doi: 10.1016/S0092-8674(03)00082-5. [DOI] [PubMed] [Google Scholar]
- Woodcock CL, Ghosh RP. Chromatin higher-order structure and dynamics. Cold Spring Harb Perspect Biol. 2010;2(5):a000596. doi: 10.1101/cshperspect.a000596. [DOI] [PMC free article] [PubMed] [Google Scholar]
- Yang W, Gelles J, Musser SM. Imaging of single-molecule translocation through nuclear pore complexes. Proc Natl Acad Sci USA. 2004;101(35):12887–12892. doi: 10.1073/pnas.0403675101. [DOI] [PMC free article] [PubMed] [Google Scholar]


