Abstract
The mechanical properties of the respiratory system are important determinants of its function and can be severely compromised in disease. The assessment of respiratory system mechanical properties is thus essential in the management of some disorders as well as in the evaluation of respiratory system adaptations in response to an acute or chronic process. Most often, lungs and chest wall are treated as a linear dynamic system that can be expressed with differential equations, allowing determination of the system’s parameters, which will reflect the mechanical properties. However, different models that encompass nonlinear characteristics and also multicompartments have been used in several approaches and most specifically in mechanically ventilated patients with acute lung injury. Additionally, the input impedance over a range of frequencies can be assessed with a convenient excitation method allowing the identification of the mechanical characteristics of the central and peripheral airways as well as lung periphery impedance. With the evolution of computational power, the airway pressure and flow can be recorded and stored for hours, and hence continuous monitoring of the respiratory system mechanical properties is already available in some mechanical ventilators. This review aims to describe some of the most frequently used models for the assessment of the respiratory system mechanical properties in both time and frequency domain.
Keywords: Respiratory system impedance, Single-compartment model, Multicompartment model, Constant phase impedance model, Lung mechanics modelling
Introduction
Pulmonary gas exchange requires a continuous flow of fresh gas and blood in the alveoli and alveolar capillaries. Air flows from a region of higher pressure to one of lower pressure. At end-expiration, the alveolar pressure equals atmospheric pressure, and during spontaneous inspiration alveolar pressure is smaller than atmospheric pressure. Since the movements of the lungs are entirely passive, forces must be applied in order to expand the lungs and, as a consequence, decrease alveolar pressure from its resting pressure at end-expiration. In the case of spontaneous breathing, the respiratory muscles provide the external forces, whereas artificial ventilation moves the relaxed respiratory system, increasing alveolar pressure during inspiration (Macklem 1998).
During inspiration the external forces must overcome the impedance of the lung and chest wall, the two components of the respiratory system. This impedance stems mainly from the force necessary to overcome elastic recoil as well as the frictional resistance during the movement of the tissues of the lungs and thorax, and finally, from the force necessary to overcome the frictional resistance to airflow along the tracheobronchial tree. The inertial component of gas and tissue is usually negligible during conventional (low frequency) ventilation as well as in subjects breathing without artificial airways such as an endotracheal tube (Ingram and Pedley 1986; Rodarte and Rehder 1986).
At end-inspiration, the potential energy accumulated in the elastic tissues of the lungs and chest wall throughout inspiration is used to generate the pressure gradient that will produce exhalation.
The mechanical properties of the respiratory system may become severely compromised in a number of common lung diseases. The assessment of respiratory system mechanical properties is thus essential in the management of these disorders as well as in the evaluation of respiratory system adaptations in response to acute or chronic processes. Most often, lungs and chest wall are treated as a linear dynamic system that can be expressed with differential equations, allowing determination of the system’s parameters, which will reflect their mechanical properties. Additionally, the input impedance over a range of frequencies can be assessed with a convenient excitation method allowing the subdivision of the mechanical characteristics of the central and peripheral airwaysas well as lung periphery impedance.
This review aims to describe some of the most commonly used models for the assessment of the respiratory system mechanical properties in both time and frequency domain.
Elastic properties of the respiratory system
For didactic purposes, it is useful to describe the recoil characteristics of the lungs and chest wall separately, but obviously they have to be appraised together. The two structures are in series with each other and, therefore, the elastic pressure of the total respiratory system (Pel,rs) constitutes the sum of the lung and chest wall elastic pressures (Pel,L and Pel,w, respectively). Thus, the respiratory system volume-pressure curve presents an S-shaped profile: limited at high lung volumes by the fall in lung compliance and at low lung volumes by the chest wall’s smaller compliance (Rahn et al. 1946). In a normal adult person, the expanding tendency of the chest wall exactly counterbalances the lung recoil at a lung volume approximating 35% of its vital capacity. This point on the V-P curve of the normal respiratory system represents the functional residual capacity (FRC), and the system is said to be at its elastic equilibrium point. In other words, to inflate it from FRC an inspiratory force must be applied, whereas exhalation below FRC demands an expiratory force.
Since the lungs and chest wall recoil in opposite directions, forces tending to separate the visceral from the parietal pleura result. Considering the pleural surface as a continuum, a virtual closed space (pleural space) is formed. A small amount of liquid exists in this space, which allows not only the coupling of visceral and parietal pleurae, thus yielding the transmission of forces between the two structures, but also generates a lubricated system that allows a free and rapid movement of the lung in relation to the chest wall. The measurement of the intrapleural pressure (Ppl) at the elastic equilibrium point of the respiratory system (FRC) discloses a subatmospheric value, normally around −4 cmH2O. This “negative” pressure reflects the net result of the forces acting on the pleurae (lung recoil and chest wall expansion). During spontaneous inspiration, muscle contraction expands the chest wall and the parietal pleura pulls out the visceral leaflet. As a result Ppl becomes more negative, reaching values around −7 or −8 cmH2O during resting tidal breathing. Naturally, during expiration it returns to its resting value. Intrapleural pressure may become positive, though. For instance, it may increase during the augmented ventilation resulting from physical exertion or during cough. Under these conditions muscle force is directed to quickly diminish lung volume, and the parietal pleura compresses the visceral one. Intrapleural pressure can also increase and become positive during artificial ventilation, because in this case the positive pressure in the airways pushes the visceral pleura against the parietal leaflet.
Both the lungs and the chest wall can be approximated to elastic structures, with the transmural pressure gradient corresponding to stress and lung volume to strain. Over a certain range of volumes and pressures, lung and chest wall structures obey Hooke’s law. Thus, the change in lung and chest wall volumes divided by the changes in the elastic pressure required to produce them yields compliance (C). Elastance (E) is the reciprocal of compliance, i.e., ∆Pel/∆V, and is usually expressed in centimeters of water per liter (cmH2O/L).
| 1 |
Stiff structures present a high elastance. Respiratory system elastance equals the sum of lung plus chest wall elastances (
To calculate chest wall elastance (Ew), transthoracic pressure (= Ppl – Pbs) is used in the numerator and divided by the change in lung volume. As in the case of lung compliance, there is an elastic limit to the chest wall. From total lung capacity down to approximately 20% of the vital capacity, Cw is fairly constant. Below this point, it decreases progressively with the fall in lung volume.
The determination of the chest wall elastance/compliance conveys important clinical information, since its elastic behavior can be affected by a series of conditions, e.g., ascites, obesity, extremely voluminous breasts, vertebral ankylosis, and severe kyphoscoliosis among others.
Resistive properties of the respiratory system
So far we have dealt with pressures related solely to the elastic properties of the respiratory system, hence depending on the gas volume and the elastance of each component of the system, i.e., lung and chest wall. Pressure gradients generated by pure elastic forces are static and, thus, independent of the existence of airflow.
When the respiratory system moves the driving force of the system must overcome an additional mechanical element: resistance (R) or resistive pressure (Pres). Respiratory system resistance (Rrs) can be measured by dividing Pres,rs by airflow, where Pres,rs represents the respiratory system resistive pressure, or, in other words, the pressure used to overcome its resistive elements. Airway resistance and the resistance offered by the lung and chest wall tissues contribute to Rrs. Rrs can be divided into RL (pulmonary resistance) and Rw (chest wall resistance).
Pulmonary resistance can be divided into two components arranged in series: airway resistance (Raw) and pulmonary tissue resistance (Rtis). Thus, RL can be mathematically modeled as
If air flows in a tube, there is a pressure difference (∆P) between the two extremities of the tube. This pressure gradient will depend on the airflow
According to Hagen-Poiseuille’s law:
| 2 |
thus,
| 3 |
where η represents gas viscosity, L is the length of the tube, and r corresponds to the tube radius. One can quickly appreciate that the radius of the airways represents the main component of airway resistance since it is raised to the power of 4. In this way, if the radius of the tube is halved, ∆P should be multiplied by 16 (= 24) for the same airflow to be maintained.
If airflow increases, the gas molecules lose their laminar arrangement and turbulence ensues. This random movement of the gas molecules is called turbulent flow. The pressure required to keep this flow is substantially larger than that necessary to maintain a laminar flow. Under these conditions, the driving pressure is proportional to the squared flow:
| 4 |
where K2 is a constant. Turbulent flow depends on the density of the gas but not on its viscosity.
The tracheobronchial tree represents a complex system of tubes with many branching points, changes in diameter, and irregular surfaces. In a system such as the lung that branches out quite rapidly, laminar flow occurs solely in the small airways. Over the major portion of the tree, flow is transitional, and Rohrer’s equation, where resistive pressure is determined by flow and also by its square, should be employed:
| 5 |
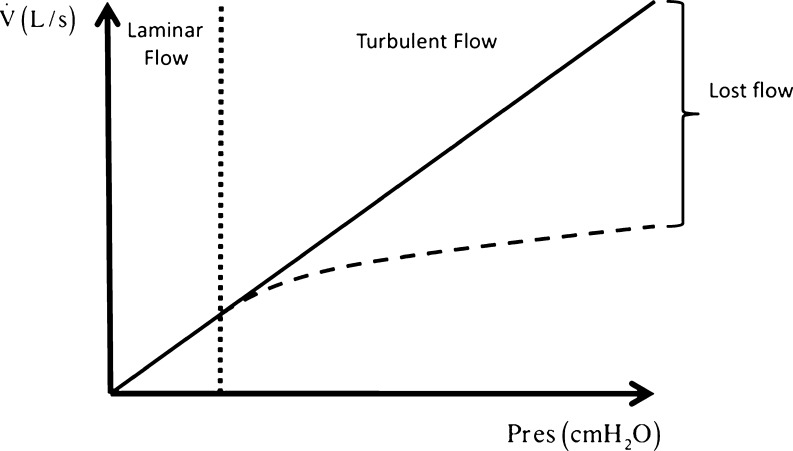
where K1 relates to the laminar flow and K2 to the turbulent component. Thus, for the same driving pressure, if no turbulence occurs the second component of the equation becomes null, and all the pressure produces airflow. On the other hand, in the presence of turbulence the same pressure must be split between the two components, and less energy is available to generate airflow, since part of it will be spent as heat by the turbulent flow (Rohrer 1915) (Fig. 1).
Fig. 1.
Schematic representation of the relationship between airflow and resistive pressure (Pres). During laminar flow Pres produces airflow (straight continuous line). On the other hand, in the face of turbulence (broken line) Pres must overcome two components (K1 and K2 in Rohrer’s equation), and, thus, less energy will generate airflow, since part of Pres will be spent as heat by the turbulent flow. As a result, the vertical difference between the continuous and the broken lines represents the lost flow, i.e., the flow that could have been generated if no turbulence were present
Since the radius constitutes the most important factor determining resistance through a tube, a thorough measurement of the cross-sectional area of each branching generation of the tracheobronchial tree was done. Interestingly, the narrower segment of the tree occurs in the central airways, somewhere around the segmental to subsegmental bronchi (Pedley et al. 1970). As a result Raw is much higher in the central bronchi than at the lung periphery, which characterizes the difficulty of measuring peripheral airway resistance.
In addition to airway resistance, caused by the frictional resistance due to the flow of gas molecules through the airways, there is another frictional resistance in the pulmonary and thoracic tissues themselves. Pulmonary tissue resistance results from the energy loss generated by the viscosity pertaining to the movement of lung tissue itself. In other words, the molecules that constitute the tissue burn energy as heat as they move past each other. Formerly tissue resistance was regarded as negligible, but presently it is known to be highly dependent on inspiratory duration (Similowski et al. 1989), volume, and flow (Kochi et al. 1988a, b; Auler et al. 1990; D’Angelo et al. 1991).
It has been consistently observed that recoil pressures at the same lung volumes are always less during deflation than during inflation (a phenomenon named hysteresis), meaning that the mechanical work expended during inflation exceeds that recovered during deflation. With repeated cycling, loops enclose an area representing the energy lost per cycle (Hoppin et al. 1986). During quiet breathing, this area is nearly independent of breathing frequency. Thus under constant amplitude cycling, energy dissipation is nearly independent of frequency (Agostoni and Hyatt 1986). It follows that resistance must be inversely proportional to frequency (Bachofen 1968). In fact, tissue resistance sharply contrasts with airway resistance, which exhibits much less frequency dependence (Hoppin et al. 1986). This characteristic of tissue resistance will be better addressed in the development of the concept of viscoelasticity in the next section of the present article. In fact, lung parenchyma displays prominent viscoelastic behavior. However, resistive pressures across tissue, in contrast to airways, are non-Newtonian (Hildebrandt 1969, 1970). It is recognized that the major part of energy dissipation associated with cyclic lung expansion depends on the amount of expansion but not on the rate of expansion, demonstrating that lung tissue shows a stress incompatible with the notion of a viscous stress (Fredberg and Stamenovic 1989). Thus, the relative contribution of tissue resistance to overall lung resistance can be magnified by large volume changes and by low flow rates, the opposite effect being observed in the airway component (Ludwig et al. 1987).
Similarly to the pulmonary tissue resistance, chest wall tissue resistance depends on volume and airflow (D’Angelo et al. 1991; Kochi et al. 1988a, b; D’Angelo et al. 1994). Chest wall resistance is not negligible in normal subjects and may account for a substantial amount of energy expenditure in certain pathological conditions compromising the unhindered movement of the chest wall. Interestingly, chest wall tissue resistance seems to exhibit the same viscoelastic behavior as lung tissue resistance and can be equally described by the viscoelastic model described below.
Inertive properties
The inertance of the respiratory system ascribes to the changes in pressure in phase with acceleration:
| 6 |
where PI(t) is the inertive pressure, I is the inertance, and
The inertial coefficient of the respiratory system for nonobese patients has been show to be small (0.01 cmH2O L−1 s−2) (Sharp et al. 1964). As a consequence, the inertance has not been considered in the measurement of respiratory mechanical properties in adults during conventional ventilation (Lanteri et al. 1999). However, neglecting the inertive component has recently been questioned, especially in mechanically ventilated patients with endotracheal tube (EET) (Sullivan et al. 1976; Lanteri et al. 1999; Jandre et al. 2008). Additionally, mechanical ventilation in infants usually requires high respiratory frequency as well as an artificial airway with a small inner diameter and length, which contributes even more to the necessity of taking into account inertial properties.
In addition to airflow acceleration, the acceleration of lung and chest wall tissue is an important component of respiratory system impedance. However, their contribution to the pressure required to overcome respiratory system impedance is usually less than 1% during conventional ventilation.
Input impedance models: time domain analysis
Single-compartment models
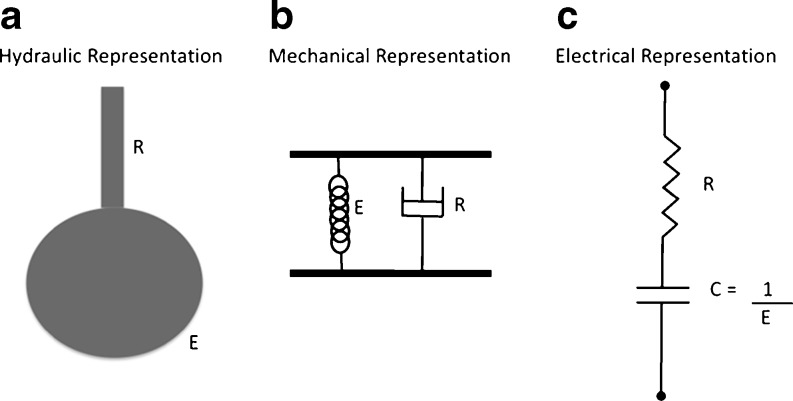
The simplest strategy to model the mechanical properties of the respiratory system is the single-compartment model. In this model the lung can be viewed as being like a balloon sealed over the end of a pipe (Fig. 2a) or analogously, in mechanical and electrical terms (Fig. 2b and c, respectively). Note that this model presents a clear analogy to a real lung, where the pipe represents the conducting airways and the balloon the elastic parenchymal tissue. Functionally, it is possible to associate the single-compartment model with respiratory movements, since inspiration and expiration can be reproduced by the inflation and deflation of the balloon, respectively. In this section, we will present the single-compartment models most often used for monitoring respiratory system impedance.
Fig. 2.
Representation of respiratory system considering the linear single-compartment model. Hydraulically (a) this model lung can represented by a balloon sealed over the end of a pipe. Mechanically, the association of a spring and a dashpot in parallel describes this model (b). The electrical analog consists of a serial association of a resistor and a capacitor (c). Note that the pipe (R) in the hydraulic representation is equivalent to the dashpot and the electrical resistor in the mechanical and electrical analog, respectively. The same can be observed with the balloon (E), which is represented by a spring or a capacitor, respectively. This analogy is valid when the airway pressure is equivalent to the force or tension and when flow is equivalent to velocity or current in the mechanical and electrical analogs, respectively. Thus, all representations are equivalent, and their constitutive equations are identical. This peculiarity stems from the impedance or indirect analogy used throughout this article
Linear single-compartment model
If the respiratory system elastance and resistance are linear, the single-compartment model can be mathematically written assuming the constitutive properties of the respiratory system previously shown in Eqs. 1 and 2. Thus:
| 7 |
where Pres and Pel are the resistive and elastic pressure, respectively, and P0 is the end-expiratory pressure. Equation 7 can be rewritten as:
| 8 |
This is the equation of motion of the single-compartment linear model. The variables of the model are Paw,
Although attractive, mostly because Paw,
Flow-dependent resistance model
The single-compartment model is linear since its independent variables (
The flow-dependent resistance model exemplifies a nonlinearity related to the change in total airway resistance with airflow. Including Eq. 11 in Eq. 5 yields:
| 9 |
This model can be useful when flow is turbulent, as predicted by the Rohrer’s equation (Eq. 5). The most common application of this model occurs in patients under mechanical ventilation with an endotracheal tube (Sullivan et al. 1976; Lanteri et al. 1999). In fact, it seems that under such conditions, the impedance of the endotracheal tube may significantly contribute to the global pressure-flow behavior (Sullivan et al. 1976; Jandre et al. 2008). However, the nature of the apparent nonlinearity in resistive properties seems to be much more dependent on the breathing pattern and flow waveform (Jandre et al. 2008). Of note, the parameters K1 and K2 do not present an intuitive physiological interpretation like the linear Rrs, being just the parameters that fit a quadratic dependence between resistive pressure and airflow.
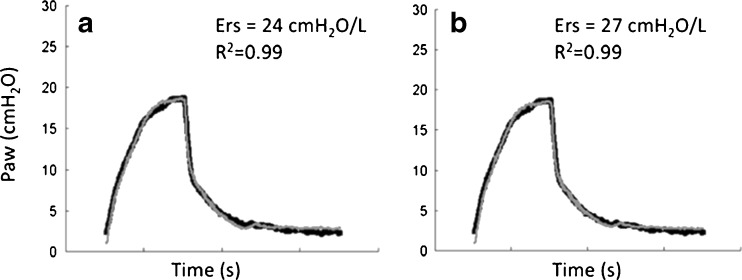
An example of the model fitting by applying Eq. 9 can be observed in Fig. 3. This figure depicts the measured and estimated Paw in a breath cycle of a lung-healthy anesthetized patient under pressure-controlled ventilation with a tidal volume of 8 ml/kg and an ETT (7.5 mm inner diameter). Note how the inclusion of the flow-dependent resistance modified the estimation of Ers by about 10% (Fig. 3b vs. a).
Fig. 3.
Measured airway pressure (Paw, bold line) and its estimation (gray line) by the linear single-compartment model without (a) and with (b) the inclusion of the flow-dependent term in its constitutive equation. Single breaths produced by an anesthetized and paralyzed healthy patient are depicted. Patient was monitored during surgery and ventilated in pressure-controlled ventilation with a constant tidal volume of 8 ml/kg, endotracheal tube of 8 mm inner diameter, and zero end-expiratory pressure. Note that the inclusion of the flow-dependent parameter K2 increased respiratory system elastance (Ers) by about 10%
Volume-dependent elastance model
Similarly to the flow-dependent single-compartment model, it is also possible that the Ers changes with volume. In this model, the linear Ers is partitioned in volume-independent (E1) and dependent (E2.V) components as
| 10 |
The equation of motion of the volume-dependent elastance model is:
| 11 |
In contrast to the terms K1 and K2 in the volume-dependent model, the parameters E1 and E2V can be interpreted physiologically. The component E1 is the slope of the elastic pressure-volume (PV) curve at the beginning of inspiration (VT equals zero) whereas E2 describes the concavity of the elastic PV curve throughout inspiration.
This model allows the calculation of the fraction of volume-dependent elastance (%E2) in relation to Ers, now computed as Ers = E1 + E2.VT (Kano et al. 1994; Bersten 1998).
| 12 |
Accordingly, with a negative %E2 the model fits a PV curve displaying a downward concavity. In this case the first derivative of the PV curve (elastance) decreases throughout inspiration suggesting a progressive recruitment of previously collapsed alveoli and/or small airways. With a positive %E2, the model fits a PV curve with an upward concavity where the elastance increases throughout inspiration suggesting a progressive alveolar overdistension.
This model has been applied in the identification of overdistension in mechanically ventilated patients with acute lung injury as well as in healthy subjects under mechanical ventilation (Kano et al. 1994; Bersten 1998; Carvalho et al. 2008). In general, the volume-dependent elastance model seems to be quite independent of the respiratory resistance or inertive components (Lanteri et al. 1999; Jandre et al. 2008). However, a study with numerically simulated data suggests that the unmindfulness of the endotracheal tube mechanical properties may bias the identification of overdistension, especially during mechanical ventilation with pressure-controlled ventilation (Jandre et al. 2008).
This model offers an advantage: it can be used independently of the respiratory flow waveform and thus can be applied to both volume- and pressure-controlled ventilation. Figure 4 shows a set of curves from the same patient as in Fig. 3 fitted with the volume-dependent elastance model at three different levels of positive end-expiratory pressure (PEEP = 2, 5, and 10 cmH2O). Since pulmonary atelectasis is a common finding during general anesthesia, some lung recruitment (partial reversion of collapsed areas) can be expected as PEEP increases (Duggan and Kavanagh 2005; Neumann et al. 1999). In fact, note that Ers as well as drive pressure (peak airway pressure – PEEP) decreases with PEEP suggesting PEEP-induced lung recruitment. Additionally, note that %E2 suggests a minimal occurrence of tidal recruitment (recruitment of collapsed areas during inspiration with some derecruitment at the end of expiration).
Fig. 4.
Measured airway pressure (Paw, bold line) and its estimation (gray line) by the volume-dependent single-compartment model in the same patient depicted in Fig. 3. A single breath is presented at three different levels of positive end-expiratory pressure (PEEP): 2 (a), 5 (b), and 10 cmH2O (c). Note that the negative value of the volume-dependent term related to the total respiratory system elastance (%E2) suggests a minimal tidal recruitment. Additionally, Ers and driving pressure (peak airway pressure – PEEP) decrease with PEEP also suggesting PEEP-induced lung recruitment
Influence of inertance on the single-compartment model
The inclusion of the inertance parameter in the single-compartment model usually results in negligible effects in adults under spontaneous ventilation. However, in infants and/or in mechanically ventilated subjects the presence of the endotracheal tube may elicit an important dependence of the pressure on the acceleration of gas. Additionally, when patients are under high-frequency ventilation inertance becomes an important component of the total respiratory system impedance. Sullivan et al. (1976) reported that neglecting the inertial and flow-dependent parameters markedly increased the errors in the estimation of respiratory system resistance and elastance. In endotracheal tubes, the inertance is considerably larger when compared to the respiratory system inertance and can be calculated as:
| 13 |
where l is the mass density, L is the tube length, and r is the radius of the tube. Accordingly, a reduction in the inner diameter of the endotracheal tube will substantially increase the inertance contribution.
Lanteri et al. (1999) reported that the inclusion of the inertive parameter in the linear single-compartment model significantly improved model fitting at respiratory frequencies higher than 30 breaths per min (0.5 Hz). The negligence of inertance led to underestimation of Ers and EL with no effects on estimated Rrs. At frequencies around 120 breaths per min (2 Hz), the error in estimated EL by neglecting inertance ranged from 10 to 40%.
More recently, a work from Jandre et al. (2008) suggested the inclusion of the inertance in the volume-dependent elastance model in order to minimize the bias in the identification of tidal overdistension induced by the endotracheal tube mechanical properties.
Bicompartment models
The single-compartment linear model has proven very useful for describing the mechanical behavior of the respiratory system. Additionally, the inclusion of flow and volume dependencies better improved model-fitting capability. However, it is well known that a model with just a single compartment seems too simplistic even for representing the mechanical properties of healthy lungs.
The linear single-compartment model (Eq. 8) can be also described as an ordinary differential equation. Since flow is the first derivative of volume, Eq. 8 can be rewritten as
| 14 |
and even as
| 15 |
and Eq. 15 can be rearranged as:
| 16 |
This ordinary differential equation follows the general solution:
| 17 |
where
For t = 0,
| 18 |
where
Thus, Eq. 17 can be rewritten as
| 19 |
Thus, according to the single-compartment model, a single exponential can describe the passive exhalation. However, with a simple analysis of the passive expiration, it is possible to verify the evidence of multicompartments in the lung. Additionally, it is well known that Ers increases with respiratory frequency, a phenomenon known as frequency dependence of compliance (Otis et al. 1956). Thus, since the single exponential is not able to adequately represent respiratory system mechanical behavior, several authors have proposed the use of bi- or even multicompartment models that predict both the biexponential pattern of passive exhalation and the frequency dependence of compliance. In the following sections, we will present some of the most commonly used bicompartmental models.
The parallel model
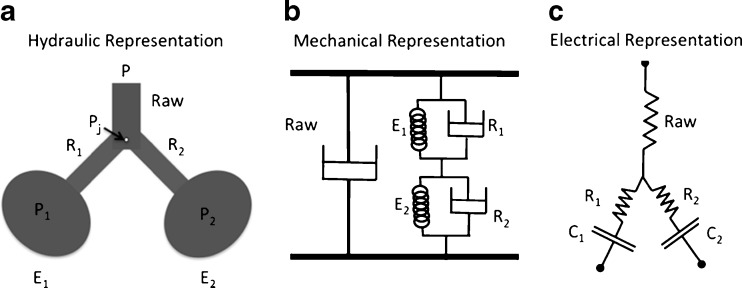
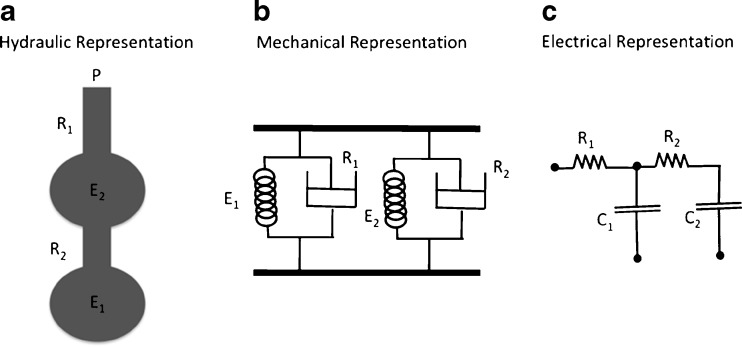
In Fig. 5 we can see the hydraulic (Fig. 5a) as well as the mechanical and electrical analogs (Fig. 5b and c, respectively) of the parallel model. This model consists of a parallel arrangement of two balloons (Fig. 5a), each with its own local airway connected to a common airway (Otis et al. 1956) and introduced to physiology the notion of ventilatory heterogeneity and its effects on lung mechanics.
Fig. 5.
Schematic representation of respiratory system considering the parallel bicompartment model. The hydraulic, mechanical, and electrical equivalents are presented (a, b, c, respectively). This model consists of a parallel arrangement of two balloons (a), each with its own local airway connected to a common airway (Otis et al. 1956). The impedance analogy was applied for the development of each equivalent model. R, C, P, Pj, and Raw correspond to resistance or resistor, compliance or capacitor, pressure, pressure at the bifurcation of the airways, and airway resistance, respectively. 1 and 2 refer to the different compartments
The equations that describe the relationships between pressures, flows, and volumes in each component can be written by first taking each compartment’s elastic pressure (P1 and P2) as
| 20 |
and
| 21 |
The resistive pressure drop along the airways can be written taking Pj as the pressure at the bifurcation between central and peripheral airways:
| 22 |
and
| 23 |
The equation of the central airway is:
| 24 |
Substituting P1(t) and P2(t) of Eqs. 20 and 21 into Eqs. 22 and 23 and thus substituting Pj(t) of Eqs. 22 and 23 into Eq. 24, two pairs of first-order ordinary differential equations are obtained:
| 25 |
and
| 26 |
Differentiating Eqs. 25 and 26 with respect to time we obtain:
| 27 |
and
| 28 |
Substituting
| 29 |
From Eq 25:
| 30 |
Substituting
| 31 |
Note that the equation of the second compartment will be exactly the same as Eq. 31 except for the replacement of subscript 1 with 2. Since V(t) = V1(t) + V2(t), the equation of the entire model can be written as:
| 32 |
During passive exhalation, since Paw = 0, Eq. 32 becomes:
| 33 |
The solution to Eq. 33 is the double-exponential:
| 34 |
Note that this model, as expected, allows the representation of a biexponential decay of volume as a function of time during the passive exhalation, thus yielding the representation of ventilatory heterogeneity. Although mathematically plausible, this model is often quite difficult to implement in practice. The main drawback lies in the difficulty of dealing with so many parameters in terms of physiological interpretation. Additionally, negative values and a large variability in estimated parameters are frequently observed in the experimental scenario (Ganzert et al. 2009).
The series model
Alternatively, two compartments can be arranged in series (Mead 1969), in order to represent the distal parenchyma and the proximal airways (Fig. 6). Since there is no junction pressure involved, the equations of the series model are easily derived as:
| 35 |
for the first compartment, and
| 36 |
for the second compartment, which leads to:
| 37 |
Fig. 6.
Schematic representation of respiratory system by the series bicompartment model (Mead 1969). The hydraulic, mechanical, and electrical analogs are presented (a, b, c, respectively). The impedance analogy was applied for the development of each equivalent model. R, C, and P correspond to resistance or resistor, compliance or capacitor, and pressure, respectively. 1 and 2 refer to the different compartments
Note that Eq. 37 is not symmetric in relation to indices 1 and 2, but presents the same form as Eq. 32.
The viscoelastic model
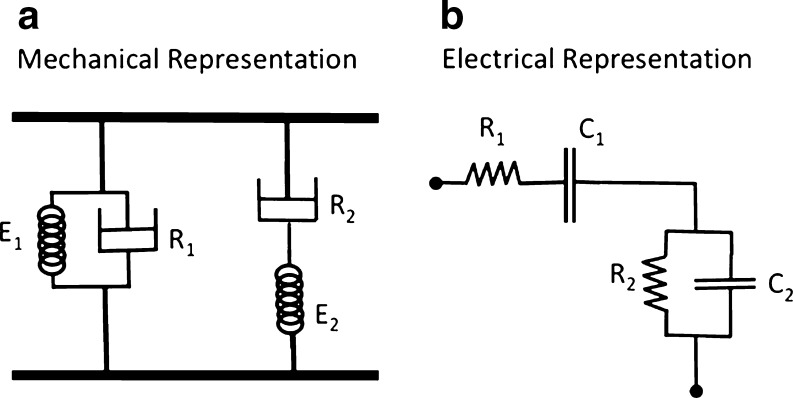
The mechanical and electrical representations of the viscoelastic model are depicted in Fig. 7a. Note that this model is equivalent to the single-compartment model with the addition of a spring in series with a dashpot (known as a Maxwell body). The dashpot R1 is analogous to the resistor R1 in the electrical circuit (Fig. 7b) and represents total airway resistance (Raw), whereas the dashpot R2, analogous to the resistor R2 in the electric representation, stands for tissue resistance (Rt). The elements R2, E1, and E2 constitute the Kelvin body and together represent overall tissue mechanical properties. The element E1 represents the static elastic behavior of the lung, while R2 and E2 account for its viscoelastic behavior.
Fig. 7.
Schematic representation of the respiratory system by the viscoelastic bicompartment model. The mechanical (a) and electrical (b) representations are depicted. Note that this model is equivalent to the single-compartment model with the addition of a spring in series with a dashpot (known as a Maxwell body). R and C correspond to resistance or resistor, and compliance or capacitor, respectively. 1 and 2 refer to the different compartments
An alternative representation to the viscoelastic model is provided in Fig. 8. In this cartoon, the hydraulic (pipe-balloon series association) is presented together with the electrical equivalent. In this representation, the association between each element and its physiological interpretation seems more intuitive.
Fig. 8.
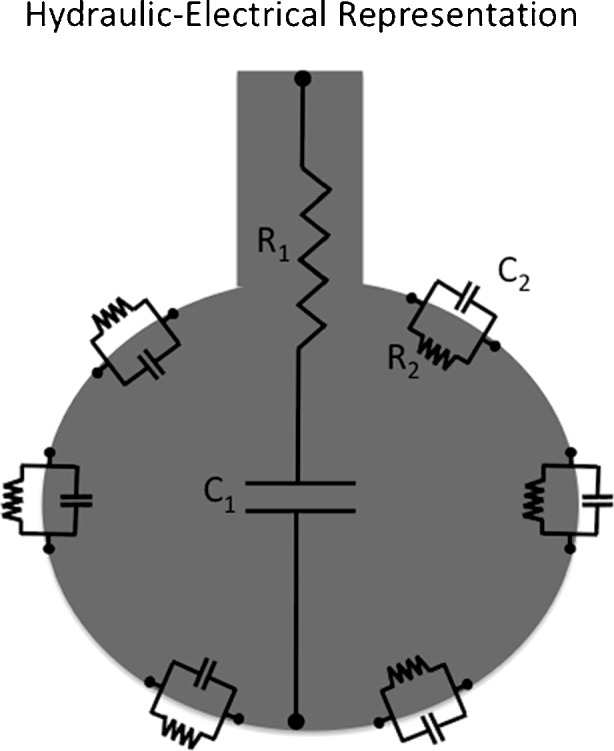
Alternative representation of the viscoelastic bicompartment model considering the combination of the hydraulic and electrical equivalents. In this cartoon, the components R2 and E2 are depicted in the alveolar tissue thus allowing a more intuitive physiological interpretation of the model. R and C correspond to resistance or resistor, and compliance or capacitor, respectively. 1 and 2 refer to the different compartments
The constitutive equation of this model can be obtained with the same procedure as in the parallel model, by taking the equations of each physical compartment as:
| 38 |
and
| 39 |
The complete equation of motion of the viscoelastic model is:
| 40 |
Note that Eqs. 41, 37, and 32 are quite similar and can be rewritten:
| 41 |
where A1 to A4 are constants that represent the equivalent impedance component depending on each variable P, V, and
Input impedance models: frequency domain analysis
System impedance characterizes how forces oppose movement. Respiratory system impedance comes from resistive, elastic, inertive, and other forces that oppose the movement throughout inspiration and expiration.
For the analysis of the respiratory system impedance in the frequency domain, we must translate all aforementioned equations (in the time domain) to the frequency domain. For such purposes, we must use the Fourier identity for the time derivatives of P(t) and V(t) with the following identities:
| 42 |
and
| 43 |
where ω is the angular frequency
The theories of system identification can be conveniently applied to the study of the respiratory system impedance by the forced oscillation technique (FOT). The first FOT description was done by DuBois in 1956. In this technique, an external device (usually an adapted loudspeaker) applies sinusoidal oscillations over a range frequency in airway pressures and the resulting oscillations in airflow allow the determination of the respiratory system impedance. The Fourier transforms of P(t) and V(t) in their constitutive sinusoidal components and the respiratory system impedance are determined as:
| 44 |
where Z(ω) is the impedance as a function of angular frequency, and F{P(t)} and
| 45 |
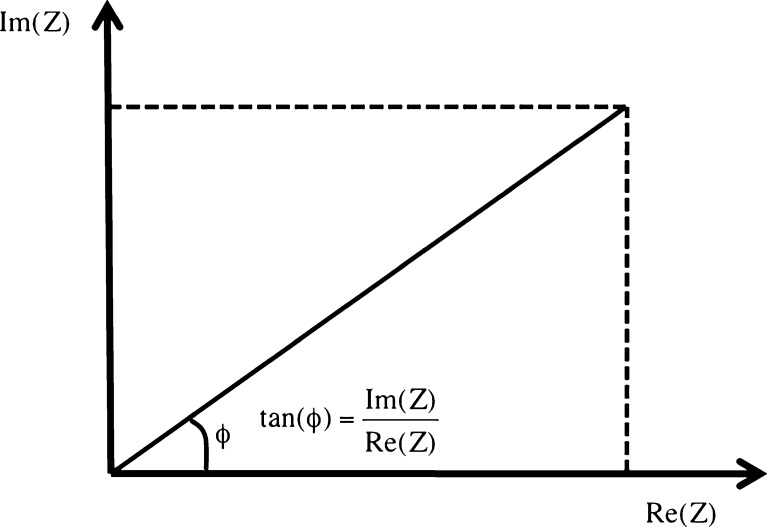
and assuming that P is the reference signal, φ represents the phase difference between P and
| 46 |
and the phase difference equals:
| 47 |
Fig. 9.
Geometric relation between reactance, or the imaginary component of the impedance [Im(Z)], and resistance, or the real component of the impedance [Re(Z)]. Note that the phase difference (φ) can be calculated as
Equation of motion in the frequency domain
Considering the equation of motion of the single-compartment model:
| 48 |
and applying the Fourier identity as in Eq. 43, the Fourier transform of Eq. 48 will be:
| 49 |
The impute impedance of the single-compartment model is:
| 50 |
Note that Im(Z) is a negative hyperbolic function of ω, whereas Re(Z) is constant.
The inclusion of inertance (Irs) in the single-compartment model results in
| 51 |
and in an input impedance
| 52 |
At a determined angular frequency (resonant frequency), reactance is zero because E/ω and ωI area are identical and impedance equals resistance. The resonant frequency (ωres) is:
| 53 |
and usually ranges from 8 to 12 Hz in healthy young subjects, increasing with age and lung disease (Pride 1992; Chalker et al. 1992).
Constant phase model of impedance
The so-called constant phase model represents an alternative to the tendency to oversimplify complex systems in ordinary differential equations where compartments are treated separately and a limited number of free parameters are used to describe overall mechanical properties. Interestingly, the real part of tissue impedance bears an almost fixed relationship with the imaginary part over a broad range of frequencies (Fredberg and Stamenovic 1989). The hysteresivity (η) is defined as:
| 54 |
Thus, it dos not seem possible to independently manipulate the resistance and elastance of lung tissue since one is affected by the other. This phenomenon stands against the use of a lumped-parameter model and suggests that structures in tissue that elastically store energy are indeed coupled to those that dissipate it (Fredberg and Stamenovic 1989).
The constant phase model (Hantos et al. 1987a, b) of impedance is a different approach to interpret tissue mechanical properties since it comprises several parameters in just two free parameters that characterize the overall mechanical behavior of lung tissue. Applying the Fourier transform of the power law of the lung pressure resulting from a step change in volume, we can write according to standard tables that:
| 55 |
by taking
| 56 |
Eq. 55 can be rewritten as:
| 57 |
Interestingly, a constant phase angle of 90° exists between the real (G) and imaginary (H) components of the impedance [Z(ω)], thus justifying the term constant phase model (Hantos et al. 1987a, b). Note that in this model φ = tan−1H/G, and thus:
| 58 |
Hence, the input impedance of the constant phase model of the normal lung is:
| 59 |
where RN is the conventional Newtonian resistance that dissipates energy in phase with flow and I is the inertive component of the conduit as represented in Fig. 8. The parameters G and H can be interpreted in terms of energy (dissipation and storage, respectively), and hysteresivity can be also defined as the ratio of dissipation to storage by cycle or G/H.
Considering lung compartments alone (for instance in an experiment with open chest), the parameter RN represents the total airway resistance, and the term I represents the inertance of the gas in airways. Together, these parameters account for the overall impedance of the central airways (Hantos et al. 1987a, b; Petak et al. 1993). The parameter G, often denominated tissue damping, represents the dissipative component of tissue impedance and is therefore related to the component Rt of the viscoelastic model (Eq. 39). However, G does not have a dimension of resistance and thus, cannot be considered like one. The same occurs with the term H, which can be associated with tissue elastance but does not present the same units as elastance (Petak et al. 1993).
One advantage of the constant phase model stems from the fact that it can separate, with just four free parameters, the impedance of the normal lung into a component due to the airways (RN and I) and a component due to the tissues (G and H). Thus, in the case of bronchoconstriction, we can expect an increase in RN and I due to the airway narrowing. The parameters G and H presented several possibilities to be interpreted. A proportional increase in G and H may occur as a result of airway closure or alveolar collapse. In this case, η remains almost unchanged. However, in the case of lung heterogeneity, G tends to increase substantially compared to H (Wagers et al. 2004).
Choosing the appropriate model
Naturally, the choice of the model to be used will depend upon the intended physiological or pathophysiological goal. In other words, the most adequate model is that one whose elements closely reproduce the actual system under study (Lorino et al. 1994; Rotger et al. 1995). Thus, it is virtually impossible to use a “perfect” model. However, the use of simple models that satisfactorily represent the general mechanical behavior of the respiratory system and its lung and chest wall components is of paramount importance to the respirologist.
The models are to be chosen according to the scientific questioning, techniques, and methods to be used, and, of course, the experimental condition. Furthermore, the ease of gathering the parameters of a given model should never thwart the quest for the most appropriate physiological interpretation of the data.
Acknowledgments
The authors acknowledge the financial support of the Brazilian Council for Scientific and Technological Development (CNPq) and Carlos Chagas Filho Rio de Janeiro State Research Supporting Foundation (FAPERJ).
Competing interests
The authors declare that they have no competing interests.
References
- Agostoni E, Hyatt RE (1986) Static behavior of the respiratory system. In: Macklem PT, Mead J (eds) Handbook of physiology: section 3: the respiratory system, vol. III, parts 1 and 2: the mechanics of breathing. American Physiology Society, Bethesda, pp 113–130
- Auler JO, Jr, Zin WA, Caldeira MP, Cardoso WV, Saldiva PH. Pre- and postoperative inspiratory mechanics in ischemic and valvular heart disease. Chest. 1987;92:984–990. doi: 10.1378/chest.92.6.984. [DOI] [PubMed] [Google Scholar]
- Auler JOC, Jr, Saldiva PHN, Carvalho CR, Negri EM, Hoelz C, Zin WA. Flow and volume dependence of respiratory system mechanics during constant flow ventilation in normal subjects and in adult respiratory distress syndrome. Crit Care Med. 1990;18:1080–1086. doi: 10.1097/00003246-199010000-00006. [DOI] [PubMed] [Google Scholar]
- Bachofen H. Lung tissue resistance and pulmonary hysteresis. J Appl Physiol. 1968;24:296–301. doi: 10.1152/jappl.1968.24.3.296. [DOI] [PubMed] [Google Scholar]
- Bates JH, Decramer M, Chartrand D, Zin WA, Boddener A, Milic-Emili J. Volume-time profile during relaxed expiration in the normal dog. J Appl Physiol. 1985;59:732–737. doi: 10.1152/jappl.1985.59.3.732. [DOI] [PubMed] [Google Scholar]
- Bates JH, Rossi A, Milic-Emili J. Analysis of the behavior of the respiratory system with constant inspiratory flow. J Appl Physiol. 1985;58:1840–1848. doi: 10.1152/jappl.1985.58.6.1840. [DOI] [PubMed] [Google Scholar]
- Bates JHT, Ludwig MS, Sly PD, Brown K, Martin JG, Fredberg JJ. Interrupter resistance elucidated by alveolar pressure measurement in open-chest normal dogs. J Appl Physiol. 1988;65:408–414. doi: 10.1152/jappl.1988.65.1.408. [DOI] [PubMed] [Google Scholar]
- Bersten AD. Measurement of overinflation by multiple linear regression analysis in patients with acute lung injury. Eur Respir J. 1998;12:526–532. doi: 10.1183/09031936.98.12030526. [DOI] [PubMed] [Google Scholar]
- Carvalho AR, Spieth PM, Pelosi P, Vidal Melo MF, Koch T, Jandre FC, Giannella-Neto A, de Abreu MG. Ability of dynamic airway pressure curve profile and elastance for positive end-expiratory pressure titration. Intensive Care Med. 2008;34:2291–2299. doi: 10.1007/s00134-008-1301-7. [DOI] [PMC free article] [PubMed] [Google Scholar]
- Chalker RB, Celli BR, Habib RH, Jackson AC. Respiratory input impedance from 4 to 256 Hz in normals and chronic airflow obstruction: comparisons and correlations with spirometry. Am Rev Respir Dis. 1992;146:570–576. doi: 10.1164/ajrccm/146.3.570. [DOI] [PubMed] [Google Scholar]
- D’Angelo E, Robatto FM, Calderini E, Tavola M, Bono D, Torri G, Milic-Emili J. Pulmonary and chest wall mechanics in anesthetized paralyzed humans. J Appl Physiol. 1991;70:2602–2610. doi: 10.1152/jappl.1991.70.6.2602. [DOI] [PubMed] [Google Scholar]
- D’Angelo E, Prandi E, Tavola M, Calderini E, Milic-Emili J. Chest wall interrupter resistance in anesthetized paralyzed humans. J Appl Physiol. 1994;77:883–887. doi: 10.1152/jappl.1994.77.2.883. [DOI] [PubMed] [Google Scholar]
- Duggan M, Kavanagh BP. Pulmonary atelectasis: a pathogenic perioperative entity. Anesthesiology. 2005;102:838–854. doi: 10.1097/00000542-200504000-00021. [DOI] [PubMed] [Google Scholar]
- Fredberg JJ, Stamenovic D. On the imperfect elasticity of lung tissue. J Appl Physiol. 1989;67:2408–2419. doi: 10.1152/jappl.1989.67.6.2408. [DOI] [PubMed] [Google Scholar]
- Ganzert S, Moller K, Steinmann D, Schumann S, Guttmann J. Pressure-dependent stress relaxation in acute respiratory distress syndrome and healthy lungs: an investigation based on a viscoelastic model. Crit Care. 2009;13:R199. doi: 10.1186/cc8203. [DOI] [PMC free article] [PubMed] [Google Scholar]
- Hantos Z, Suki B, Csendes T, Daroczy B. Constant-phase modelling of pulmonary tissue impedance. Bull Eur Physiopathol Respir. 1987;23:326s. [Google Scholar]
- Hantos Z, Daroczy B, Suki B, Nagy S, Debreczeni LA. Respiratory mechanical impedance in the rat. Acta Physiol Hung. 1987;70:289–296. [PubMed] [Google Scholar]
- Hildebrandt J. Dynamic properties of air-filled excised cat lung determined by liquid plethsmograph. J Appl Physiol. 1969;27:246–250. doi: 10.1152/jappl.1969.27.2.246. [DOI] [PubMed] [Google Scholar]
- Hildebrandt J. Pressure-volume data of cat lung interpreted by a plastoelastic, linear viscoelastic model. J Appl Physiol. 1970;28:365–372. doi: 10.1152/jappl.1970.28.3.365. [DOI] [PubMed] [Google Scholar]
- Hoppin FG Jr, Stothert JC Jr, Greaves IA, Lai YL, Hildebrandt J (1986) Lung recoil: elastic and rheological properties. In: Macklem PT, Mead J (eds) Handbook of physiology: section 3: the respiratory system, vol. III, parts 1 and 2: the mechanics of breathing. American Physiology Society, Bethesda, pp 195–215
- Ingram RH, Pedley TJ (1986) Pressure flow relationships in the lungs. In: Macklem PT, Mead J (eds) Handbook of physiology: section 3: the respiratory system, vol. III, parts 1 and 2: the mechanics of breathing. American Physiology Society, Bethesda, 277–293
- Jandre FC, Modesto FC, Carvalho AR, Giannella-Neto A. The endotracheal tube biases the estimates of pulmonary recruitment and overdistension. Med Biol Eng Comput. 2008;46:69–73. doi: 10.1007/s11517-007-0227-5. [DOI] [PubMed] [Google Scholar]
- Kano S, Lanteri CJ, Duncan AW, Sly PD. Influence of nonlinearities on estimates of respiratory mechanics using multilinear regression analysis. J Appl Physiol. 1994;77:1185–1197. doi: 10.1152/jappl.1994.77.3.1185. [DOI] [PubMed] [Google Scholar]
- Kochi T, Okubo S, Zin WA, Milic-Emili J. Flow and volume dependence of pulmonary mechanics in anesthetized cats. J Appl Physiol. 1988;64:441–450. doi: 10.1152/jappl.1988.64.1.441. [DOI] [PubMed] [Google Scholar]
- Kochi T, Okubo S, Zin WA, Milic-Emili J. Chest wall and respiratory system mechanics in cats: effects of flow and volume. J Appl Physiol. 1988;64:2636–2646. doi: 10.1152/jappl.1988.64.6.2636. [DOI] [PubMed] [Google Scholar]
- Lanteri CJ, Petak F, Gurrin L, Sly PD. Influence of inertance on respiratory mechanics measurements in mechanically ventilated puppies. Pediatr Pulmonol. 1999;28:130–138. doi: 10.1002/(SICI)1099-0496(199908)28:2<130::AID-PPUL9>3.0.CO;2-X. [DOI] [PubMed] [Google Scholar]
- Lorino AM, Lorino H, Harf A. A synthesis of the Otis, Mead, and Mount mechanical respiratory models. Respir Physiol. 1994;97:123–133. doi: 10.1016/0034-5687(94)90020-5. [DOI] [PubMed] [Google Scholar]
- Ludwig MS, Dreshaj I, Solway J, Munoz A, Ingram RH., Jr Partitioning of pulmonary resistance during constriction in the dog: effects of volume history. J Appl Physiol. 1987;62:807–815. doi: 10.1152/jappl.1987.62.2.807. [DOI] [PubMed] [Google Scholar]
- Macklem PT. The mechanics of breathing. Am J Respir Crit Care Med. 1998;157:S88–S94. doi: 10.1164/ajrccm.157.4.nhlbi-5. [DOI] [PubMed] [Google Scholar]
- Mead J. Contribution of compliance of airways to frequency-dependent behavior of lungs. J Appl Physiol. 1969;26:670–673. doi: 10.1152/jappl.1969.26.5.670. [DOI] [PubMed] [Google Scholar]
- Mergoni M, Martelli A, Volpi A, Primavera S, Zuccoli P, Rossi A. Impact of positive end-expiratory pressure on chest wall and lung pressure-volume curve in acute respiratory failure. Am J Respir Crit Care Med. 1997;156:846–854. doi: 10.1164/ajrccm.156.3.9607040. [DOI] [PubMed] [Google Scholar]
- Neumann P, Rothen HU, Berglund JE, Valtysson J, Magnusson A, Hedenstierna G. Positive end-expiratory pressure prevents atelectasis during general anaesthesia even in the presence of a high inspired oxygen concentration. Acta Anaesthesiol Scand. 1999;43:295–301. doi: 10.1034/j.1399-6576.1999.430309.x. [DOI] [PubMed] [Google Scholar]
- Otis AB, McKerrow CB, Bartlett RA, Mead J, Mcllroy MB, Selverstone NJ, Radford FP., Jr Mechanical factors in distribution of pulmonary ventilation. J Appl Physiol. 1956;8:427–443. doi: 10.1152/jappl.1956.8.4.427. [DOI] [PubMed] [Google Scholar]
- Pedley TJ , Drazen JM (1986) Aerodynamic theory. In: Macklem PT, Mead J (eds) Handbook of physiology: section 3: the respiratory system, vol. III, parts 1 and 2: the mechanics of breathing. American Physiology Society, Bethesda, pp 41–54
- Pedley TJ, Schroter RC, Sudlow MF. The prediction of pressure drop and variation of resistance within the human bronchial airways. Respir Physiol. 1970;9:387–405. doi: 10.1016/0034-5687(70)90094-0. [DOI] [PubMed] [Google Scholar]
- Petak F, Hantos Z, Adamicza A, Daroczy B. Partitioning of pulmonary impedance: modeling vs. alveolar capsule approach. J Appl Physiol. 1993;75:513–521. doi: 10.1152/jappl.1993.75.2.513. [DOI] [PubMed] [Google Scholar]
- Pride NB. Forced oscillation techniques for measuring mechanical properties of the respiratory system. Thorax. 1992;47:317–320. doi: 10.1136/thx.47.4.317. [DOI] [PMC free article] [PubMed] [Google Scholar]
- Rahn H, Otis AB, Chadwick LE, Fenn O. The pressure-volume diagram of the thorax and lung. Am J Physiol. 1946;146:161–178. doi: 10.1152/ajplegacy.1946.146.2.161. [DOI] [PubMed] [Google Scholar]
- Rodarte, Rehder K (1986) Dynamics of respiration. In: Macklem PT, Mead J (eds) Handbook of physiology: section 3: the respiratory system, vol. III, parts 1 and 2: the mechanics of breathing. American Physiology Society, Bethesda, 131–144
- Rohrer F. Der Stromungswiderstand der unregelmassigen Verzweigung des Bronchialsystems auf den Atmungsverlauf in verschiedenen Lungenbezirken. Pfluegers Arch. 1915;162:225–299. doi: 10.1007/BF01681259. [DOI] [Google Scholar]
- Rotger M, Peslin R, Navajas D, Farre R. Lung and respiratory impedance at low frequency during mechanical ventilation in rabbits. J Appl Physiol. 1995;78:2153–2160. doi: 10.1152/jappl.1995.78.6.2153. [DOI] [PubMed] [Google Scholar]
- Saldiva PH, Zin WA, Santos RL, Eidelman DH, Milic-Emili J. Alveolar pressure measurement in open-chest rats. J Appl Physiol. 1992;72:302–306. doi: 10.1152/jappl.1992.72.1.302. [DOI] [PubMed] [Google Scholar]
- Sharp J, Henry J, Sweany S, Meadows W, Pietras R. Total respiratory inertance and its gas and tissue components in normal and obese men. J Clin Invest. 1964;43:503–509. doi: 10.1172/JCI104936. [DOI] [PMC free article] [PubMed] [Google Scholar]
- Similowski T, Levy P, Corbeil C, Albala M, Pariente R, Derenne JP, Bates JH, Johnson B, Milic-Emili J. Viscoelastic behavior of lung and chest wall in dogs determined by flow interruption. J Appl Physiol. 1989;67:2219–2229. doi: 10.1152/jappl.1989.67.6.2219. [DOI] [PubMed] [Google Scholar]
- Sullivan M, Paliotta J, Saklad M. Endotracheal tube as a factor in measurement of respiratory mechanics. J Appl Physiol. 1976;41:590–592. doi: 10.1152/jappl.1976.41.4.590. [DOI] [PubMed] [Google Scholar]
- Terragni PP, Rosboch GL, Lisi A, Viale AG, Ranieri VM. How respiratory system mechanics may help in minimising ventilator-induced lung injury in ARDS patients. Eur Respir J. 2003;22:15S–21S. doi: 10.1183/09031936.03.00420303. [DOI] [PubMed] [Google Scholar]
- Wagers S, Lundblad LK, Ekman M, Irvin CG, Bates JH. The allergic mouse model of asthma: normal smooth muscle in an abnormal lung? J Appl Physiol. 2004;96:2019–2027. doi: 10.1152/japplphysiol.00924.2003. [DOI] [PubMed] [Google Scholar]


