

Summary
T cells play a key role in the pathogenesis of type 1 diabetes, and targeting the CD3 component of the T‐cell receptor complex provides one therapeutic approach. Anti‐CD3 treatment can reverse overt disease in spontaneously diabetic non‐obese diabetic mice, an effect proposed to, at least in part, be caused by a selective depletion of pathogenic cells. We have used a transfer model to further investigate the effects of anti‐CD3 treatment on green fluorescent protein (GFP)+ islet‐specific effector T cells in vivo. The GFP expression allowed us to isolate the known effectors at different time‐points during treatment to assess cell presence in various organs as well as gene expression and cytokine production. We find, in this model, that anti‐CD3 treatment does not preferentially deplete the transferred effector cells, but instead inhibits their metabolic function and their production of interferon‐γ. Programmed cell death protein 1 (PD‐1) expression was up‐regulated on the effector cells from anti‐CD3‐treated mice, and diabetes induced through anti‐PD‐L1 antibody could only be reversed with anti‐CD3 antibody if the anti‐CD3 treatment lasted beyond the point when the anti‐PD‐L1 antibody was washed out of the system. This suggests that PD‐1/PD‐L1 interaction plays an important role in the anti‐CD3 antibody mediated protection. Our data demonstrate an additional mechanism by which anti‐CD3 therapy can reverse diabetogenesis.
Keywords: diabetes, transgenic/knockout mouse, tolerance/suppression/anergy, antibodies
Abbreviations
- BMDC
bone‐marrow‐derived dendritic cell
- GFP
green fluorescent protein
- GSEA
gene set enrichment analysis (
- HbA1c
glycosylated haemoglobin
- IFN‐γ
interferon‐γ
- IL‐2
interleukin‐2
- NOD
non‐obese diabetic
- PD‐1
programmed cell death protein 1
- PI3K
phosphoinositide 3‐kinase
- TCR
T‐cell receptor
- TGF
transforming growth factor
- Th1
T helper 1 subset
- Treg
regulatory T
Introduction
Anti‐CD3 treatment was identified over 20 years ago as a promising candidate for treatment of type 1 diabetes, when Chatenoud et al. showed that injection of an anti‐CD3 antibody could reverse disease in overtly diabetic non‐obese diabetic (NOD) mice.1 Since then, clinical trials have attempted to achieve the same results using non‐activating humanized monoclonal anti‐CD3 such as teplizumab2, 3 and otelixizumab.4, 5 Although some have reported prolonged periods of endogenous insulin production and lower insulin injection dose requirements,5, 6, 7 these trials have not succeeded in reversing diabetes long term.8 Continued study of all possible tolerogenic mechanisms that can be harnessed by anti‐CD3 therapy is essential for establishing how this treatment could be used to its full potential. Treatment with anti‐CD3 results in reversal of established diabetes in NOD mice1 through a combination of early and long‐lasting mechanisms. CD3‐specific antibodies can induce anergy in T cells through incomplete activation providing signalling through the T‐cell receptor (TCR) complex without accompanying co‐stimulation,9, 10 and can also induce T‐cell apoptosis.9, 10 Although anti‐CD3 treatment reduces T‐cell numbers, the regulatory Foxp3+ T‐cell (Treg cell) compartment remains undiminished, leading to an increase in the proportion of Treg cells present in blood and secondary lymphoid tissues.11, 12 A compelling suggestion is that anti‐CD3 treatment primarily depletes activated T cells,13 which has been supported by studies using ovalbumin‐specific cells.11, 14
In this study, we have used green fluorescent protein (GFP)‐labelled T helper type 1 (Th1) differentiated islet‐specific effector cells15, 16 to study in detail the effects of anti‐CD3 treatment on effector T cells with an Fc‐mutated (aglycosylated) mouse equivalent of otelixizumab. We observed, in this model, that anti‐CD3 treatment did not preferentially deplete these cells, but rather suppressed their capacity to produce interferon‐γ (IFN‐γ) in response to stimulation and increased their cell surface expression of programmed cell death protein 1 (PD‐1). Gene set analysis of microarray data demonstrated fundamental changes in the anti‐CD3‐treated isolated effector cells compared with control antibody‐treated, indicating the down‐regulation of genes associated with glycolysis, activation and co‐stimulation. This finding offers a further mechanism to explain the therapeutic benefits of anti‐CD3 treatment in establishing a tolerogenic milieu.
Materials and methods
Mice and diabetes detection
Female NOD mice, NOD‐scid mice, BDC2.5 NOD mice15, NOD‐CD2‐GFP mice,17 BDC2·5 × NOD‐CD2‐GFP F1 mice and NOD‐Foxp3‐GFP mice18 were bred in the Department of Pathology, University of Cambridge and maintained under specific pathogen‐free conditions. The mice are housed in individually ventilated cages with free access to standard chow and water. Diabetes was detected using Diastix reagent strips (Bayer Diagnostics, Basingstoke, UK) and confirmed by a blood glucose measurement of > 13·3 mm, using a Breeze2 blood glucose meter (Bayer). This study was carried out in strict accordance with UK Home Office project licence regulations (Project Licence number 80/2442 and 70/8442) after approval by the Ethical Review Committee of the University of Cambridge.
Antibody treatment
Aglycosyl anti‐CD3 antibody
The non‐Fc receptor‐binding anti‐mouse CD3 antibody (agly‐anti‐CD3) was generated through genetic engineering in the Waldmann Laboratory, University of Oxford. It consists of the antigen‐binding variable domain of the anti‐mouse CD3 KT3 clone fused to mutated (non‐FcR binding) human IgG1 heavy and κ light chains. Chimeric KT3‐1.1 aglycosyl IgG1 antibody mRNA was prepared from the cells of the hybridoma KT3‐1.1 and cDNA was prepared by anchor‐tailed PCR. Splicing by overlap extension PCR was then carried out for the light chain using primers (1) MR1KT3 5′‐TGTGACCCTGCTGCTCTGGGTGTCTGGTGCCTGTGCAGACATCCAGATGACCCAGTCTCC and (2) KT3VL‐CK 3′‐TGCAGCCACAGTCCGTCTCAATTCCACCTTGG TGCCTCC for VL and primers (3) KT3VL‐CK 5′‐GAAT TGAGACGGACTGTGGCTGCACCATCTGTCTTCATC and (4) huCKH111 3′‐TGAGCCAAGCTTTCAACACTCT CCCCTGTTGAAGCTCTT for Ck. Primers 1 and 4 were then used to assemble light‐chain constructs. Splicing by overlap extension PCR was also carried out for the heavy chain using primers (5) KT3VhH111 5′‐TCTAGTAAGCTTGCCGCCACCATGGACTTCAGGCTCAGCCT GGCTTTC and (6) KT3CH1 3′‐TTGCTGGAGGCTGAGGAGACTGCGACCATGACTCCTTGG for VH and primers (7) KT3CH1 5′‐CGCAGTCTCCTCAGCCTCCACCA AGGGCCCATCGGTCTT and (8) huCH3ER1 3′‐TAGATCGAATTCGGGGCCGTCGCACTCATTTACCCGGAGACAGGG for constant region. Primers 5 and 8 were then used to assembly a heavy‐chain aglycosyl IgG1 construct. The amplified light‐chain fragment was cloned into the HindIII site of PEE12 vector (Lonza, Basel, Switzerland) and the heavy chain was cloned into the HindIII and EcoRI sites of PEE12. The resulting plasmids were co‐transfected by electroporation into the cell line NSO and stable transfectants were selected in glutamine‐free Iscove's modified Dulbecco's medium (Invitrogen, Carlsbad, CA). Positive clones were selected by ELISA for binding to anti‐human IgG1 and by FACS for binding to EL4 cells. Antibody was purified by Protein A (GE Healthcare, Chalfont St Giles, UK) and tested for endotoxin. The antibody that recognizes human CD3 (otelixizumab) was used as a non‐binding isotype control.
Anti‐PD‐L1 antibody
Anti‐mouse programmed cell death ligand 1 (PD‐L1) antibody (clone MIH5, grown in‐house) was administered intraperitoneally once at a dose of 2 mg.
Th1 differentiation for in vitro studies and adoptive transfer
CD4+ CD62Lhi CD25− B220− T cells were isolated by cell sorter (MoFlo; Beckman Coulter, Brea, CA) from 5‐week‐old BDC2.5 TCR transgenic NOD mice and differentiated into Th1 cells by culturing them in Iscove's modified Dulbecco's medium (Gibco, Grand Island, NY) supplemented with 10% fetal calf serum, 50 μm β‐mercaptoethanol, l‐glutamine (2 mm) and 50 U/ml penicillin and streptomycin (Gibco) with plate‐bound anti‐CD3 (2 μg/ml, clone 145‐2C11, grown in‐house), soluble anti‐CD28 (10 μg/ml; BD Pharmingen, Franklin Lakes, NJ) and interleukin‐2 (IL‐2; 100 U/ml), IL‐12 (10 ng/ml) and interferon‐γ (IFN‐γ; 100 U/ml) (all from Peprotech, Rocky Hill, NJ) for 4 days at 37° with 5% CO2. Afterwards, the production of IFN‐γ was checked by specific ELISA (R&D Systems, Minneapolis, MN) and/or intracellular staining.
Proliferation studies
For determination of in vivo proliferation, BDC2.5 CD4+ T cells were stained with CFSE (5 μm) and injected intravenously into 6‐week‐old NOD mice that had received a Th1 cell transfer 1 week previously and subsequent treatment with agly‐anti‐CD3 or control antibody for 4 days. Seventy‐two hours after injection of the CFSE‐labelled cells the indicated lymph nodes were harvested and the cells were stained for surface markers. For determination of in vitro proliferation, BDC2.5 CD4+ T cells were stained with CFSE (5 μm) and co‐cultured for 72 hr with whole pancreatic lymph nodes from 6‐week‐old NOD mice, which had received a Th1 cell transfer 1 week previously and had subsequently received treatment with agly‐anti‐CD3 or control antibody for 4 days.
Co‐culture with bone‐marrow‐derived dendritic cells
Bone marrow was harvested from the femurs of NOD mice and cultured in 50 ml Dulbecco's modified Eagle's medium supplemented as above plus 10 ng/ml granulocyte–macrophage colony‐stimulating factor (Peprotech) for 10 days. For co‐culture the cells were pulsed with BDC2.5 mimotope RTRPLWVRME (1 µg/ml; Cambridge Peptides, Birmingham, UK) or not. For co‐culture, the BDC2.5 Th1 differentiated cells were pre‐incubated with the indicated concentration of agly‐anti‐CD3 or control antibody for 1 hr at 4° and then washed. Bone‐marrow‐derived dendritic cells (BMDC; 2·5 × 105 cells per well) and Th1 cells (5 × 10⁵ cells per well) were then co‐cultured in 24‐well plates for 48 hr, after which supernatants were collected for cytokine analysis and cells were collected for analysis of CD80 expression.
Supernatant cytokine analysis
Cytokine levels in cell culture supernatants were detected using a cytometric bead array (eBioscience, San Diego, CA) according to the manufacturer's instructions. The R&D Systems ELISA kit for detection of IL‐12 (p40) was used according to the manufacturer's instructions.
Antibodies and flow cytometry
Cell suspensions from lymph nodes and spleen were prepared by dispersion between glass slides. Intestine and pancreas were manually dispersed, and then further digested with collagenase solution (0·5 mg/ml; Sigma, St Louis, MO) as previously described.19 All cell preparations were resuspended in FACS buffer (PBS with 0·5% BSA) and incubated with Fc‐block (eBioscience). Cell death was assessed with 7AAD (BD Bioscience, Franklin Lakes, NJ). Foxp3 was detected using intracellular cytokine staining kit and anti‐Foxp3 from eBioscience. Data were collected on a Cyan Cell Cytometer (DAKO, Santa Clara, CA) and analysed using flowjo (Tree Star Inc., Ashland, OR). For intracellular cytokine staining, the cells were stimulated with PMA (50 ng/ml) and ionomycin (2000 ng/ml) for 5 hr. Brefeldin A (5 μg/ml) was added for the last 3 hr and stained with allophycocyanin‐conjugated anti–IFN‐γ (XMG1.2) or allophycocyanin‐conjugated IgG1 isotype controls (BD Pharmingen). Mitotracker and mitosox assays (both from Thermo Fisher, Waltham, MA) were performed according to the manufacturer's instructions, with incubation for 30 min at 37° (mitotracker) or 10 min at 37° (mitosox).
Immunofluorescence
Pancreata were fixed in 4% paraformaldehyde for 72 hr, dehydrated in sucrose and mounted in OCT. Ten‐micron sections were cut on a Leica cryostat onto Polysine slides (VWR), air‐dried and fixed again for 10 min in acetone. Guinea‐pig‐anti‐insulin antibody (DAKO) was detected with anti‐guinea‐pig Alexa 546 (Molecular Probes, Eugene, OR). Anti‐CD4 (BD) was detected with anti‐rat Alexa 488 (Molecular Probes). GLUT‐1 in cells was detected using ab15309 (Abcam, Cambridge, UK) and Alexa 647 anti‐rabbit (Molecular Probes) after permeabilization with PBS‐Triton‐X. Nuclei were visualized with DAPI (Molecular Probes). The sections were viewed with a confocal microscope (Zeiss, Oberkochen, Germany) and processed using zen software.
Microarray
RNA was assessed for concentration and quality using a SpectroStar (BMG Labtech, Aylesbury, UK) and a Bioanalyser (Agilent Technologies, Cheadle, UK). Microarray experiments were performed at Cambridge Genomic Services, University of Cambridge, using the MouseWG‐6 v2 Expression BeadChip (Illumina, Chesterford, UK) according to the manufacturer's instructions. Briefly, total RNA was amplified using the Ovation Pico WTA v2 kit (NuGEN Technologies, Leek, Netherlands) and subsequently labelled using the BiotinIL kit (NuGEN Technologies) following the manufacturer's instructions. The concentration, purity and integrity of the resulting cRNA were measured using the Nanodrop ND‐1000 (Thermo Scientific, Paisley, UK) and by bioanalyser. Finally, cRNA was hybridized to the MouseWG‐6 v2 BeadChip and scanned using the Bead Array Reader (Illumina).
Raw data were loaded into R using the lumi package from bioconductor20 (http://bioconductor.org) and divided into subsets according to the groups being compared; only the samples involved in a given comparison are used. Subsets were then filtered to remove any non‐expressed probes using the detection P‐value from Illumina. Across all samples, probes for which the intensity values were not statistically significantly different (P > 0·01) from the negative controls were removed from the analysis. The data were transformed using the Variance Stabilization Transformation (VST21) from lumi and then normalized to remove technical variation between arrays using quantile normalization. Comparisons were performed using the limma package22 with results corrected for multiple testing using a False Discovery Rate (FDR) correction. Finally, the quality of the data was assessed along with the correlations between samples within groups.
Gene set enrichment analysis (GSEA) was performed as previously described.23 Molecular signatures (http://www.broad.mit.edu/gsea) interrogated included Hallmark (H), curated (C2) and gene ontology (C5) groups including KEGG, Reactome and Biocarta. Molecular signatures were considered to be significantly associated with treated or untreated groups if they had a nominal P value of <0·001 and a false discovery score of <0·25. We acknowledge our use of the gene set enrichment analysis, GSEA software, and Molecular Signature Database (MSigDB).23 The raw data are available at https://www.repository.cam.ac.uk/handle/1810/254543
Statistical analysis
Differences between groups were tested using Student's t‐test or non‐parametric Mann–Whitney U‐test as indicated. Differences between animals regarding diabetes incidence were tested using the Log rank survival test, with P‐values displayed within the relevant figure or legend. Analysis was performed using graphpad prism software (GraphPad Prism, San Diego, CA).
Results
Agly‐anti‐CD3 treatment prevents Th1‐differentiated pathogenic islet‐specific CD4+ T cells from causing disease but does not preferentially deplete them
Aglycosylated anti‐CD3 antibody can activate mouse T cells and cause cytokine production when used plate bound in in vitro assays (see Supplementary material, Fig. S1a), but soluble antibody fails to activate T cells in co‐culture with BMDC, confirming that it does not bind Fc‐receptors (see Supplementary material, Fig. S1b). As the antibody cannot bind murine Fc‐receptors it does not cause release of large amounts of pro‐inflammatory cytokine, so avoiding an antibody‐induced cytokine storm (see Supplementary material, Fig. S1c). Intravenous injection of this antibody reversed diabetes in NOD mice when injected at sufficiently high concentrations, whereas a low concentration of 0·5 μg/dose given for five daily doses did not have an effect on disease (see Supplementary material, Fig. S2). As shown previously with non‐FcR binding anti‐CD3 antibodies, treatment with agly‐anti‐CD3, but not isotype control antibody, decreased the numbers of T cells but spared the Foxp3+ Treg population (see Supplementary material, Fig. S3).
To investigate whether the observed preferential depletion of non‐Treg cells was caused by a selective depletion of activated, pathogenic cells we used an adoptive transfer system, where GFP+ labelled islet‐specific Th1 differentiated BDC2.5 CD4+ effector cells were transferred into 5‐week‐old female NOD mice (Fig. 1a). These mice were at least 5 weeks away from developing diabetes spontaneously, ensuring that the transferred Th1 cells could be held responsible for rapid progression to diabetes. Treatment with agly‐anti‐CD3 for 3 days prevented progression to diabetes, and prevented immune cell infiltration into the islets (Fig. 1b,c). As the transferred effectors were GFP+, we could seek these cells in spleen, pancreatic lymph nodes and pancreas to assess if they had been preferentially depleted by the treatment. Although the absolute numbers of non‐Treg cells had decreased in line with previous results, the GFP+ CD4+/GFP− CD4+ ratio (Fig. 2a) was the same in both agly‐anti‐CD3 treated mice and the isotype controls (Fig. 2b). This was the case at any time‐point we investigated after adoptive transfer (Fig. 2c). We ascertained that the transferred effector cells had not converted into FoxP3+ Treg cells, through use of Th1 differentiated BDC2.5 cells from a donor mouse expressing GFP under the Foxp3 promoter (see Supplementary material, Fig. S4). In fact, it became obvious that these cells, with potential to initiate disease, disappeared quickly after adoptive transfer, and were all‐but‐gone 6 days after injection regardless of whether the recipient mice received agly‐anti‐CD3 or isotype control treatment (Fig. 2c).
Figure 1.
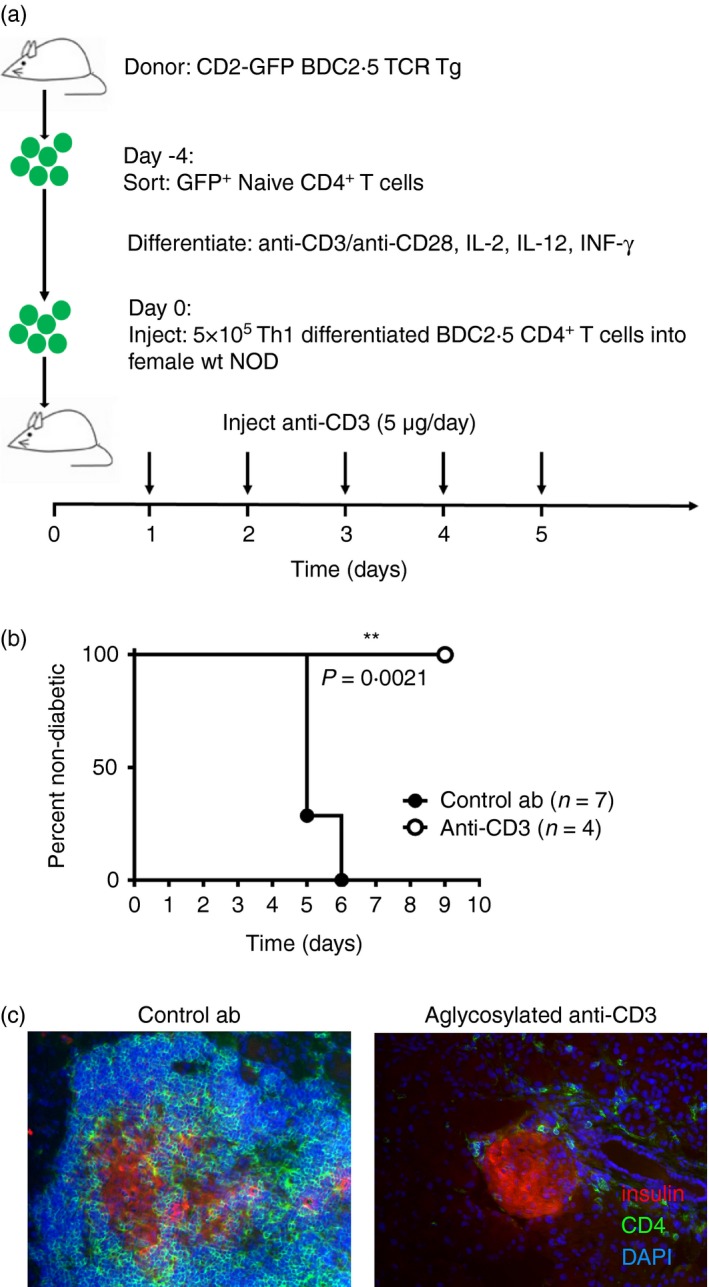
Agly anti‐CD3 protects non‐obese diabetic (NOD) mice from developing diabetes after adoptive transfer of T helper type 1 (Th1) ‐differentiated BDC2.5 T cells. Adoptive transfer of GFP + labelled Th1‐differentiated BDC2.5 CD4+ T cells into 5‐week‐old NOD female mice, followed by three daily injections of agly‐anti‐CD3 (5 μg/day) (a) led to diabetes by day 5 in the isotype control treated mice while agly‐anti‐CD3 treated mice remained healthy (b). Histological examination of the pancreas is shown after treatment with either agly‐anti‐CD3 (right) or control antibody (left), with insulin stain in red (Alexa 546), CD4 in green (Alexa 488) and DAPI in blue (c). The difference in diabetes incidence was tested using the log‐Rank survival test, (*P ≤ 0·05, **P ≤ 0·01, ***P ≤ 0·001).
Figure 2.
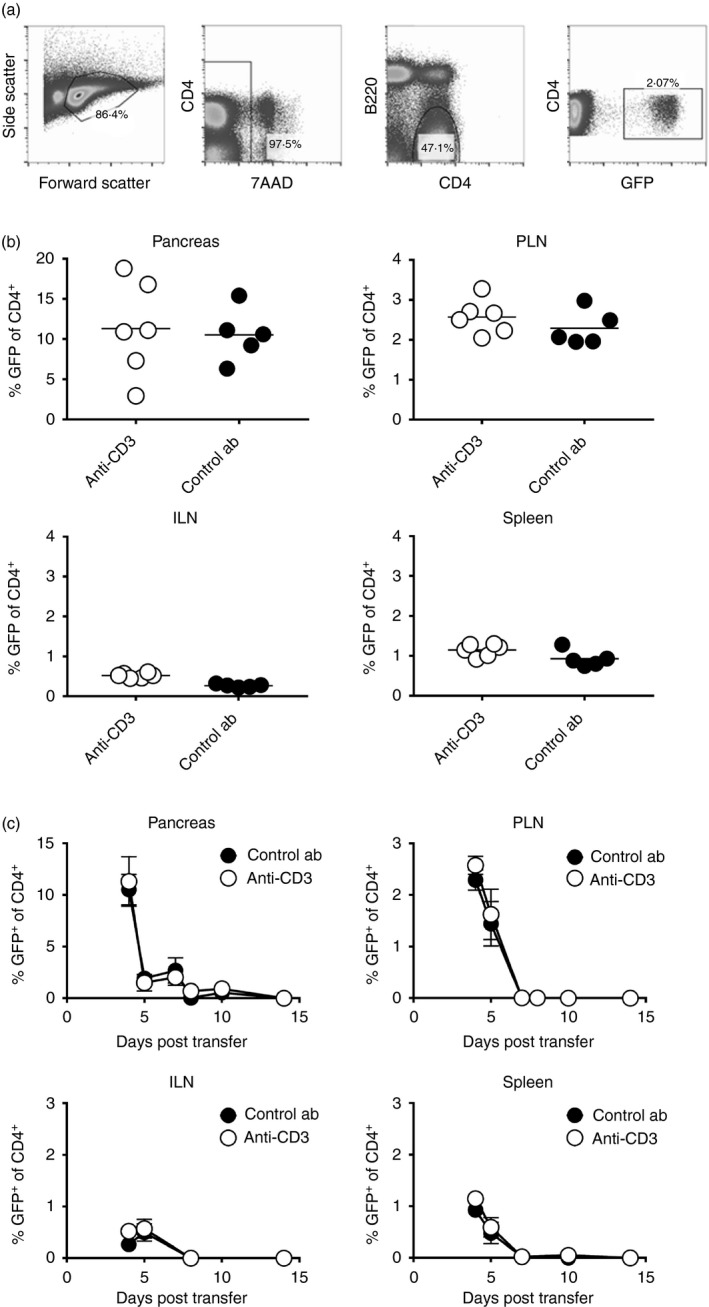
Agly anti‐CD3 does not cause preferential depletion of transferred pathogenic cells. The gating strategy for the analysis of the percentage of known pathogenic GFP + CD4+ 7AAD − B220− is shown in (a), and the percentage of GFP + T cells within the CD4+ T‐cell compartment in the indicated organs at 4 days after adoptive transfer (b). The percentage of GFP + T cells within the CD4+ T‐cell compartment in inguinal lymph nodes, spleen, pancreatic lymph nodes and pancreas at various time‐points after adoptive transfer is indicated in (c). Each data point in (b) represents one mouse, and the experiment was performed at least twice for each time‐point. The data points in (c) represent an average of at least five mice. Differences between groups were tested using Student's t‐test.
Agly‐anti‐CD3 treatment down‐regulates the expression of genes involved in glycolysis and co‐stimulation and suppresses production of IFN‐γ in pathogenic islet‐specific T cells
To gain deeper understanding of how treatment with agly‐anti‐CD3 affects the transferred Th1 cells to prevent them from precipitating diabetes, we investigated changes in their gene expression. We performed the same transfer as described in Fig. 1(a), treating the recipient mice with either agly‐anti‐CD3 or isotype control antibody, and sorted the GFP+ cells from the pancreatic draining lymph nodes 4 days following adoptive transfer. We then isolated RNA and performed microarray analyses to detect any differences in gene expression between Th1 effector cells isolated from agly‐anti‐CD3‐treated mice, and those isolated from control mice (see Supplementary material, Fig. S5). GSEA23 of microarray data of GFP+ transferred Th1 cells revealed several significantly different molecular signatures in T cells from protected mice compared with isotype‐treated controls. Fourteen molecular signatures were associated with untreated mice compared with nine from anti‐CD3‐treated mice (see Supplementary material, Table S1). Of note, in comparison with anti‐CD3‐treated cells, T cells from control ‘isotype’‐treated mice had the transcriptional hallmark of activated cells. These cells were enriched for glycolytic genes (Fig. 3a) and components of the IL‐6 and CD40 pathways (Fig. 3b–d) including CD40 ligand, signal transducer and activator of transcription 5, phosphoinositide 3 kinase (PI3K) and mitogen‐activated protein kinase.
Figure 3.
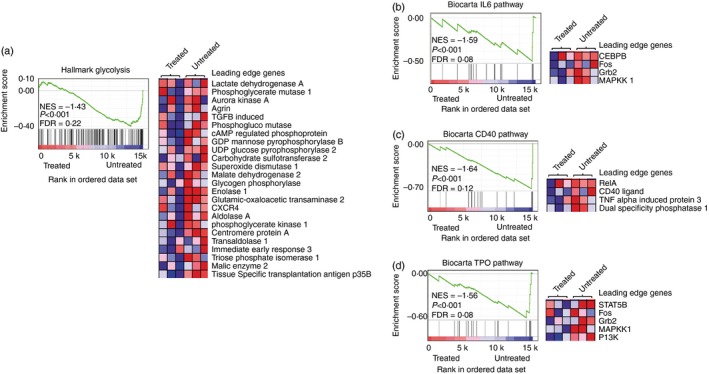
Gene set enrichment analysis of microarray data from donor T helper type 1 (Th1) cells after treatment with either isotype antibody or agly‐anti‐CD3. wild‐type non‐obese diabetic (Wt NOD) female mice received 5 × 10⁵ Th1 differentiated BDC2.5 CD4+ T cells, and were then treated with isotype control antibody or agly‐anti‐CD3 as described in Fig. 1. Four days after transfer, the GFP + cells were sorted from the pancreatic lymph nodes of the mice, and the sorted cells were prepared for microarray analysis. Each agly‐anti‐CD3 sample was pooled from three or four mice, and each control sample was pooled from two or three mice. Molecular signature data sets analysed included hallmark data sets (a) and curated gene sets (b‐d). Glycolysis genes are enriched in untreated T cells (a), the leading edge set of genes, those contributing most to the enrichment score, is shown in the heat map. The enrichment score plot indicates the degree of correlation of members of the data set with genes in the molecular signature. In this case a negative correlation is shown, indicating enrichment of glycolysis genes in the isotype‐treated groups. Components of the IL‐6 (b), CD40 (c) and Thrombopoietin (TPO) (d) pathways are also associated with isotype‐treated T cells.
In order to examine the effects of anti‐CD3 treatment on cell behaviour, we performed the same transfer and sort as described previously (Fig. 1a), and re‐stimulated the cells for 4 hr with PMA and ionomycin. This analysis revealed complete suppression of IFN‐γ production (Fig. 4a) in the anti‐CD3‐treated group compared with the isotype control. Studies in central nervous system inflammation have suggested that anti‐CD3 treatment may induce IL‐10 production in previously pathogenic cells, and that this may be a mechanism for the protective effects seen.24 However, in our experimental system we could find no evidence that the potentially pathogenic transferred GFP+ effector T cells had acquired IL‐10 secretion (see Supplementary material, Fig. S6). GLUT‐1 is mostly maintained within the cell cytoplasm, to be transported to the surface in response to activation. Analysis of surface GLUT‐1 revealed that GFP+ cells isolated from anti‐CD3‐treated mice expressed lower levels of cell surface GLUT‐1 (Fig. 4b), and lower levels of intracellular GLUT‐1 (Fig. 4c), than their isotype‐treated littermates. In addition, GFP+ cells from the anti‐CD3‐treated group were smaller (Fig. 4d). Both these observations indicate a less activated status No difference in their mitochondrial content or their production of superoxide (Fig. 4e) was discernible.
Figure 4.
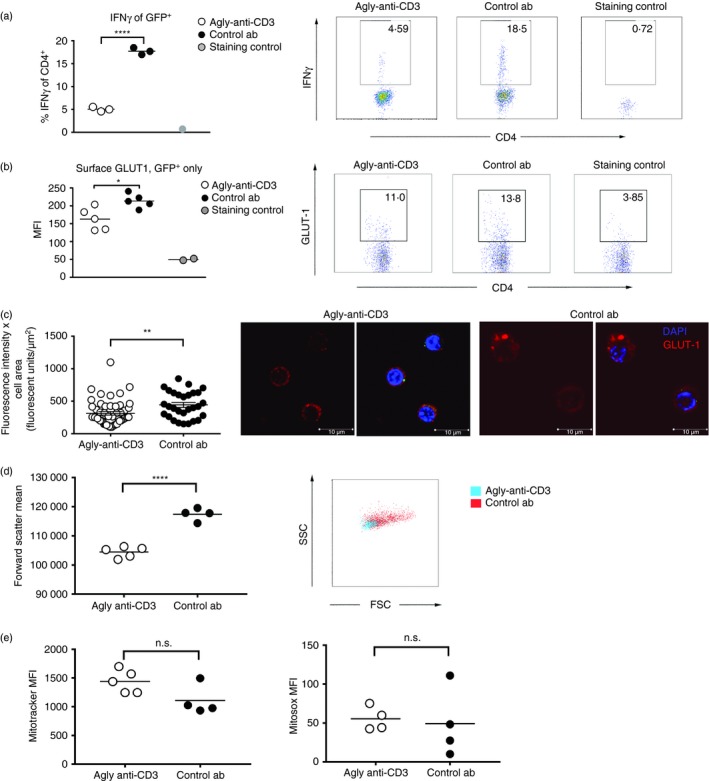
Functional studies of T helper type 1 (Th1) cells after treatment with either isotype control antibody or agly‐anti‐CD3. Wild‐type non‐obese diabetic (wt NOD) female mice received 5 × 10⁵ Th1 differentiated BDC2.5 CD4+ T cells, and were then treated with isotype control antibody or agly‐anti‐CD3 as described in Fig. 1. Four days after transfer the GFP + cells were sorted from the pancreatic lymph nodes of the mice. The cells were assessed for interferon‐γ (IFN‐γ) (a), surface GLUT‐1 (b), intracellular GLUT‐1 content (c), size through forward scatter (d), mitochondrial content with mitotracker and mitochondrial superoxide production with mitosox (e). Each data point represents one mouse except in (a), where each data point is a pool of two or three mice. Each experiment was repeated at least twice. Differences between groups were tested using Student's t‐test.
Agly‐anti‐CD3 inhibits T‐cell‐mediated activation of antigen‐presenting cells
The adoptively transferred cells disappeared quickly, and 6 days after transfer they were mostly undetectable (Fig. 2c) even in the islet infiltrates, indicating that the transferred cells had simply detonated the anti‐islet pathology and then disappeared. At 5 weeks of age there is normally only limited lymphocyte infiltration in the NOD mouse islets, so it is clear that the transferred cells somehow accelerated disease presumably by recruitment and activation of host islet‐reactive cells. One way this could have happened is by the licensing of host dendritic cells,25, 26, 27 a notion further supported by the changes in the CD40–CD40 ligand pathway observed in the GSEA. We tested this by investigating how pre‐incubation with agly‐anti‐CD3 affected the activation of mimotope‐presenting BMDC by Th1 differentiated BDC2.5 T cells in vitro. We found that BMDC cultured with Th1 BDC2.5 pre‐treated with agly‐anti‐CD3 failed to up‐regulate the co‐stimulatory molecule CD80 to the same extent as either positive controls cultured without any antibody, or controls where the BDC2.5 T cells had been pre‐treated with the isotype antibody, which recognizes human CD3 (Fig. 5a). In addition, the BMDC exposed to pre‐treated Th1 differentiated BDC2.5 T cells produced less IL‐12 (Fig. 5b).
Figure 5.
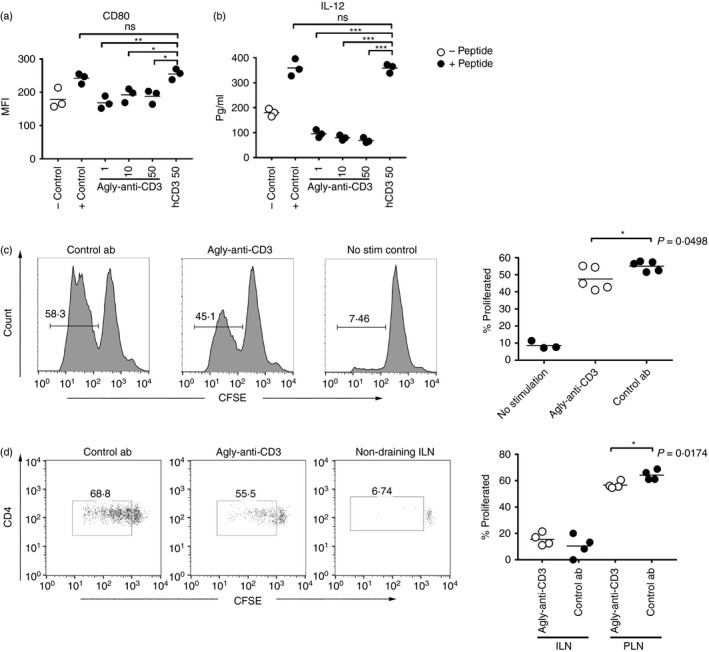
Agly‐anti‐CD3 inhibits T cells from activating antigen‐presenting cells (APC). Pre‐incubation with agly‐anti‐CD3 prevents T helper type 1 (Th1) differentiated BDC2.5 T cell from activating bone marrow‐derived dendritic cells (BMDC). Levels of co‐stimulatory molecule CD80 on the co‐cultured BMDC (a) were measured by flow cytometry, and interleukin‐12 (IL‐12) in the culture medium was detected by ELISA (b). Controls are BMDC cultured alone, positive control cultures have Th1 cells added without pre‐incubation with antibody, and in hCD3 cultures the Th1 cells have been pre‐incubated with the isotype control antibody which binds human, but not mouse CD3. Mice were injected and treated as in Fig. 1, and pancreatic nodes used as antigen‐presenting cells to CFSE‐labelled BDC2·5 CD4+ cells in vitro (c) or in vivo (d) to assess proliferation. Differences between groups were determined using the non‐parametric Mann‐Whitney test (*P ≤ 0·05, **P ≤ 0·01, ***P ≤ 0·001). The results are representative of at least three experiments.
To investigate if treatment with agly‐anti‐CD3 affected islet antigen presentation in vivo, we performed the same transfer as described in Fig. 1(a), and then either tested the capacity of pancreatic lymph node‐derived antigen‐presenting cells to present endogenous antigen to naive BDC2.5 CD4 T cells ex vivo (Fig. 5c) or completely in vivo through injection of the naive CFSE‐labelled BDC2.5 cells 3 days after the last antibody injection (Fig. 5d). We found that BDC2.5 CD4+ T‐cell proliferation was modestly but significantly decreased in agly‐anti‐CD3‐treated pancreatic lymph nodes both when assessed ex vivo (Fig. 5c) and in vivo (Fig. 5d).
Agly‐anti‐CD3 increases expression of PD‐1 on pathogenic islet‐specific T cells
Expression of PD‐L1 on antigen‐presenting cells is an important regulator of anti‐islet immune responses,13, 28, 29, 30, 31 and blockade of this interaction can precipitate diabetes in prone strains.29, 32 Furthermore, blockade of PD‐1/PD‐L1 increases the interaction time between T cells and antigen‐presenting cells, so indirectly enhancing activation.33 We used the same experimental set up described in Fig. 1(a), and found that anti‐CD3 treatment leads to around an eight‐fold increase in the expression of PD‐1 on the GFP+ donor‐derived formed Th1 cells (Fig. 6a). Anti‐PD‐L1‐accelerated diabetes in wild‐type NOD mice could be delayed by anti‐CD3 treatment, but this protective effect was lost if anti‐CD3 therapy was discontinued while PD‐L1 antibody remained in the system (Fig. 6b), the half‐life of anti‐PD‐L1 antibody being c. 7 days.34 Only anti‐CD3 treatment that continued beyond the point when anti‐PD‐L1 was sufficiently purged from the system was sufficient to establish lasting tolerance and euglycaemia (Fig. 6c).
Figure 6.
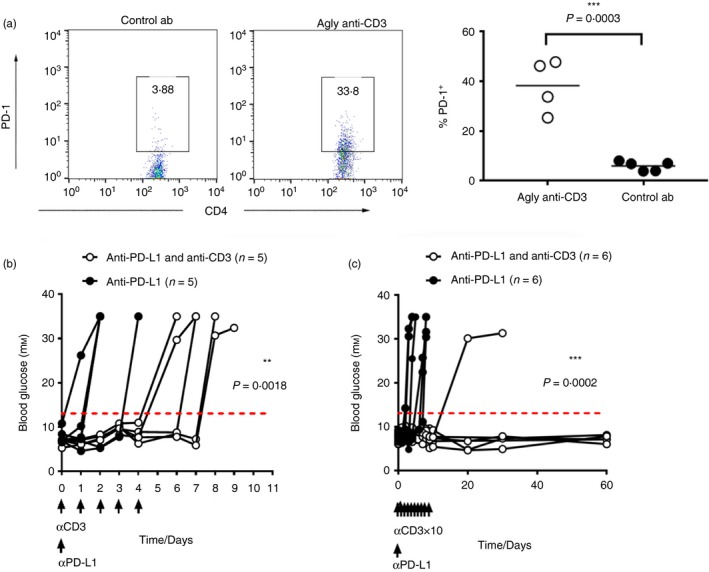
Agly anti‐CD3 treatment increases programmed death 1 (PD‐1) expression on islet‐specific effector T cells, and blockade of PD‐1 activation overcomes agly anti‐CD3‐induced protection from diabetes. Wild‐type non‐obese diabetic (Wt NOD) female mice received 5 × x105 T helper type 1 (Th1) differentiated BDC2.5 CD4+ GFP + T cells, and were then treated with isotype control antibody or agly‐anti‐CD3 as described in Fig. 1. Four days after transfer the cells in the pancreatic lymph nodes were assessed for PD‐1 expression (a). Injection of 2 mg of anti‐PD‐L1 antibody in pre‐diabetic NOD mice combined with short term (5 injections) (b) or longer (10 injections) (c) treatment with agly‐anti‐CD3 (5 μg/day). Differences between groups in (b) and (c) were assessed using the Log Rank survival test (*P ≤ 0·05, **P ≤ 0·01, ***P ≤ 0·001).
Discussion
Anti‐CD3 treatment has shown efficacy in certain clinical trials, with prolongation of time to dependence on exogenous insulin administration in treated patients, and lower levels of HbA1c. The fact that anti‐CD3 treatment in humans failed to mimic the complete remission seen in diabetic mice initially disappointed the type 1 diabetes community. However, detailed analysis of the treated cohorts indicates that success might be increased through focus on particular subgroups such as younger patients7 or in patients identifiable by lower HbA1c and insulin requirement at the beginning of the study.6, 35 It is also clear that too low an antibody dose fails to achieve any positive effects,36 which, as we demonstrate in this paper, is also true in NOD mice. There is a growing consensus to consider combination therapies targeting different aspects of disease, such as inflammation and beta cell function, in order to improve outcome,37 and that anti‐CD3 treatment could be a useful component in such an approach.37, 38, 39
Previous work has described a preferential depletion of Th1 differentiated cells after anti‐CD3 treatment.11, 14 In this study we wanted to determine in detail which ‘activated’ cells disappear through use of GFP‐labelled Th1‐differentiated islet‐specific BDC2.5 CD4+ T cells, injected into young, pre‐diabetic female NOD mice. In this case, we know that the peptide recognized by the BDC2.5 cells is presented in the pancreatic lymph nodes,16 and that these cells cause rapid progression to diabetes after transfer.40 Interferon‐γ is necessary for CD4+ T‐cell‐mediated beta cell destruction, as demonstrated by studies blocking the cytokine41 as well as studies in mice without a functional receptor.42 We found that the transferred cells disappeared quickly after transfer, and were mostly gone around 6 days after injection when disease became apparent. The massive infiltrates around the pancreatic islets consisted almost entirely of endogenous T cells and recruited mononuclear cells. It appears therefore, that the transferred activated cells precipitated disease, but did so within a very short time window of activation. The composition of the CD4+ T‐cell population at different time‐points after transfer showed that anti‐CD3 treatment, albeit completely protecting mice from developing diabetes, did not preferentially deplete the originally transferred GFP+ cells, as these were present in equal ratios in both anti‐CD3‐treated and control‐treated mice, but rather prevented further activation of subsequent waves of islet‐reactive T cells.
Investigation of peripheral blood mononuclear cells in teplizumab recipients has identified differential expression of several genes involved in T‐cell activation and effector function.43 In our experiments, GSEA of microarray data of GFP+ transferred Th1 cells showed some major differences between treated and untreated cells. Fourteen molecular signatures were strongly associated with cells from untreated mice, compared with nine from anti‐CD3‐treated mice. T cells from isotype‐treated control mice had the transcriptional hallmark of activated cells. The finding that untreated effector Th1 cells were strongly enriched in transcripts encoding components of the glycolysis pathway suggests that anti‐CD3 treatment may in some way suppress metabolic activity or alternatively select or skew T cells to other modes of metabolism such as fatty acid metabolism. This shift in metabolic mode has been well described in Treg cells and memory T cells.44, 45 A recent report described that signalling though PD‐1 leads to down‐regulation of glycolysis in T cells,46 and in our studies we find that PD‐1 is up‐regulated in the anti‐CD3‐treated effector cells. Previous studies have demonstrated that blockade of PD‐1/PD‐L1 interaction increases the interaction time between T cells and antigen‐presenting cells and enhances activation,33, 47 and expression of PD‐L1 is important for regulating anti‐islet immune responses.28, 29, 30, 31, 32 Our results show that anti‐CD3 treatment up‐regulates PD‐1 on effector T cells, and that anti‐CD3 treatment is not effective if the PD‐1/PD‐L1 pathway is inhibited. In our studies of PD‐L1 blockade, both activated islet‐specific cells as well as naive cells are potentially affected by the anti‐PD‐LI, and it remains to be determined if the increase of PD‐1 is the most important factor in the anti‐CD3‐mediated reduction of pathogenicity. It will be interesting to assess further the effects of anti‐CD3 on Th1 cellular metabolism, and whether up‐regulation of PD‐1 precedes the decrease in glycolytic activity. It is also notable that treatment down‐regulated pathways involved in co‐stimulation of antigen‐presenting cells, as well as the PI3K signalling pathway, which is of crucial importance for IFN‐γ secretion.48, 49 The GSEA data support the notion that ex‐Th1 cells have been reprogrammed to become less activated or pro‐inflammatory. This could be due, at least in part, to the increased ratio of Foxp3+ Treg cells present11, 50 and elevated levels of transforming growth factor‐β (TGF‐β) in treated recipients,13, 51, 52 as well as to direct effects mediated by the antibody treatment of the effector cell itself. To further investigate this, we investigated the functional properties of the cells from treated animals. We discovered that these ex‐Th1 cells were now inhibited from secreting the Th1 hallmark cytokine IFN‐γ, which is necessary for islet‐specific CD4+ T cells to cause diabetes,40, 42 indicating that treatment had completely changed their behaviour.
The down‐regulation of the CD40 pathway suggested by the microarray data indicated that effector cells from treated mice may be deficient in their capacity to licence DC, and so be prevented from perpetuating the anti‐islet immune response. In addition, the lack of IFN‐γ in anti‐CD3‐treated ex‐Th1 cells would impact on their capacity to licence antigen‐presenting cells, as has been demonstrated in studies of CTLA4‐immunoglobulin‐induced tolerance.27 We found that pre‐incubation with agly‐anti‐CD3 prevented Th1 differentiated BDC2.5 CD4+ T cells from activating BMDC in co‐culture, both as measured by up‐regulation of the co‐stimulatory molecule CD80, and secretion of IL‐12, which is important to their activating function. We previously found that DC that are unable to deliver full activation signals may, by default, induce tolerance, T‐cell unresponsiveness, and Treg cells.53 Foxp3+ Treg cells themselves can also inhibit DC function,54 an effect that can be broken by additional CD40 ligand stimulation.55 Administration of tolerogenic DC potentiates the protective effects of anti‐CD3 in allogeneic islet transplantation.56 Antigen presentation is influenced by the actions of TGF‐β, 57, 58 the production of which is of crucial importance for the protective effect of anti‐CD3 treatment13, 51 and which can be further amplified through uptake of apoptotic T cells by macrophages.59
An interesting aspect of anti‐CD3‐mediated protection from type 1 diabetes in mice is the importance of timing. Contrary to many other treatment regimens, anti‐CD3 treatment is only effective if administered once the mice have become diabetic, and not before.60 The effects of anti‐CD3 treatment on tolerance to transplanted tissue is also highly dependent on the timing of administration, with treatment coinciding with the priming of alloreactive immune responses (3–7 days after transplant), affording long‐term graft survival, which earlier treatment (day 1–3) could not.14, 50 This may reflect the need for a sufficiently high number of activated islet‐reactive T cells to be targeted by anti‐CD3 therapy to enable some of the longer‐term manifestations necessary for tolerance. The rapid turnover of pathogenic cells seen in our study supports the concept of a crucial treatment window, as the period during which they exert their effect to achieve a perpetuation of the anti‐islet immune response is so brief.
In this report we describe how a mouse equivalent of otelixizumab, agly‐anti‐CD3, prevents pathogenic islet‐specific Th1 cells from causing diabetes by inhibiting their metabolism, CD40 signalling and cytokine production, and through up‐regulating PD‐1 expression. Anti‐CD3 does not preferentially deplete these cells, but prevents them from being pathogenic and from contributing to activation of naive cells. Inhibition of PD‐1/PD‐L1 interaction breaks the protective effect of anti‐CD3 treatment in wild‐type NOD mice. We propose that inhibition of effector T‐cell metabolism and function, and the downstream consequences of this, operates in combination with the favourable ratio of Foxp3+ Treg cells and elevated levels of TGF‐β to provide the long‐term protective effect of the short treatment with aglycosyl‐anti‐CD3 antibody.
Disclosures
The authors declare no commercial or financial conflict of interest. Author contributions: MW, HW and AC designed the studies, MW, AR, JP, CP, MV conducted experiments, and analysed data, DH analysed data, HW, MA and FSW provided reagents, all authors discussed the data and MW wrote the manuscript with assistance from all other authors.
Supporting information
Figure S1. Properties of agly‐anti‐CD3.
Figure S2. Injection of agly‐anti‐CD3 reverses diabetes in non‐obese diabetic mice in a dose‐dependent manner.
Figure S3. Agly‐anti‐CD3 treatment increases the percentage of Foxp3+ regulatory T (T reg) cells through selectively sparing this population.
Figure S4. Treatment with agly‐anti‐CD3 does not cause conversion of islet specific T helper type 1 (Th1) effector cells to Foxp3+ regulatory T (Treg) cells.
Figure S5. Heatmap presentation of microarray data comparing islet specific T helper type 1 (Th1 cells from agly‐anti‐CD3 treated and isotype‐treated mice.
Figure S6. T helper type 1 (Th1) differentiated cells from agly‐anti‐CD3‐treated recipients do not produce interleukin‐10 (IL‐10) when restimulated.
Table S1. All the significantly enriched molecular signatures associated with anti‐CD3 treated or untreated cells are listed.
Acknowledgements
We thank Dimitris Kioussis (MRC/National Institute for Medical Research) for the NOD‐hCD2‐GFP mice. We thank L. Wright, A. Dinsdale, L. Broome, Mr Nigel Miller and Y.K. Sawyer (University of Cambridge) for excellent technical support and Nick Holmes (University of Cambridge) for helpful discussions. This work was funded by grants from the National Centre for the Replacement, Refinement and Reduction of Animals in research (NC3Rs) (NC/M001083/1) (MW), Diabetes UK (BDA 13/0004785) (AC), Diabetes Research and Wellness (SCA/OF/12/13) (AC), European Research Council 7th Frame Programme (health‐f5‐2009‐241883) (AC and HW), Britain Israel Research and Academic Exchange Partnership (BIRAX) (02BX12ACYD) (AC), and ERC advanced investigator grant 339402 (HW) and pump priming funding from the Cambridge University Isaac Newton trust.
References
- 1. Chatenoud L, Thervet E, Primo J, Bach JF. Anti‐CD3 antibody induces long‐term remission of overt autoimmunity in nonobese diabetic mice. Proc Natl Acad Sci USA 1994; 91:123–7. [DOI] [PMC free article] [PubMed] [Google Scholar]
- 2. Herold KC, Hagopian W, Auger JA, Poumian‐Ruiz E, Taylor L, Donaldson D et al Anti‐CD3 monoclonal antibody in new‐onset type 1 diabetes mellitus. N Engl J Med 2002; 346:1692–8. [DOI] [PubMed] [Google Scholar]
- 3. Sherry N, Hagopian W, Ludvigsson J, Jain SM, Wahlen J, Ferry RJ Jr et al Teplizumab for treatment of type 1 diabetes (Protege study): 1‐year results from a randomised, placebo‐controlled trial. Lancet 2011; 378:487–97. [DOI] [PMC free article] [PubMed] [Google Scholar]
- 4. Keymeulen B, Vandemeulebroucke E, Ziegler AG, Mathieu C, Kaufman L, Hale G et al Insulin needs after CD3‐antibody therapy in new‐onset type 1 diabetes. N Engl J Med 2005; 352:2598–608. [DOI] [PubMed] [Google Scholar]
- 5. Keymeulen B, Walter M, Mathieu C, Kaufman L, Gorus F, Hilbrands R et al Four‐year metabolic outcome of a randomised controlled CD3‐antibody trial in recent‐onset type 1 diabetic patients depends on their age and baseline residual beta cell mass. Diabetologia 2010; 53:614–23. [DOI] [PubMed] [Google Scholar]
- 6. Herold KC, Gitelman SE, Ehlers MR, Gottlieb PA, Greenbaum CJ, Hagopian W et al Teplizumab (anti‐CD3 mAb) treatment preserves C‐peptide responses in patients with new‐onset type 1 diabetes in a randomized controlled trial: metabolic and immunologic features at baseline identify a subgroup of responders. Diabetes 2013; 62:3766–74. [DOI] [PMC free article] [PubMed] [Google Scholar]
- 7. Hagopian W, Ferry RJ Jr, Sherry N, Carlin D, Bonvini E, Johnson S et al Teplizumab preserves C‐peptide in recent‐onset type 1 diabetes: two‐year results from the randomized, placebo‐controlled Protege trial. Diabetes 2013; 62:3901–8. [DOI] [PMC free article] [PubMed] [Google Scholar]
- 8. Aronson R, Gottlieb PA, Christiansen JS, Donner TW, Bosi E, Bode BW et al Low‐dose otelixizumab anti‐CD3 monoclonal antibody DEFEND‐1 study: results of the randomized phase III study in recent‐onset human type 1 diabetes. Diabetes Care 2014; 37:2746–54. [DOI] [PMC free article] [PubMed] [Google Scholar]
- 9. Smith JA, Tang Q, Bluestone JA. Partial TCR signals delivered by FcR‐nonbinding anti‐CD3 monoclonal antibodies differentially regulate individual Th subsets. J Immunol 1998; 160:4841–9. [PubMed] [Google Scholar]
- 10. Smith JA, Tso JY, Clark MR, Cole MS, Bluestone JA. Nonmitogenic anti‐CD3 monoclonal antibodies deliver a partial T cell receptor signal and induce clonal anergy. J Exp Med 1997; 185:1413–22. [DOI] [PMC free article] [PubMed] [Google Scholar]
- 11. Penaranda C, Tang Q, Bluestone JA. Anti‐CD3 therapy promotes tolerance by selectively depleting pathogenic cells while preserving regulatory T cells. J Immunol 2011; 187:2015–22. [DOI] [PMC free article] [PubMed] [Google Scholar]
- 12. Mehta DS, Christmas RA, Waldmann H, Rosenzweig M. Partial and transient modulation of the CD3–T‐cell receptor complex, elicited by low‐dose regimens of monoclonal anti‐CD3, is sufficient to induce disease remission in non‐obese diabetic mice. Immunology 2009; 130:103–13. [DOI] [PMC free article] [PubMed] [Google Scholar]
- 13. Baas M, Besancon A, Goncalves T, Valette F, Yagita H, Sawitzki B et al TGFβ‐dependent expression of PD‐1 and PD‐L1 controls CD8+ T cell anergy in transplant tolerance. Elife 2016; 5:e08133. [DOI] [PMC free article] [PubMed] [Google Scholar]
- 14. You S, Zuber J, Kuhn C, Baas M, Valette F, Sauvaget V et al Induction of allograft tolerance by monoclonal CD3 antibodies: a matter of timing. Am J Transplant 2012; 12:2909–19. [DOI] [PubMed] [Google Scholar]
- 15. Katz JD, Wang B, Haskins K, Benoist C, Mathis D. Following a diabetogenic T cell from genesis through pathogenesis. Cell 1993; 74:1089–100. [DOI] [PubMed] [Google Scholar]
- 16. Hoglund P, Mintern J, Waltzinger C, Heath W, Benoist C, Mathis D. Initiation of autoimmune diabetes by developmentally regulated presentation of islet cell antigens in the pancreatic lymph nodes. J Exp Med 1999; 189:331–9. [DOI] [PMC free article] [PubMed] [Google Scholar]
- 17. Raine T, Zaccone P, Mastroeni P, Cooke A. Salmonella typhimurium infection in nonobese diabetic mice generates immunomodulatory dendritic cells able to prevent type 1 diabetes. J Immunol 2006; 177:2224–33. [DOI] [PubMed] [Google Scholar]
- 18. Bettelli E, Carrier Y, Gao W, Korn T, Strom TB, Oukka M et al Reciprocal developmental pathways for the generation of pathogenic effector TH17 and regulatory T cells. Nature 2006; 441:235–8. [DOI] [PubMed] [Google Scholar]
- 19. Chamberlain G, Wallberg M, Rainbow D, Hunter K, Wicker LS, Green EA. A 20‐Mb region of chromosome 4 controls TNF‐α‐mediated CD8+ T cell aggression toward beta cells in type 1 diabetes. J Immunol 2006; 177:5105–14. [DOI] [PubMed] [Google Scholar]
- 20. Du P, Kibbe WA, Lin SM. lumi: a pipeline for processing Illumina microarray. Bioinformatics 2008; 24:1547–8. [DOI] [PubMed] [Google Scholar]
- 21. Lin SM, Du P, Huber W, Kibbe WA. Model‐based variance‐stabilizing transformation for Illumina microarray data. Nucleic Acids Res 2008; 36:e11. [DOI] [PMC free article] [PubMed] [Google Scholar]
- 22. Smyth GK. Linear models and empirical Bayes methods for assessing differential expression in microarray experiments. Stat Appl Genet Mol Biol 2004; 3:1–25. Article3. [DOI] [PubMed] [Google Scholar]
- 23. Subramanian A, Tamayo P, Mootha VK, Mukherjee S, Ebert BL, Gillette MA et al Gene set enrichment analysis: a knowledge‐based approach for interpreting genome‐wide expression profiles. Proc Natl Acad Sci USA 2005; 102:15545–50. [DOI] [PMC free article] [PubMed] [Google Scholar]
- 24. Esplugues E, Huber S, Gagliani N, Hauser AE, Town T, Wan YY et al Control of TH17 cells occurs in the small intestine. Nature 2011; 475:514–8. [DOI] [PMC free article] [PubMed] [Google Scholar]
- 25. Johnson‐Leger C, Christensen J, Klaus GG. CD28 co‐stimulation stabilizes the expression of the CD40 ligand on T cells. Int Immunol 1998; 10:1083–91. [DOI] [PubMed] [Google Scholar]
- 26. Schoenberger SP, Toes RE, van der Voort EI, Offringa R, Melief CJ. T‐cell help for cytotoxic T lymphocytes is mediated by CD40‐CD40L interactions. Nature 1998; 393:480–3. [DOI] [PubMed] [Google Scholar]
- 27. Patakas A, Ji RR, Weir W, Connolly SE, Benson RA, Nadler SG et al Abatacept inhibition of T cell priming in mice by induction of a unique transcriptional profile that reduces their ability to activate antigen‐presenting cells. Arthritis Rheumatol 2016; 68:627–38. [DOI] [PubMed] [Google Scholar]
- 28. Keir ME, Liang SC, Guleria I, Latchman YE, Qipo A, Albacker LA et al Tissue expression of PD‐L1 mediates peripheral T cell tolerance. J Exp Med 2006; 203:883–95. [DOI] [PMC free article] [PubMed] [Google Scholar]
- 29. Newland SA, Phillips JM, Mastroeni P, Azuma M, Zaccone P, Cooke A. PD‐L1 blockade overrides Salmonella typhimurium‐mediated diabetes prevention in NOD mice: no role for Tregs. Eur J Immunol 2011; 41:2966–76. [DOI] [PubMed] [Google Scholar]
- 30. Unger WW, Laban S, Kleijwegt FS, van der Slik AR, Roep BO. Induction of Treg by monocyte‐derived DC modulated by vitamin D3 or dexamethasone: differential role for PD‐L1. Eur J Immunol 2009; 39:3147–59. [DOI] [PubMed] [Google Scholar]
- 31. Wolfle SJ, Strebovsky J, Bartz H, Sahr A, Arnold C, Kaiser C et al PD‐L1 expression on tolerogenic APCs is controlled by STAT‐3. Eur J Immunol 2011; 41:413–24. [DOI] [PubMed] [Google Scholar]
- 32. Ansari MJ, Salama AD, Chitnis T, Smith RN, Yagita H, Akiba H et al The programmed death‐1 (PD‐1) pathway regulates autoimmune diabetes in nonobese diabetic (NOD) mice. J Exp Med 2003; 198:63–9. [DOI] [PMC free article] [PubMed] [Google Scholar]
- 33. Fife BT, Pauken KE, Eagar TN, Obu T, Wu J, Tang Q et al Interactions between PD‐1 and PD‐L1 promote tolerance by blocking the TCR‐induced stop signal. Nat Immunol 2009; 10:1185–92. [DOI] [PMC free article] [PubMed] [Google Scholar]
- 34. Selby MJ, Engelhardt JJ, Johnston RJ, Lu LS, Han M, Thudium K et al Preclinical development of ipilimumab and nivolumab combination immunotherapy: mouse tumor models, in vitro functional studies, and cynomolgus macaque toxicology. PLoS One 2016; 11:e0161779. [DOI] [PMC free article] [PubMed] [Google Scholar]
- 35. Herold KC, Gitelman SE, Willi SM, Gottlieb PA, Waldron‐Lynch F, Devine L et al Teplizumab treatment may improve C‐peptide responses in participants with type 1 diabetes after the new‐onset period: a randomised controlled trial. Diabetologia 2013; 56:391–400. [DOI] [PMC free article] [PubMed] [Google Scholar]
- 36. Ambery P, Donner TW, Biswas N, Donaldson J, Parkin J, Dayan CM. Efficacy and safety of low‐dose otelixizumab anti‐CD3 monoclonal antibody in preserving C‐peptide secretion in adolescent type 1 diabetes: DEFEND‐2, a randomized, placebo‐controlled, double‐blind, multi‐centre study. Diabet Med 2014; 31:399–402. [DOI] [PubMed] [Google Scholar]
- 37. Ludvigsson J. Therapies to preserve beta‐cell function in type 1 diabetes. Drugs 2016; 76:169–85. [DOI] [PubMed] [Google Scholar]
- 38. Cooke A, Phillips JM, Parish NM. Tolerogenic strategies to halt or prevent type 1 diabetes. Nat Immunol 2001; 2:810–5. [DOI] [PubMed] [Google Scholar]
- 39. Sherry NA, Chen W, Kushner JA, Glandt M, Tang Q, Tsai S et al Exendin‐4 improves reversal of diabetes in NOD mice treated with anti‐CD3 monoclonal antibody by enhancing recovery of beta‐cells. Endocrinology 2007; 148:5136–44. [DOI] [PubMed] [Google Scholar]
- 40. Bending D, De La Pena H, Veldhoen M, Phillips JM, Uyttenhove C, Stockinger B et al Highly purified Th17 cells from BDC2.5NOD mice convert into Th1‐like cells in NOD/SCID recipient mice. J Clin Invest 2009; 119:565–72. [DOI] [PMC free article] [PubMed] [Google Scholar]
- 41. Debray‐Sachs M, Carnaud C, Boitard C, Cohen H, Gresser I, Bedossa P et al Prevention of diabetes in NOD mice treated with antibody to murine IFN γ . J Autoimmun 1991; 4:237–48. [DOI] [PubMed] [Google Scholar]
- 42. Yi Z, Li L, Garland A, He Q, Wang H, Katz JD et al IFN‐γ receptor deficiency prevents diabetes induction by diabetogenic CD4+, but not CD8+, T cells. Eur J Immunol 2012; 42:2010–8. [DOI] [PMC free article] [PubMed] [Google Scholar]
- 43. Tooley JE, Vudattu N, Choi J, Cotsapas C, Devine L, Raddassi K et al Changes in T‐cell subsets identify responders to FcR‐nonbinding anti‐CD3 mAb (teplizumab) in patients with type 1 diabetes. Eur J Immunol 2016; 46:230–41. [DOI] [PMC free article] [PubMed] [Google Scholar]
- 44. van der Windt GJ, Everts B, Chang CH, Curtis JD, Freitas TC, Amiel E et al Mitochondrial respiratory capacity is a critical regulator of CD8+ T cell memory development. Immunity 2012; 36:68–78. [DOI] [PMC free article] [PubMed] [Google Scholar]
- 45. Michalek RD, Gerriets VA, Jacobs SR, Macintyre AN, MacIver NJ, Mason EF et al Cutting edge: distinct glycolytic and lipid oxidative metabolic programs are essential for effector and regulatory CD4+ T cell subsets. J Immunol 2011; 186:3299–303. [DOI] [PMC free article] [PubMed] [Google Scholar]
- 46. Patsoukis N, Bardhan K, Chatterjee P, Sari D, Liu B, Bell LN et al PD‐1 alters T‐cell metabolic reprogramming by inhibiting glycolysis and promoting lipolysis and fatty acid oxidation. Nat Commun 2015; 6:6692. [DOI] [PMC free article] [PubMed] [Google Scholar]
- 47. Honda T, Egen JG, Lammermann T, Kastenmuller W, Torabi‐Parizi P, Germain RN. Tuning of antigen sensitivity by T cell receptor‐dependent negative feedback controls T cell effector function in inflamed tissues. Immunity 2014; 40:235–47. [DOI] [PMC free article] [PubMed] [Google Scholar]
- 48. Soond DR, Bjorgo E, Moltu K, Dale VQ, Patton DT, Torgersen KM et al PI3K p110δ regulates T‐cell cytokine production during primary and secondary immune responses in mice and humans. Blood 2010; 115:2203–13. [DOI] [PMC free article] [PubMed] [Google Scholar]
- 49. Barbera Betancourt A, Emery JL, Recino A, Wong FS, Cooke A, Okkenhaug K et al Inhibition of phosphoinositide 3‐kinase p110δ does not affect T cell driven development of type 1 diabetes despite significant effects on cytokine production. PLoS One 2016; 11:e0146516. [DOI] [PMC free article] [PubMed] [Google Scholar]
- 50. Goto R, You S, Zaitsu M, Chatenoud L, Wood KJ. Delayed anti‐CD3 therapy results in depletion of alloreactive T cells and the dominance of Foxp3+ CD4+ graft infiltrating cells. Am J Transplant 2013; 13:1655–64. [DOI] [PMC free article] [PubMed] [Google Scholar]
- 51. Perruche S, Zhang P, Liu Y, Saas P, Bluestone JA, Chen W. CD3‐specific antibody‐induced immune tolerance involves transforming growth factor‐β from phagocytes digesting apoptotic T cells. Nat Med 2008; 14:528–35. [DOI] [PubMed] [Google Scholar]
- 52. You S, Leforban B, Garcia C, Bach JF, Bluestone JA, Chatenoud L. Adaptive TGF‐β‐dependent regulatory T cells control autoimmune diabetes and are a privileged target of anti‐CD3 antibody treatment. Proc Natl Acad Sci USA 2007; 104:6335–40. [DOI] [PMC free article] [PubMed] [Google Scholar]
- 53. Yates SF, Paterson AM, Nolan KF, Cobbold SP, Saunders NJ, Waldmann H et al Induction of regulatory T cells and dominant tolerance by dendritic cells incapable of full activation. J Immunol 2007; 179:967–76. [DOI] [PubMed] [Google Scholar]
- 54. Chattopadhyay G, Shevach EM. Antigen‐specific induced T regulatory cells impair dendritic cell function via an IL‐10/MARCH1‐dependent mechanism. J Immunol 2016; 191:5875–84. [DOI] [PMC free article] [PubMed] [Google Scholar]
- 55. Serra P, Amrani A, Yamanouchi J, Han B, Thiessen S, Utsugi T et al CD40 ligation releases immature dendritic cells from the control of regulatory CD4+ CD25+ T cells. Immunity 2003; 19:877–89. [DOI] [PubMed] [Google Scholar]
- 56. Baas MC, Kuhn C, Valette F, Mangez C, Duarte MS, Hill M et al Combining autologous dendritic cell therapy with CD3 antibodies promotes regulatory T cells and permanent islet allograft acceptance. J Immunol 2014; 193:4696–703. [DOI] [PubMed] [Google Scholar]
- 57. Thomas DC, Wong FS, Zaccone P, Green EA, Wallberg M. Protection of islet grafts through transforming growth factor‐β‐induced tolerogenic dendritic cells. Diabetes 2013; 62:3132–42. [DOI] [PMC free article] [PubMed] [Google Scholar]
- 58. Wallberg M, Wong FS, Green EA. An islet‐specific pulse of TGF‐β abrogates CTL function and promotes beta cell survival independent of Foxp3+ T cells. J Immunol 2011; 186:2543–51. [DOI] [PubMed] [Google Scholar]
- 59. Huynh ML, Fadok VA, Henson PM. Phosphatidylserine‐dependent ingestion of apoptotic cells promotes TGF‐β1 secretion and the resolution of inflammation. J Clin Invest 2002; 109:41–50. [DOI] [PMC free article] [PubMed] [Google Scholar]
- 60. Chatenoud L, Primo J, Bach JF. CD3 antibody‐induced dominant self tolerance in overtly diabetic NOD mice. J Immunol 1997; 158:2947–54. [PubMed] [Google Scholar]
Associated Data
This section collects any data citations, data availability statements, or supplementary materials included in this article.
Supplementary Materials
Figure S1. Properties of agly‐anti‐CD3.
Figure S2. Injection of agly‐anti‐CD3 reverses diabetes in non‐obese diabetic mice in a dose‐dependent manner.
Figure S3. Agly‐anti‐CD3 treatment increases the percentage of Foxp3+ regulatory T (T reg) cells through selectively sparing this population.
Figure S4. Treatment with agly‐anti‐CD3 does not cause conversion of islet specific T helper type 1 (Th1) effector cells to Foxp3+ regulatory T (Treg) cells.
Figure S5. Heatmap presentation of microarray data comparing islet specific T helper type 1 (Th1 cells from agly‐anti‐CD3 treated and isotype‐treated mice.
Figure S6. T helper type 1 (Th1) differentiated cells from agly‐anti‐CD3‐treated recipients do not produce interleukin‐10 (IL‐10) when restimulated.
Table S1. All the significantly enriched molecular signatures associated with anti‐CD3 treated or untreated cells are listed.