

During the past few months, mental health has received public and media attention in an unprecedented manner. This was related to the release of the report of the National Mental Health Survey (NMHS).[1]
Media referred to the findings of the report as follows: “India needs to talk about mental illness;”[2] “Every sixth Indian needs mental health help;”[3] “8% of people in Karnataka have mental illness;”[4] “Mental problems more in 30–49 age group or over 60; low income linked to occurrence of mental disorders;”[5] and “urban areas to be most affected”[2] were some of the headlines in the mass media.
The NMHS[1] will be a milestone in understanding the epidemiology of mental disorders in the country. It is against this importance of the survey, the current commentary places the survey in the historical context, describes the methodology of the survey, salient findings and discusses the implications of the survey.
Psychiatric epidemiology has been an area of great interest among all the leading psychiatrists. The other similar area of interest is the psychiatric classifications. In both these fields, there are more “failures” than successes in the past 60 years.
There have been great times and not so great times in the Indian psychiatric epidemiology. It has been well reviewed.[6,7] One of the first studies, a massive plan by Govindaswamy as quoted by[6,7] in the 1st year of the All India Institute of Mental Health, Bengaluru, was so ambitious in identifying the causative factors that it did not get off the planning stage. The next major, a milestone, was the Agra study.[8] This study is significant for the size of the studied population (nearly 30,000 in one study center, as compared to 30,000 + in the National Mental Health survey (NMHS), which is in the focus of the current review) and the identification of factors contributing to mental disorders (rural–urban differences, migrancy, etc.). There were a number of small size studies in the 1960s and 1970s. The most important of these was the “The Great Universe of Kota”[9] considered later.
There was a recognition for the need for a large-scale multicentered epidemiological study in 1976 and the Indian Council of Medical Research Department of Science and Technology (DST) project came up.[7] This was a four-centered epidemiological project in Bengaluru, Baroda, Calcutta, and Patiala. Initially, the study aimed to “estimate the prevalence of psychiatric morbidity at different selected centers and investigate the sociodemographic correlates.” However, midway in the project, the objective was shifted to an interventional study, “develop and evaluate methods designed to reach, and offer services to the sick population.”[7]
There was a lull in general population, psychiatric epidemiological studies till the early 2000. The next major multicentered study using the World Mental Health Survey (WMHS) occurred in the beginning of the current century. It has had challenges is clear from the fact that it is being published only after 12 years of completion of the study (published in the current issue).[10]
The background is important to understand as the NMHS is the most expensive (around Rs. 5 crores), and most ambitious general population epidemiological study undertaken in the country to date. For this reason, it is important to understand the findings in detail and draw lessons for the future.
As a scientific discipline, epidemiology has an important place in health sciences. It was Morris who described the seven purposes of epidemiology. These are: (i) understanding the magnitude of the mental disorders; (ii) the causative factors; (iii) calculating the morbid risk; (iv) monitoring the historical trends; (v) completion of clinical picture; (vi) identification of new syndromes; and (vii) treatment utilization in the community.[11]
NATIONAL MENTAL HEALTH SURVEY METHODOLOGY
The NMHS was undertaken in 12 states across six regions of India (North [Punjab and Uttar Pradesh]; South [Tamil Nadu and Kerala]; East [Jharkhand and West Bengal]; West [Rajasthan and Gujarat]; Central [Madhya Pradesh and Chhattisgarh]; and North-East [Assam and Manipur]). In each state, the dedicated team of investigators included mental health and public health professionals.
A uniform and standardized methodology was adopted for the NMHS. A pilot study was undertaken in the district of Kolar, the Public Health Observatory of National Institute of Mental Health and Neuro Sciences (NIMHANS). The Master Protocol for the study was drafted based on the results from the pilot study and finalized after deliberations with the National Technical Advisory Group and the National Expert Panel and discussions with the state teams. A detailed operational guidelines document was developed to conduct the survey.
The report provides detailed account of the methodology adopted for the study (pages 7–83) and results (pages 84–132) and presents recommendations (pages 138–144).
The methodology adopted was multistage, stratified, random cluster sampling technique, with random selection based on probability proportionate to size at each stage; all individuals 18 years and above in the selected households were interviewed. A subsample was included in four states to examine feasibility of methodology for understanding mental morbidity among adolescents (13–17 years).
The total sample is 34,802 with about 3000 (range: 2479–3508) in each of the states. The NMHS 2015–2016 interviewed 39,532 individuals across 720 clusters from eighty taluks in 43 districts of the 12 selected states. The response rate was 91.9% at household level and 88.0% at individual level. Across the states, the population interviewed were similar to the state population characteristics and also representative of the country as per Census 2011.
Both quantitative and qualitative methods were employed. A set of ten instruments including Mini International Neuropsychiatric Interview (M.I.N.I 6.0) was utilized to identify the cases, household information, sociodemographic details, tobacco use, screening for epilepsy, screening for intellectual disability (ID), screening for autism spectrum disorder, disability assessment, health-care utilization, and socioeconomic impact of illness. After a rigorous 8-week training and microplanning effort, field data collectors undertook door-to-door interviews. The training was participatory and the different methods included classroom sessions, training in the hospital (observation and demonstration of interviews), and training in the community (both supervised and independent) and hands-on training in data collection on tablets. Information was captured on handheld devices, and strict protocols were established for data transfer and management with access controlled mechanisms. To ensure quality apart from rigorous training, weekly and fortnightly review and problem-solving meeting were held both locally and with the NIMHANS team. Data received from all states were examined for errors periodically and regularly and feedback provided to the state team during fortnightly e-reviews. More than 200 such e-meetings were held during the survey period. The weighted estimates for the lifetime prevalence and current prevalence were derived for conditions included in the International Classification of Disease, Tenth Revision, Diagnostic Criteria for Research.
RESULTS
Of the large amount of findings, three of them are vital for understanding of the prevalence, pattern of mental disorders, and the treatment utilization.
First of this is the lifetime and current prevalence for the different states [Table 1].
Table 1.
Crude prevalence rates of mental disorders, tobacco use and suicidal risk (Adapted from Table 13 (p.79) from NMHS[1])

The overall weighted prevalence for any mental morbidity was 13.7% lifetime and 10.6% current mental morbidity.
What is striking is the differing prevalence rates across the centers. The lowest lifetime prevalence of 8.1% in Assam and the highest lifetime prevalence of 19.9% in Manipur have been reported, though they share common background. Similar is the striking 2-fold difference in the lifetime prevalence between Punjab and Uttar Pradesh (18.1% and 8.7%). The same 2-fold difference is seen in the current prevalence rates. Another significant finding is the vast difference in tobacco use (5.4%–39.6%). Furthermore, significant finding are the differences in the reported suicidal risk (2.2%–12.2%).
A number of tables provide the sociodemographic factors and prevalence rates. Currently, only aggregated data are available and not center-specific data. It is interesting to see wide variation in the prevalence rates of different disorders across the states. Explanation for these differences is not currently available [Table 2].
Table 2.
Distribution of mental morbidity across the states, from NMHS, Table 22, Page 121[1]
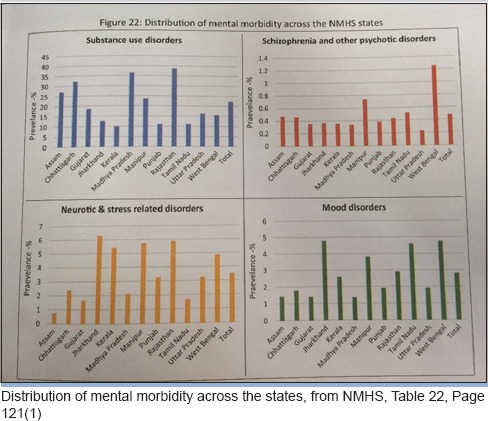
The age group between 40 and 49 years was predominantly affected (psychotic disorders, bipolar affective disorders [BPADs]), depressive disorders, and neurotic and stress-related disorders. The prevalence of substance use disorders was highest in the 50–59 years age group (29.4%). The gender prevalence of psychotic disorders was near similar (lifetime: male: 1.5%; female: 1.3%; current: male: 0.5%; female: 0.4%). While there was a male predominance in alcohol use disorders (9.1% vs. 0.5%) and for BPAD (0.6% vs. 0.4%), a female predominance was observed for depressive disorders (both current [female: 3.0%; male: 2.4%] and lifetime [female: 5.7%; male: 4.8%]) for neurotic and stress-related disorders. Residents from urban metro had a greater prevalence across the different disorders. Persons from lower income quintiles were observed to have a greater prevalence of one or more mental disorders. An individual's risk of suicide in the past 1 month was observed to be 0.9% (high risk) and 0.7% (moderate risk); it was highest in the 40–49 years age group, greater among females, and those from urban metros.
The most striking findings calling for greater analysis is the wide variations in the rates of specific disorders across the states. For example, under “neurotic and stress disorders,” there is a near 10-fold difference between Assam and Jharkhand and Manipur and Rajasthan. It is not clear whether this is a reflection of the social differences, cultural factors, or other variables. A detailed analysis can only give the answers.
ID screener positivity rate was 0.6%; it was greater among the younger age group, among males, and those from urban metro areas. The prevalence of morbidity among adolescents was 7.3% with a similar distribution between males and females (male: 7.5%; female: 7.1%) but was higher in urban metro areas. The current prevalence of anxiety disorders was 3.6%, and depressive disorders was 0.8%.
The third important finding relates to treatment gap. This has serious implications for the organization of services [Table 3].
Table 3.
Treatment patterns and care characteristics (Adapted from Table 36 (Page 126) from NAMS[1]

Treatment gap for mental disorders ranged between 70% and 92% for different disorders: common mental disorder - 85.0%; severe mental disorder - 73.6%; psychosis - 75.5%; BPAD - 70.4%; alcohol use disorder - 86.3%; and tobacco use - 91.8%. The median duration for seeking care from the time of the onset of symptoms varied from 2.5 months for depressive disorder. Of all the findings, the most important from public health point is the long duration of illness of severe mental disorders. In majority of the cases, a government facility was the most common source of care. At least half of those with a mental disorder reported disability in all three domains of work, social, and family life and was relatively less among alcohol use disorder. Greater disability was reported among persons with epilepsy, depression, and BPAD.
These data are the most important for planning of services. However, as the twelve states where the survey was conducted varied widely in terms of the mental health resources (Kerala and Madhya Pradesh are at two extremes), it would have been valuable to see the treatment gap in the different states and across specific mental disorders. It is important to know the contribution of the following factors to the treatment gap, namely, level of mental health infrastructure, the distance (people have to travel to treatment centers, the integration of mental health care in general health care in the study area, the level of stigma attached to mental disorders, the availability of alternative sources of help, and income level of the nonusers of services).
COMMENTARY
In preparation for the current book review, I had communicated with Prof. G. Gururaj and Prof. Mathew Verghese, of the NMHS team, for clarifications on a number of areas of the report. I am thankful for their prompt response. The summary of the response to the same is as follows: “All states are working on state-specific reports in their specific context to bring out state prevalence data along with current status of mental health services. These are in progress and likely to be released in the next few months;” “data from NMHS is available only on different sources for care and has to be analysed.” “Information on how long the person utilised each source is specifically unavailable as various care sources got combined. This will be analysed later for different diagnostic categories;” “being a descriptive study, we have been able to show the associations between different sociodemographic and illness-related variables. Risk factor assessments and quantifications were not part of the study;” “broad conclusions (about literacy) have been drawn on this issue and future analysis will provide more details.” Regarding the 2-fold difference, in the current morbidity, (6.6%–13.4%) across the participating states, “this needs to be analysed further.”
We look forward to the detailed analysis to understand the full implications of the survey.
It is relevant to recall the historic and milestone epidemiological study (The Great Universe of Kota)[9] carried out nearly 45 years back, to understand the approaches used and the findings of the various parameters relating mental disorders/psychiatric symptoms. This study of 1233 adults in one center examined the relationships between “case rate” and sex, education, income, marital status, caste, and social change. Further, it presented psychiatric symptom distribution in relation to sexes, castes, and the occurrence of somatic symptoms and possession states. The study also gave information about the ability to cope, social functioning, consultation pattern, role of social stress, and the need for treatment. This report could provide a framework for the analysis of state level data and reporting of findings.
With such an analysis, there would be greater possibility of understanding the associations of sociodemographic and other factors and prevalence rates and treatment utilization rates across the states.
This type of analysis is awaited, as noted by the NMHS team and state centers.
The NMHS is important for the following reasons:
First, this survey in 12 centers provides an important reference point about mental disorders in the community. Taking the earlier WMHS (reported in this issue of the journal)[11] covering ten states, we have a rich baseline to plan services at the level of prevention, promotion, and treatment of mental disorders.
Second, the methodology and the use of information technology used for the survey is a major methodological advance in psychiatric epidemiology in the country.
Third, it has provided insights into the prevalence of different mental disorders in 12 centers and some sociodemographic associations of these disorders.
Fourth, the current level of treatment utilization and the large treatment gap among all the disorders is a cause of concern. This is especially so, as India completes 35 years of the National Mental Health Programme, formulated in August 1982. There is much cause for concern, for the relative failure to educate the population, decrease stigma, and empower the primary health-care personnel to initiate care at their level to reach the population in need of services. It is not sufficient to call for more of the same measures implemented during the past few decades. To that extent, the survey provides a wake-up call to redesign mental health care in the country.
The issues relating the mental health systems have been covered in the second part of the NMHS as well as by the National Human Rights Report of 2016. These will be covered in the next issue of IJP.
There are some areas of concern, arising from the survey.
The limited scope of the NMHS[1] and the WMHS[11] calls for comment.
Traditionally, the purpose of epidemiology is to address seven aspects of understanding health and illness conditions [Box 1].
Box 1.
Recent epidemiological studies in India

It is significant that only two of the seven purposes of an epidemiological survey have been fulfilled. Of these two aspects also, there is limited information. The NMHS was possibly not powered to address severe mental disorders and both the surveys for the understanding of the biosocial variables related to mental disorders.
Currently, the treatment-seeking information is available to the total sample and not for the individual disorders at each of the centers. With widely varying levels of mental health-care infrastructure, it would have added much value to know the impact of the differing levels of mental health care in the community and the treatment gaps.
The identification of etiological factors has occurred at a very limited level. The study being conducted in a large number of sites with wide variations in potential etiological factors such as level of poverty, literacy, status of the two sexes, the cultural beliefs and practices relating to distress, disease and help-seeking behavior, and comorbidities has been lost. There are many reasons for this failure of the survey. The sample sizes chosen for the individual centers were small to bring out the differential contribution of these factors. The more than two fold difference between the twelve states surveyed (prevalence rate has not been broken down across the diagnostic groups and participating centers), to see the possible correlation with the prevalence rates of the syndromes and the etiological factors in the different study centers. This limitation of the NMHS and WMNH survey is especially important as preventive, promotive efforts can only come from such an identification etiological associations and possible causation.
The lack of reference to objectives relating to the syndromal description and identification new syndromes suggests that the survey was not geared to look for this aspect of distribution of mental disorders. It seems to have decided on what to find and found them (the much talked about “suitcase syndrome” - you find what you have put into the suitcase).
CONCLUSION
In India, psychiatric epidemiology remains a challenge. This was noted succinctly in 1976 by Carstairs and Kapur[9] as follows:
“Cross-cultural comparisons for determining the relative significance of environmental factors in the development of mental disorder. However, researchers engaged in such comparisons face two major problems: that of establishing comparable definitions of psychiatric symptoms across cultures and the lack of suitable techniques for measuring the relevant sociocultural parameters. They also share with psychiatric epidemiologists in general the difficulty of developing reliable and valid methods of defining a case in a nonreferred population and of separating those in greater need of attention from the others. It was against this background that the Kota study was designed.”
The NMHS team - NIMHANS and state centers are to be congratulated for undertaking of this massive study. There is urgent need for in-depth analysis of the state reports and to keep these aspects in future studies in selecting the sample and methodology.
This survey should be in every medical college and read by all mental health and public health professionals of the country.
REFERENCES
- 1.National Mental Health Survey of India, 2015-2016 Prevalence, Patterns and Outcomes, Supported by Ministry of Health and Family Welfare, Government of India, and Implemented by National institute of Mental Health and Neurosciences (NIMHANS) Bengaluru: In Collaboration with Partner Institutions; 2015-2016. [Google Scholar]
- 2.Afshan Y. India needs to talk about mental illness, The Hindu, 23 October. 2016 [Google Scholar]
- 3.The National Mental Health Survey of India, 2015–16, Insights, 31, December. 2016 [Google Scholar]
- 4.Every sixth Indian needs mental health help: report, Matters India, 12 October. 2016 [Google Scholar]
- 5.Health survey reports released, Deccan Herald, December 28. 2016 [Google Scholar]
- 6.Gururaj G, Girish N, Isaac MK. Mental, neurological and substance abuse disorders: Strategies towards a systems approach. In: Rao S, editor. NCMH Background Papers: Burden of Disease in India. New Delhi: Ministry of Health and Family Welfare; 2005. [Google Scholar]
- 7.ICMR-DST(1987) Collaborative study of severe mental morbidity. New Delhi: ICMR; 1987. pp. 623–54. [Google Scholar]
- 8.Dube KC. A study of prevalence and biosocial variables in mental illness in a rural and an urban community in Uttar Pradesh – India. Acta Psychiatr Scand. 1970;46:327–59. doi: 10.1111/j.1600-0447.1970.tb02124.x. [DOI] [PubMed] [Google Scholar]
- 9.Carstairs GM, Kapur RL. The Great Universe of Kota. London: Hogarth Press; 1976. [Google Scholar]
- 10.Sagar R, Pattanayak RD, Chandrasekaran R, Chaudhury PK, Deswal BS, Singh RK, et al. Twelve-month prevalence and treatment gap for common mental disorders: Findings from a large-scale epidemiological survey in India. Indian J Psychiatry. 2017;59:46–55. doi: 10.4103/psychiatry.IndianJPsychiatry_333_16. [DOI] [PMC free article] [PubMed] [Google Scholar]
- 11.Morris JN. Uses of Epidemiology. 3rd ed. Edinburgh: Churchill Livingstone; 1975. [Google Scholar]