

Abstract
Cardiovascular diseases are a consequence of genetic and environmental risk factors that together generate arterial wall and cardiac pathologies. Blood vessels connect multiple systems throughout the entire body and allow organs to interact via circulating messengers. These same interactions facilitate nervous and metabolic system influence on cardiovascular health. Multiparametric imaging offers the opportunity to study these interfacing systems’ distinct processes, to quantify their interactions and to explore how these contribute to cardiovascular disease. Noninvasive multiparametric imaging techniques are emerging tools that can further our understanding of this complex and dynamic interplay. PET/MRI and multichannel optical imaging are particularly promising because they can simultaneously sample multiple biomarkers. Preclinical multiparametric diagnostics could help discover clinically relevant biomarker combinations pivotal for understanding cardiovascular disease. Interfacing systems important to cardiovascular disease include the immune, nervous and hematopoietic systems. These systems connect with ‘classical’ cardiovascular organs, like the heart and vasculature, and with the brain. The dynamic interplay between these systems and organs enables processes such as hemostasis, inflammation, angiogenesis, matrix remodeling, metabolism and fibrosis. As the opportunities provided by imaging expand, mapping interconnected systems will help us decipher the complexity of cardiovascular disease and monitor novel therapeutic strategies.
Keywords: systems biology, cardiovascular disease, imaging
Introduction
Cardiovascular disease affects blood vessels throughout the body and therefore leads to co-morbidities in multiple organs. Traditionally, cardiovascular research has focused on vital organs, including the heart or brain after ischemic infarction, and on large vessels with atherosclerotic lesions. Decades of research targeting cardiovascular tissues have built a broad base of knowledge on the cellular and molecular mechanisms underlying atherosclerosis, stroke and heart failure. At the same time, we increasingly understand that the immune, nervous and hematopoietic systems influence cardiovascular disease, though many of the mechanisms remain to be uncovered (Fig. 1).
Figure 1.

Immune-cardiovascular, hematopoietic and nervous system interactions forming a circuit in cardiovascular disease.
Imaging research has often focused on only one biomarker at a time. Recent technological advances have led to multichannel data acquisition that provides multi-biomarker information on metabolic, cellular or molecular processes. A whole new set of questions could be addressed by investigating simultaneously multiple biomarkers during cardiovascular disease. Of particular interest, and now potentially accessible, are the interactions between the molecular and cellular processes initiating cardiovascular disease. Which organ systems are involved in disease initiation? How do multiple biomarkers interact to promote disease? Does multimodal imaging of several biomarkers increase assay sensitivity and specificity?
In this review we argue that multiparametric imaging can provide data on system interactions and thus connect traditionally-separated fields of investigation. Our review’s focus is on the most common appearances of cardiovascular disease, namely atherosclerotic blood vessels leading to myocardial infarction or stroke. We will discuss on multichannel optical and hybrid positron emission tomography / magnetic resonance imaging (PET/MRI), because these modalities have evolved rapidly and will provide, in our opinion, the most data-rich insight at both the basic science and translational levels. More specifically, preclinical optical and PET/MR imaging can provide orthogonal, quantitative data on two or more biomarkers, which, if well chosen, may provide different perspectives on disease pathways. Below we first describe selected imaging approaches’ capabilities and advances and then detail how these approaches have been used in multiparametric data acquisition to address complex biological questions. We also discuss how imaging may help uncover interactions between cardiovascular and other organs.
Multichannel optical imaging
The most commonly employed intravital microscopy techniques for real-time and longitudinal imaging of dynamic processes are confocal, two-photon or multiphoton microscopy1, 2. Optical imaging is based on photon detection and allows the simultaneous study of multiple fluorescent proteins with unique, separable wavelengths. In order to distinguish and follow cells in vivo, molecules or cells have to be labeled. Labeling can be either genetic or chemical. Genetic labeling (of stromal and immune cells, among others) is based on gene expression reporting via a fluorescent protein such as green or yellow fluorescent protein (GFP or YFP)3. Chemical labeling via injectable imaging agents includes fluorescently-labeled antibodies for surface antigens and fluorescently-labeled imaging agents that are taken up by cells such as macrophages. Labeling with cytosolic or membrane dyes requires adoptive transfer of cells harvested from a donor. Finally, vascular and activatable dyes can visualize the intravascular space and enzymatic activity in tissues4, 5. Multiphoton microscopy also detects second harmonic generation (SHG) signals arising from collagen without exogenous labeling. SHG light is emitted at exactly half the wavelength of the exiting photons entering the tissue6.
Several limitations of intravital microscopy are well recognized. First, the background signal from naturally fluorescent cellular components, also known as autofluorescence, typically lowers the signal-to-background ratio. Second, because intravital microscopy has limited tissue penetration, its imaging depth is always less than 800 μm and often much less than that. Third, longer excitation of some sensitive fluorescent proteins can render them non-fluorescent, a process called photobleaching. Two- or multiphoton microscopy overcomes these hurdles, and thus has advantages over confocal microscopy, because the laser selectively excites a specific focal plane where the two photons coincide, thereby allowing deeper imaging with less photobleaching and a lower autofluorescence signal7. Additionally, newer fluorescent proteins have emission and excitation wavelengths with deeper tissue penetration and increased signal-to-background ratio for more efficient in vivo use8, 9.
The limited depth penetration of light often necessitates delicate mouse surgery to access organs of interest. It is crucial to avoid damaging the imaged tissue, to keep it at physiological temperature and to maintain blood flow to the area. For example, the frontoparietal skull is exposed to visualize hematopoietic stem cells (HSCs) in their niche 10, 11. Exposing the brain by either thinning the skull12 or a small craniotomy13 makes it possible to visualize cerebral processes 14. Organ systems such as the spleen15, 16, liver17 or lymph nodes18 can be exposed through surgical procedures and windows. Since motion due to respiration and blood vessel pulses can cause artifacts, accurate imaging requires tissue immobilization and deep anesthesia. In the heart19 and major arteries20, acquisition gating and postprocessing methods used in conjunction with tissue stabilizers have recently overcome motion artifacts (Fig. 2A).
Figure 2.

(A) Intravital imaging of structure and function in the beating heart at cellular resolution. From Vinegoni et al.19. (B) Serial intravital microscopy of increased hematopoietic stem cells (HSC), sorted and labeled ex vivo with DiD (1,1′-dioctadecyl-3,3,3′,3′-tetramethylindodicarbocyanine perchlorate) fluorescent dye, reporting on their expansion in the bone marrow of mice with stroke. Serial intravital microscopy of the mouse calvarium 1 day before and 3 days after transient middle cerebral artery occlusion (tMCAO). Blue color represents the fluorescence signal produced by the bone imaging agent Osteosense-750; the fluorescence lectin signal stained blood vessels in red. DiD-labeled HSC are shown in white. From Courties et al.5. (C) Intravital microscopy of macrophages egressing the spleen after MI. From Swirski et al.15. (D) Triggered intravital multiphoton imaging of an atherosclerotic artery. Maximum intensity Z projections of the 3D movie of live CX3CR1GFP Cd11cYFP atherosclerotic apolipoprotein E knock out (ApoE−/− ) mouse. Green—GFP+ cells; orange—YFP+ cells and blue—collagen. From McArdle et al.20.
Several new developments have made optical imaging a highly useful research tool. For example, multiphoton microscopy can now detect a larger palette of fluorescent probes in a living mouse14. This is particularly interesting when combined with genetic constructs to follow clonal cell populations such as “Brainbow” in neurons21 or, more recently, “HUe” in bone marrow HSCs 22. These approaches are transgenic strategies to combinatorially express fluorescent proteins that visualize synaptic circuits by genetically labelling cells with 90 hues for Brainbow or even, theoretically, >103 colors for Hue and then tracking the labelled cells over prolonged space in the organ or temporal periods (weeks or months)21, 22. In another innovative method, optogenetic tools use genetically modified cells (typically neurons) to express light-sensitive ion channels like channelrhodopsin. This (neuro) modulation method controls cell activity, which can then be optically recorded with the help of optical activity sensors such as calcium (GCaMP)23. Calcium imaging has recently been used to map neural activation patterns while mice ran on treadmills. Later, when mice were resting, those neurons reactivated, which suggests mice retrieve memories of earlier exercise24. In the heart, voltage and calcium optical mapping has been extensively performed using the Langendorff method. Optogenetic tools have recently been implemented in cardiomyocytes in vivo by optically-pacing light-sensitive ion channels25. Optical calcium mapping depicted subsequent myocardial activation25. Additionally, ex vivo optical imaging by confocal and two- or multiphoton microscopy has made some major advances as tissue clearing has become available. Solvent-based or aqueous-based clearing reduces light scatter’s obscuring effects in tissue samples, thereby assuring a low uniform scatter. New reagents such as aptamers and single-domain antibodies facilitate immunostaining in thick tissues to produce snapshot views of entire organ systems with microscopic resolution26.
Deep tissue optical imaging has limited resolution because photon scattering leads to insufficient signal and reduced sensitivity. In vivo optical imaging techniques that can overcome this limitation include optical frequency domain imaging with wide-field imaging27, fluorescence-mediated tomography (FMT) in combination with computed tomography (CT)28 and fiber-optic microscopy29. Optoacoustic imaging combined with MRI has also been used to visualize cellular and biological processes in preclinical settings, often with only one or dual channels for imaging biological processes30. Optically-visualized targets in mice can be translated towards clinical applications by switching from fluorescent beacons to PET isotopes31. Radioisotopes solve the problem of agent detection in deep tissues where microscopic resolution is insufficient. Several studies have shown the exquisite match between optical and radionuclide labels in interrelated systems32.
Hybrid PET/MRI
Following the development of PET detectors that are functional in high magnetic fields, hybrid PET/MRI is a unique modality combination that has emerged in the last decade, as preclinical and clinical integrated systems have become available33. Initially, PET and MRI were combined in order to compare them34, but the combined modality has proved to be immensely useful. The technology combines PET’s high sensitivity for radionuclide tracers that track biological processes with MRI’s versatile applications and high resolution at any depth of practical interest. Different imaging techniques use different energy spectra to derive images. While optical imaging relies on detecting photons, MRI employs sound waves and PET uses gamma-rays. The synergistic effect of combining PET and MRI has had numerous oncological, neurological and cardiovascular applications over the last few years35.
MRI has a wide range of preclinical and clinical applications in cardiovascular disease and beyond. In addition to excellent spatial resolution and soft-tissue contrast for morphological information, MRI has the advantage of being able to visualize biological processes, molecular targets and MR reporter genes. When directed at organ systems that contain water molecules, MRI displays proton signals inside a strong magnetic field, precessing after a radio-frequency pulse and forms images by either longitudinal and transverse relaxation times, T1 and T2/T2*. Although it most frequently uses water protons (1H), MRI can image other nuclei, including carbon-13 (13C), fluorine-19 (19F) and phosphorus-31 (31P). Additional MRI advancements comprise T1ρ, arterial spin labeling (ASL), MR angiography, diffusion, hyperpolarized metabolic and magnetization transfer imaging36, 37. In the brain, Blood Oxygenation Level Dependent (BOLD) contrast studies, referred to as functional MRI (fMRI), are widely used to assess brain function38. Conventional contrast agents such as Gadolinium (Gd) chelates and ultra small iron oxide particles (USPIOs) alter T1 or T2/T2* relaxation of water protons, respectively, and can be used for molecular targeting. Multiple Gd chelates can be linked together via a targeted carrier, such as a nanoparticle, to amplify the signal and improve sensitivity. Other recently-developed contrast agents include exchange saturation transfer (CEST) agents and 19F perfluorocarbon nanoparticles36. To obtain motion-artifact-free images of a pulsing vessel or beating heart, postprocessing, hardware advances and improved image acquisition schemes have led to additional cardiovascular applications including diffusion MRI tractography39, 19F imaging40, contrast enhanced MRI41 and CEST 42.
Positron emission tomography (PET) is a radionuclide-based technique that detects pairs of gamma rays emitted by a positron-emitting radionuclide. PET is a commonly-used translatable imaging technology sensitive to picomolar concentrations of biomarkers. PET tracers are labeled with positron-emitting radionuclides (e.g. 11C, 13N, 15O, 18F, 64Cu, 68Ga and 89Zr) produced in a generator or cyclotron. These radionuclides can be incorporated into chemicals that are normally processed by the body, such as glucose, water or ammonia, or into imaging agents that bind to receptors. Once injected, these radiotracers may report on specific biological processes. Although it entails radiation exposure, low spatial resolution and the need for a generator or cyclotron to produce radionuclides, PET has tremendous potential for developing sensitive tracers that can target biological processes. The most frequently used radiotracer is 18F-fluorodeoxyglucose (FDG) for glucose uptake43–50. Examples of other PET tracers with potential relevance for cardiovascular imaging include 11C-PK11195 for macrophage activity (and inflammation)51, 11C-hydroxyephedrine PET for sympathetic innervation52–54, 13N-ammonia for blood flow47, 18F-sodium fluoride (NaF)55 and 15O-H2O for perfusion52–54. Attenuation in PET imaging happens when photons emitted by the radioisotope are absorbed by tissue before reaching the PET detector. Despite well-standardized attenuation correction for combined CT imaging, generating accurate attenuation corrections for MR-based approaches remains a challenge in PET/MRI. This remains particularly challenging for cardiac applications due to cardiac motion or in patients with implants35.
Using PET/MRI to follow biomarkers provides opportunities for phenotyping, early diagnosis and measuring therapeutic efficacy in cardiovascular disease. One advantage of PET/MRI compared to PET/CT is the relatively low radiation doses, facilitating serial imaging or the use of multiple PET tracers. The second advantage of MRI over CT is its capability to provide detailed soft tissue contrast of the brain, carotids and myocardium. Only for imaging of coronary arteries, MRI has limited robustness compared to CT35. MRI-based cardiac and respiratory motion correction can additionally enhance both MRI and PET image qualities as well as PET-based quantification35. Both PET and MR reporter gene expression imaging are expanding and now have the potential to serially track cells 56–58, especially with CRISPR/Cas9 gene editing rapidly gaining popularity. Hybrid PET/MRI can yield quantitative information on several biomarkers simultaneously, which is a unique advantage for a clinical modality. Theoretically, two or three molecular or cellular processes could be imaged in one setting, for instance by using molecular imaging agents labeled with 18F (detected by PET), Gd and 19F (detected by MRI). While very small amounts of a biological marker can be traced with high sensitivity by 18F PET, MRI can not only provide a high-resolution anatomical read-out but also, after injection of Gd as an MR contrast agent, specifically follow enhancement of large vessels or infarcted regions. Furthermore, after injection of perfluorocarbon emulsions, MRI can use 19F to follow local inflammation with very high specificity40. A hypothetical preclinical scenario of multiparametric PET/MRI combines specific MR reporter genes to track progenitor cells, diffusion MRI tractography to detail neuronal or myocardial microstructure39 and 11C-PK11195 PET to image macrophages51 in the infarct. By using 11C-PK11195 PET to visualize the proportion of these cells differentiating towards activated macrophages and diffusion MRI tractography to determine how the inflammatory reaction affects vital connective networks, this approach could give insights on how progenitor cells are recruited to the ischemic region, and how such an intervention influences tissue architecture.
Immune - cardiovascular system interactions
During acute cardiac disease, immune cells are recruited to either the atherogenic vascular regions in large vessels or the ischemic cardiac tissue. Multiparametric imaging can help uncover systemic interactions between the immune system and the cardiac or vascular tissues. The major hurdle for imaging large vessels and the heart is motion from a pulsing artery, a beating heart or respiration. Cardiac contractions, and artery pulsations are several orders of magnitude larger than cellular motion or molecular interactions, both of which can be more easily followed by imaging. The technical challenge of correcting for respiratory or contractile motion means cardiovascular imaging applications have not advanced as much as neurological or oncological imaging applications, in which organ motion plays a lesser role. Nevertheless, various multichannel imaging studies, using optical applications and PET/MRI in preclinical and clinical settings, illustrate the interplay between inflammation and cardiovascular disease. More specifically, several studies seek to image immune cell interactions in atherosclerotic plaques and cardiac ischemia in connection with the hematopoietic system.
Vascular inflammation
Because neither respiratory nor pulsatile motion affect it, the inflamed ear vasculature has been a straightforward model to follow movement and interaction of three cell types simultaneously: CX3CR1GFP macrophages, LysMeGFP neutrophils and NG2DsRed pericytes around vessels59. Imaging showed that NG2DsRed pericytes expression increased adhesion molecule ICAM-1 during innate immune responses59. The inferior vena cava’s large size and minimal pulsatile motion make it well suited to intravital two-photon microscopy, which was used to image the recruitment of adherent platelets (CD41) and neutrophils (LysMeGFP) to the blood vessel wall (SHG) in a deep venous thrombosis model60. Further, correcting for respiratory and pulsatile arterial motion in atherosclerosis-prone large arteries has allowed leukocyte accumulation to be visualized at subcellular resolution61. Using intravital imaging, different inflammatory leukocyte subsets within the carotid arteries of athero-susceptible mice have been identified in vivo. As a proof of concept, the adhesion molecule VCAM-1, myeloid cell polarization detector CD62L and platelet marker CD41 were imaged in relation to leukocyte interactions. Also, distinct leukocyte subset behaviors were simultaneously imaged with genetically-altered athero-prone mice that express GFP in leukocytes and with labeled antibodies against CD4, CD8 and Ly6G to identify different subsets recruited to the carotid bifurcation. This approach revealed increased numbers of rolling neutrophils over time. This rolling behavior was not observed in monocytes, thereby pointing out different recruitment kinetics for myeloid subsets61. Triggered multiphoton imaging revealed CX3CR1GFP monocytes patrolling the lumen of atherosclerotic arteries. Additionally, multicolor plaque imaging in atherosclerotic ApoE−/− mice tracked fluorescent subsets of macrophages (CX3CR1GFP), dendritic cells (CD11cYFP) and collagen (SHG) during disease progression. CX3CR1GFPCD11cYFP macrophages exhibited “dancing on the spot” behavior with extending and contracting cell processes, and CD11cYFP dendritic cells migrated within intimal plaque in athero-prone segments of the murine carotid artery (Fig. 2D)20. In the future, these imaging techniques, which suppress motion artifacts, will provide a platform to follow the early molecular and cellular interactions that cause atherosclerotic events within the arterial wall.
Multichannel vascular imaging can also be achieved by hybrid PET/MRI. The main advantage of using PET/MRI is that MRI’s enhanced soft-tissue contrast, compared to CT, can easily delineate the outer vessel wall62–64. Structural MRI combined with 18F-FDG PET has identified and characterized vascular inflammation in the carotid artery by glucose uptake into macrophages in atherosclerotic62 and athero-prone63, 64 vessels. A preclinical dual PET/MR fibrin imaging probe combined PET’s sensitivity with MRI’s high spatial resolution using a Gd-based fibrin-targeted EP-2104R with partial exchange of Gd for copper 64 (64Cu) to simultaneously image a rat arterial thrombus model of the carotid artery. This combination provided a continuum of detectability between the lowest concentration of tracer, as detected with PET, up to a high concentration and accurate localization of tracer, visualized by MR imaging. Further, MR imaging could accurately identify vessel walls by MR angiography, while fibrin was present at adequate concentrations in many clots for MR detection using T1-weighted molecular imaging of the Gd-based probe. PET’s higher sensitivity could be beneficial for very fresh or small clots. This is a synergistic example of how dual-modality molecular probes can boost diagnostic confidence since artifacts diverge between modalities. Moreover, dual imaging may eliminate the need for a pre-injection baseline MR examination because co-localizing the PET signal would confirm the probe presence65. Although vessel wall MRI has better soft-tissue contrast, CT imaging can easily delineate areas of macrocalcification within blood vessels. Combined vascular CT with 18F-NaF PET for microcalcification can non-invasively detect a range of calcification sizes in active unstable atherosclerosis55. Vascular calcification is highly associated with high-risk patients55. Research on vascular mineralization will benefit from noninvasive imaging studies at a systems level, elucidating the systems link between the phenotype of bone-marrow derived immune cells on the one hand and vascular mineralization on the other hand. As the field of vascular imaging expands and technologies for motion-artifact-free images become available, many questions about the pathogenesis of atherosclerosis remain to be answered. Which endothelial events initiate plaque development? Which combination of biomarkers can reveal interactions in time and space during the development of vulnerable atherosclerotic plaques? One option for future multichannel large vessel imaging could be VCAM-1 detection by MRI66, combined with MR angiography, immune cell tracking and 64Cu fibrin PET65. Imaging interactions could report on immune cell VCAM-1 adhesion to the walls of large vessels, 64Cu fibrin PET could visualize activation of clotting in these vessels, and MR angiography could image vessel walls at high resolution.
Cardiac inflammation
Cardiac and respiratory tissue motion reduce spatial and temporal imaging resolution during cardiac intravital microscopy. Recent advances that combine thoracic surgery, tissue stabilizers and acquisition gating methods have enabled single-cell resolution imaging in the beating mouse heart (Fig. 2A)19, 67. C57BL/6 hearts heterotopically transplanted into LysMGFP mice or orthotopic native LysMGFP hearts have been imaged by two-channel intravital microscopy. To reduce tissue motion, cardiac tissue was stabilized, and Z-stack acquisition was synchronized with heart rate. Time-lapse imaging revealed LysMGFP neutrophils recruiting and firmly adhering to the coronary endothelium, and extravasating from coronary veins (labeled with nontargeted Q-dots). Neutrophils then infiltrated the myocardium and eventually formed large cell clusters. Similarly, time-lapse imaging also visualized neutrophil adherence to endothelium and extravasation by grafting mutant hearts for ICAM-1 (important for neutrophil recruitment), Mac-1 (a receptor for ICAM-1) and LFA-1 (another ICAM-1 binding integrin)67. Also endoscopic time-lapse imaging of the heart has shown CX3CR1GFP monocytes patrolling at cardiac vessels and infiltrating after acute infarction68 (Supplemental movie 1, 2). More recently, cardiac optogenetics has been used to investigate cardiac pacing and resynchronization via channelrhodopsin transgene at ventricular sites in rats25. This imaging technique will enable future studies to map functional myocardial organization and cardiac pacing.
Combined optical FMT and MRI has noninvasively imaged myocardial macrophage infiltration post-MI in mice with dual-labeled magnetofluorescent CLIO-Cy5.5 nanoparticles taken up by macrophages69. Further, multispectral FMT/CT combined with serial MRI has explored monocyte and macrophage source, tissue kinetics and clearance post-MI during post-MI cardiac wound healing in splenectomized and non-splenectomized mice70. More specifically, FMT imaging combined with anatomical CT tracked three interconnected healing biomarkers: myeloid cells with CLIO-633, proteolysis with Prosense-750 and angio-genesis with IntegriSense-800. Splenectomized mice showed fewer accumulated myeloid cells, which produce proteases and enhance angiogenesis. Accordingly, serial cardiac MRI detected an adverse left ventricular function outcome. These imaging data confirmed the role of the spleen in myocardial healing post-MI70.
Combined 18F-FDG PET and LGE MRI has been used to explore post-MI myocardial inflammation in mice and patients, revealing high 18F-FDG uptake by inflammation after MI. A few post-MI cardiac studies have used PET with late Gd enhancement (LGE) by MRI to colocalise viable and metabolically active cells’ 18F-FDG uptake to the increased extracellular space associated with scar tissue. Additionally, a preclinical study verified 18F-FDG activity in infarct myeloid cells44. Yet 18F-FDG is not specific for inflammatory cell activity in the heart, as it also acutely delineates glucose utilization in dysfunctional but viable cardiomyocytes after MI. Combining 18F-FDG PET with LGE MRI, both methods were used after acute myocardial infarction (AMI) to evaluate improved LV function in patients early again 6 months later. PET measured regional FDG uptake, whereas LGE MRI measured scar transmurality. The simultaneous assessment of FDG PET and LGE MRI, using a hybrid PET/MRI system, more accurately predicted the regional outcome of wall motion acutely after MI. In a small proportion of segments with discrepant FDG PET and LGE MRI findings, FDG uptake was a better predictor of functional recovery in patients71.
The confounding uptake of 18F-FDG in high-metabolism cells, such as myocardial and skeletal muscle, hamper accurate quantification of inflammation. To address this, new molecular imaging agents that specifically target activated inflammatory cells in the post-ischemic myocardium are being developed. For example, CXCR4 receptor is a potential molecular target for multiparametric imaging to identify activated inflammatory cells in human post-ischemic myocardium. The CXCR4 receptor is highly expressed by leukocytes that infiltrate inflamed tissues. A PET ligand for CXCR4, 68Ga-pentixafor, has been imaged with simultaneous LGE MRI for scar size and a near-simultaneous Tc-99m sestamibi single-photon emission computed tomography (SPECT) scan for perfusion on day 3 after MI. The LGE-enhanced transmural scar tissue revealed no perfusion by SPECT. PET images showed high 68Ga-pentixafor signal for CXCR4 expression in the LGE-enhanced infarct area, thereby indicating active inflammatory processes at the site of under-perfused infarcting myocardium72.
Combined optical and PET/MR imaging of macrophages after MI quantified tissue macrophages non-invasively using fluorescently-labeled VT680 and 18F-labeled Macroflor. The affinity of Macroflor, a modified polyglucose nanoparticle, to macrophages was examined by time lapse optical imaging. Intravital microscopy displayed extravasation and cellular uptake kinetics in CX3CR1GFP reporter mice: 30 minutes after injection, Macroflor nanoparticles cleared from the blood stream and colocalized with CX3CR1GFP macrophages in the myocardium (Fig. 3A, B)32. The optical time-lapse data on uptake by macrophages revealed that these nanoparticles were ingested by macrophages within a time frame that enables 1PET imaging with the short isotope blood half-life of 18F (~20 min). Consequently, 18F-Macroflor PET imaging was established in mice and rabbits to report on macrophages in ischemic heart disease and atherosclerosis. Dual-target PET/MR imaging provided macrophage quantification by 18F-Macroflor PET combined with molecular MR sensing of myeloperoxidase, an enzyme produced by inflammatory macrophages, at two time points after MI. The 18F Macroflor signal indicated slightly more macrophages at the resolution phase of infarct healing on day 6 post-MI compared to the inflammatory phase at day 2 after MI. The simultaneously-measured myeloperoxidase MR signal decreased from day 2 to day 6 post-MI, which is consistent with inflammation resolution. Conversely, ApoE−/− mice after MI showed increased atherotic plaque signal in both channels, thereby identifying disease-promoting inflammation post-MI. Thus, these two imaging biomarkers could identify macrophage number (by Macroflor PET) and phenotype (by myeloperoxidase MRI) to uniquely differentiate between increasing and resolving inflammation (Fig. 3C–E; Supplemental movie 3)32.
Figure 3.

Longitudinal polyglucose nanoparticle Macroflor optical and PET/MR imaging to non-invasively monitor macrophage biology in cardiovascular disease. (A) Intravital dynamic confocal microscopy of Macrolite taken up by cardiac macrophages in a CX3CR1GFP reporter mouse. Green GFP signal indicates cardiac macrophages and red VT680 signals designates Macrolite. The 0 minute image was acquired prior to fluorescent probe injection into the tail vein. Intravascular signal was detected 2 minutes later, while the 30 minute time point illustrates co-localized Macrolite and GFP+ macrophages with (B) a higher magnification image co-localizaling Macroflor and macrophage signals. (C) Dual channel macrophage PET/MRI in ischemic heart disease shows macrophages and myeloperoxidase on (C) days 2 and (D) 6 post MI. White dotted line on PET/MRI outlines myocardium. Yellow dashed line on MRI outlines the infarct as identified by gadolinium enhancement and wall motion abnormality in cine loops. (E) In vivo PET standard uptake value (SUV) in infarct zone on days 2 and 6 post MI. (F) In vivo MRI contrast to noise ratio (CNR) in infarct 90 min after IV myeloperoxidase -Gd injection. From Keliher et al.32.
Autonomous innervation of the heart is typically followed noninvasively using a PET tracer, as sympathetic denervation occurs in the infarcted myocardium73. Multichannel imaging that tracks biomarkers for autonomous nervous interactions, perfusion and inflammatory players in cardiovascular disease could be instructive for understanding disease progression. Two recent studies combined three biomarkers: LGE MRI for function and scar size, 15O-H2O for perfusion and 11C-hydroxyephedrine PET for sympathetic innervation in patients. Myocardial blood flow and sympathetic innervation in non-infarcted remote myocardium was linked with cardiomyopathy54, 74. High 11C-hydroxyephedrine, a signal of sympathetic myocardial innervation, was strongly related to hyperaemic perfusion and contractile function in the remote myocardium of infarcted hearts74. Low 11C-hydroxyephedrine, a signal of defects in sympathetic innervation, correlated with total scar size on LGE-MRI but did not correlate with the perfusion defects. The 15O-H2O perfusion defects appeared smaller than the 11C-hydroxyephedrine innervation defects. These findings shed light on pathophysiological processes in heterogeneous scars54. Stress, related to the proliferation and release of hematopoietic progenitor cells, can also affect sympathetic innervation in cardiovascular disease, as will be discussed below.
Going forward, multiparametrical optical and PET/MRI combinations may synergistically elucidate the pathophysiology of local, systemic and remote inflammation during cardiovascular disease. Putative examples of interesting multiparametric strategies include the combined water diffusion imaging for cardiomyocyte fiber tracking, cardiac 19F MRI for macrophages with CXCR4 PET imaging by 68Ga-pentixafor for activated inflammatory cells or PET using 11C-hydroxyephedrine to dectect sympathetic innervation. These multichannel approaches could also enhance understanding of separate imaging technologies’ specificity. More importantly, these combined techniques can report on early biomarker interactions among the pathophysiological processes that lead to heart failure; such information can then be used to predict disease, therapeutically intervene and monitor disease progression. For example, imaging could reveal post-MI interactions, between cytokines and inflammatory cells, that orchestrate pathogenic changes such as rearranging myocardial fibers.
Nervous system interactions
After stroke, microglia are activated, and circulating immune cells migrate to the ischemic region. Neurons in the affected area die, resulting in temporary or permanent neurological deficits. Inflammatory processes and neuronal (dys)function following stroke can be mapped using multichannel imaging. Imaging nervous systems interactions can highlight this vital system’s responses in cardiovascular disease. First, we will review imaging applications that focus on post-stroke inflammatory interactions and subsequent connectivity loss between neurons. We will then review relevant optical and PET/MR imaging applications for the central nervous system with a focus on potential markers for imaging immune interactions and nervous connectivity after stroke. Studies that address nervous system interconnections with the hematopoietic system will be described in a later section on hematopoietic system interactions.
Central nervous system interactions
Intravital two-photon imaging of blood vessels using fluorescent dextran has visualized endothelial integrity after stroke75–77. The microscope’s lasers have also been applied to the rat cortex to occlude one specific vascular lumen in the presence of a circulating photosensitizer, thereby illustrating how single microinfarcts in a cortical column can cause debilitated performance on a whiskers-based behavioral task78. Furthermore, the distinct proliferative response of CX3CR1GFP microglia as both resident brain macrophages and infiltrating brain CX3CR1GFP leukocytes has been mapped optically showing two discrete cell populations with different functions79. Longitudinal in vivo two-photon microscopy investigating the role of fractalkine and its receptor CX3CR1 in leukocytes after ischemia has revealed that CX3CR1 deficiency induced an early protective inflammatory environment80. Intravital two-photon microscopy has also revealed that diabetes disturbs cerebral capillary blood flow after stroke81. Recent in vivo two-photon calcium imaging suggested that microglia are vital to the response after stroke, in that they protect against brain injury by stabilizing neuronal networks. Imaging CX3CR1GFP mice after cerebral ischemia showed microglial process extension to neurons with increasing intracellular RCaMP1 calcium levels, whereas decreasing neuronal RCaMP1 signal was associated with microglial process withdrawal82. After stroke, two-photon microscopy revealed elevated synaptogenesis rates within recovering peri-infarct tissues76. Optogenetics has been used to map widespread motor output deficits produced by ministrokes83 and to promote functional recovery by precisely stimulating neurons to boost their activation in the peri-infarct area84. Additonaly, functional connectivity optical intrinsic signal imaging (fcOIS) has sensitively tracked functional connectivity in the murine stroke model 85.
The potential of multichannel optical imaging in understanding stroke can be seen via other relevant disease models. First, intravital two-photon imaging of neuroinflammation in experimental autoimmune encephalomyelitis elucidated perivascular lymphocyte movement of CD4+ T cell subsets86 and CD11c+ cells87 near vessels of the central nervous system. Second, intravital microscopy in a spinal injury model highlighted the role of Nr4a1, a regulator of macrophage catecholamine production, in leukocytes infiltration during disease exacerbation. More specifically, intravital microscopy reported on the inflammatory recruitment of immune cells after spinal injury by transferred 2D2-DsRed T cells into Nr4a1GFP reporter mice and CX3CR1GFP Nr4a1−/− mice88. Although these cerebral inflammatory processes are not directly associated with cardiovascular disease, they illustrate that optically imaging neuroinflammation might provide insight into the processes after stroke. For instance, macrophages using the perivascular area as ‘highways’ to get to the ischemic area may also occur after stroke. Furthermore, macrophage catecholamine production may occur in these perivascular regions. Moreover the Brainbow toolbox, which can map neuronal circuits on a large scale, as described above21, may also be applied to stroke. Examples of Brainbow technologies unconnected to cardiovascular disease include imaging mouse cerebellum Purkinje cells in multiple colors89 or pyramidal neurons in the cortex during development90. The Brainbow system’s ability to label uniquely many individual cells within a population could shed light on local and remote neuronal injury after stroke. Other recent imaging advances that could be used in stroke research include opto-fMRI, in which optically-driven stimulation is assessed by BOLD response at the stimulated site in mice using fMRI91, 92.
Recent multiparametric PET/MRI stroke studies have already shown this imaging modality’s potential. Namely, a preclinical study has combined phagocytosed USPIOs detected by T2* MRI with 11C-PK11195 PET for microglia activation to quantify phagocytic activity in order to observe post-stroke inflammatory processes longitudinally and predict long-term tissue fate51. Case reports on an ovine stroke model and stroke patients showed simultaneous 15O-H2O PET /perfusion MRI could more accurately map hypoperfused tissue with diffusion-weighted and T2-weighted MRI for outcome53. More recently, multiparametric 18F-FDG PET and MRI visualized the inflammatory activity for atherosclerotic lesion detection in patients after ischemic stroke45. By detecting biological features of high-risk plaques, 18F-FDG PET/MR angiography in non-stenotic atherosclerotic plaques ipsilateral to the stroke, suggested these plaques have a causal role in stroke45.
Applicable multiparametric PET/MRI combinations in central nervous system disease models may shape future stroke research. For example, a study in which 18F-FDG PET recorded metabolic brain activity while BOLD-fMRI simultaneously mapped vascular and oxygenation changes of the rat brain, at rest and during activation by whisker-stimulation, found spatial and quantitative discrepancies between the PET and fMRI activation data. The BOLD-fMRI approach imaged primarily the higher-order somatosensory network, whereas the PET method identified regions, such as the insula, the thalamus or the amygdala, that are known to be involved in pain processing and emotion. These results reveal comprehensive and complementary information that can further decode brain function and brain networks93. Relatedly, simultaneous PET/fMRI has been used to investigate the relationship between neurovascular responses and D2/D3 dopamine receptor occupancies in nonhuman primates. As D2/D3R antagonist doses increased, the reduction in D2/D3 dopamine receptor antagonist 11C-raclopride on PET correlated with increased cerebral blood volume shown by fMRI. These data suggest that vascular responses to D2R-like antagonists are coupled to changes in neuroreceptor occupancy94. The direct comparison of changes in neuroreceptor occupancy, shown by PET, with a simultaneously induced functional response, shown by MRI, has a variety of applications. For example, two mouse models of Alzheimer’s disease have been longitudinally imaged via PET/MRI to assess four biomarkers, namely (1) β-amyloid deposition using 11C-Pittsburgh compound B PET, (2) disease-related regional cerebral blood flow (rCBF) by ASL-MRI and 15O-H2O PET, (3) microhemorrhages by gradient MRI and (4) synaptically driven network activity using two-photon calcium imaging. Loss of perfusion correlated with the growth of β-amyloid plaque burden but was not related to the number of microhemorrhages induced by cerebral β-amyloid angiopathy in these models. Subsequent two-photon calcium imaging revealed similar neuronal hyperactivity52. Another PET/MRI study of the nervous system followed elevated brain levels of translocator protein (TSPO), a marker of glial activation, to track increased neuroinflammation in patients with chronic low back pain95. Finally, simultaneous PET/MRI has identified a novel biomarker for measuring effective connectivity in the resting human brain with open and closed eyes. Metabolic connectivity mapping calculated the spatial correlation between voxel functional connectivity, from fMRI, and local postsynaptical energy metabolism, by 18F-FDG PET at the target region. Signaling hierarchies in the brain and their defects in brain disorders can be studied with this biomarker of neuronal energy metabolism46. These types of multiparametric imaging studies of connectivity and inflammation in the central nervous system could be extrapolated to cardiovascular organs and more specifically to stroke research. For example, glial activation by TSPO PET95 could be combined with diffusion tensor MRI for tracking fibers, fMRI for neuronal activation and ASL-MRI for cerebral blood flow. Such modalities could visualize the effect of glial activation on cerebral blood flow and neuronal fiber integrity and connectivity after stroke.
Hematopoietic system interactions
The hematopoietic system consists of the blood-producing organs, like the bone marrow, and closes the circuit connecting multiple organs by producing circulating cells. During cardiovascular disease, leukocytes leave the bone marrow and spleen and move to the inflamed tissue70. To keep up with demand, cell production increases in the spleen and bone marrow5, 15, 96, 97. The local splenic environment orchestrates emergency leukocyte production after MI70, 96, while bone marrow niche cells provide signals to regulate hematopoietic stem cell (HSC) proliferation and leukocyte production after MI 97 or stroke5. Newly produced immune cells exit hematopoietic systems to infiltrate system-wide the activated endothelium of atherosclerotic plaques96, the infarcted myocardium97 or the infarcted brain5. To attain a systems-wide perspective on cardiovascular disease, imaging studies should include hematopoietic systems that supply immune cells for crucial inflammatory processes during cardiovascular disease.
The spleen and hematopoietic stem cell niches in the bone marrow have been longitudinally imaged to understand the complex biological response after MI15, 96. Intravital two-channel imaging followed the departure of CX3CR1GFP macrophages from the splenic subcapsular red pulp into the blood in CX3CR1GFP mice after MI. Splenic monocytes departed in large numbers from the spleen, accumulated at the infarct and engaged in wound healing (Fig. 2C; Supplemental movie 4)15. Multimarker imaging of myocardial healing after MI has underlined the importance of extramedullary monocytopoiesis at the spleen, as discussed above 70.
For in vivo longitudinal visualization of the hematopoietic stem cell (HSC) niche10, 11, HSCs underwent fluorescence-activated cell sorted (FACS), were labeled with DiD and, after adoptive transfer, were followed by serial intravital microscopy, which showed that transferred HSCs settled into the bone marrow before MI and were released after MI. The relocation of HSCs to the spleen after MI was consequently investigated by labelling these cells with a photoconvertible dye. First, photoconvertion through laser illumination occurred in the skull bone marrow, where cells engrafted after adoptive transfer. Following MI, the cells, which had been previously tagged by photo conversion in the marrow, were detected in splenic cell suspensions, thus indicating progenitor traffic from the marrow to the spleen96. Circulating immune cells are crucial in the pathogenesis of stroke, and their production in the hematopoietic niche has been imaged longitudinally using multichannel optical imaging after stroke. Sorted HSCs labeled with DiD prior to adoptive transfer were longitudinally followed before and after stroke (Fig. 2B)5. Serial in vivo bioluminescence reporter gene imaging of mitosis-luciferase mice after stroke additionally revealed that bone marrow cell cycling peaked 4 days after stroke. These results demonstrate that stroke boosts HSC proliferation and causes increased monocyte supply5. To examine the effect of psychosocial stress on the immune system, DiD-labeled HSCs, together with fluorescently-labeled dextran to identify blood vessels and Osteosense to delineate the bone marrow niche, were followed before and at 7 days after stress exposure. Longitudinal intravital microscopy at the calvaria showed accelerated dilution of the membrane dye, which indicated increased proliferation of these labeled cells, in mice exposed to stress. Higher HSC proliferation gave rise to higher levels of disease-promoting inflammatory leukocytes and promoted plaque features associated with vulnerable lesions that cause MI and stroke in humans98. Together, these data provide insight into regulation of hematopoiesis modulating leukocyte output in cardiovascular disease.
Bone marrow HSCs give rise to myeloid cells, including monocytes, macrophages, neutrophils and dendritic cells, and lymphoid cells, like T cells and B cells. To explore the clonality of heterogeneous HSCs in the bone marrow, fluorescent hematopoietic cell labeling was assessed by crossing the polyinosine-polycytidine (pIpC)-inducible Mx1-Cre with HUe (Mx1-Cre;HUe), a process similar to the Brainbow system used in the brain22. When the Mx1-Cre;HUe mouse were given a pIpC pulse, multi-colored hematopoietic cells within the calvarial cavity could be visualized using intravital microscopy. These clonal populations were further analyzed using FACS to identify endogenous HUe fluorescence from separate clonal populations and categorize them by cell type (e.g. monocyte, B-cell, T-cell, etc.). Further, these functional populations were coupled with analyses of gene expression and chromatin state at clonal resolution. HSC function appeared to be bound by cell-autonomous epigenetic constraints22. Follow-up on separate clonal HSC populations – for example, to track clonal myeloid cell expansion after ischemic injury – would also be a very interesting approach to studying cardiovascular inflammation.
Whole body 18F-FDG PET/CT of patients with coronary artery disease has shown increased inflammatory activity in the carotid artery that correlated with increased activation of both the spleen and the lumbar vertebrae bone marrow. The 18F-FDG metabolic activity of carotid artery, bone marrow and spleen were highest in patients with acute MI, intermediate in patients with angina and lowest in control subjects49. Multiparametric multi-organ information on infarct healing has been provided by 18F-FDG PET combined with MRI on the heart, spleen and bone marrow to characterize the inflammatory response to acute MI in patients (Fig. 4)47. Cardiac MRI using LGE for infarct size and T2 for edema showed regional edema exceeding the area of late Gd enhancement. In patients with acute MI, after fasting and heparin suppressed myocardial uptake, PET detected inflammatory FDG uptake in the infarct region at the area of the 13N ammonia-outlined perfusion defect. 18F-FDG PET of the spleen and bone marrow suggested these organ systems are the birthplace of inflammatory cells, as the metabolic glucose rate in the infarct correlated with metabolic rates of remote myocardium, spleen and bone marrow but not with muscle or liver (Fig. 4)47.
Figure 4.

Multi-organ PET/MRI of the inflammatory tissue response after myocardial infarction (MI). (A) Representative multiparametric cardiac magnetic resonance (CMR) and PET images in a patient early after MI and reperfusion. The anteroseptal infarct region is highlighted by gadolinium contrast late enhancement (Gd LE; top row) and shows transmural tissue damage (bright) and subendocardial no reflow (black). Transmural edema (bright) on T2-weighted images (second row) exceeded the LE area. PET perfusion images (third row) showed perfusion defects in the infarct area with LE (late Gd enhanced). Also, 18F-deoxyglucose (FDG) uptake is present in the infarct region even when myocyte uptake is suppressed by heparin, a result that is consistent with regional inflammation (bottom row).(B) Multiorgan positron emission tomography (PET)-computed tomography (CT) analysis of glucose utilization. PET images (right) and hybrid PET/CT images (left) of the cardiac region, show the positioning of regions of interest for quantitative analysis of glucose use in the heart and lymphoid tissue. From Tim Wollenweber et al.47.
In mice, rabbits and patients with atherosclerosis, 18F-fluorothymidine (FLT) PET has been used as a biomarker for cell proliferation in plaques and hematopoietic activity in bone marrow (Fig. 5)48. 18F-FLT uptake in the thoracic aorta of ApoE−/− mice showed proliferating cells present in atherosclerotic plaques. 18F-FLT signal in the thoracic vertebrae and sternum correlated with HSC proliferation in the bone marrow. In rabbits, MRI of atherosclerotic lesions in the descending aorta correlated with heterogeneous inflammatory patterns of 18F-FDG for inflammatory glucose uptake and 18F-FLT by PET/CT in the same region. Patients at high risk of cardiovascular disease showed increased vascular uptake of both 18F-FDG and 18F-FLT PET agents compared to patients with low cardiovascular risk. In sum, 18F-FLT facilitates PET imaging of proliferation in atherosclerotic plaques and the bone marrow48. Higher HSC proliferation rates in the spinal bone marrow after MI have also been imaged97. Moreover, intravital microscopy after MI has identified the CCR2+CD150+CD48− HSC subset as the most upstream contributor to emergency myelopoiesis after ischemic organ injury. This subset demonstrated 4-fold higher proliferation rates than CCR2−CD150+CD48− HSC cells and appeared to be regulated by myeloid translocation gene 16 (Mtg16). Mtg16−/− mice showed fewer systemic monocytes. Further, infarcted Mtg16−/− hearts displayed compromised tissue healing, as indicated by decreased protease activity shown by FMT/CT and post-MI heart failure imaged by functional cardiac MRI97.
Figure 5.
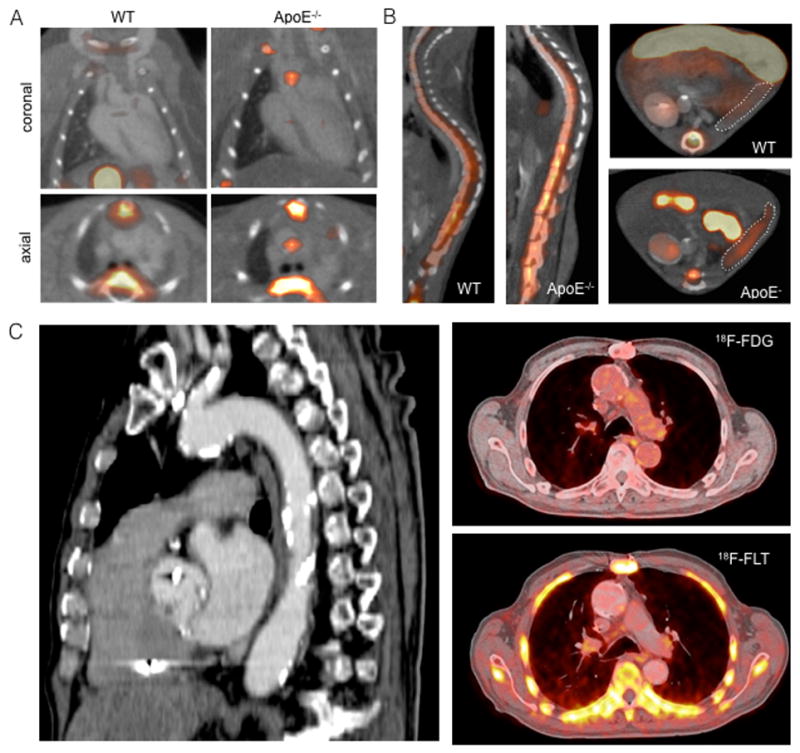
Imaging macrophage and hematopoietic progenitor proliferation in atherosclerosis. (A) 18F-fluorothymidine (FLT) PET uptake in mice with atherosclerosis. PET/CT images show higher 18F-FLT uptake in atherosclerotic lesions (arrow) of ascending aorta in an apolipoprotein E knock out (ApoE−/−) compared with a wild-type (WT) mouse. High 18F-FLT signal is also present in the sternum and vertebrae (arrow heads) and gallbladder (asterisk). (B) Increased 18F-FLT uptake in bone marrow and spleen of ApoE−/− mice compared with wild-type (WT). 18F-FLT and 18F-FDG PET/CT in humans with atherosclerosis. Sagittal image demonstrates extensive calcification in the aorta and carotid artery (arrows). 18F-FDG and 18F-FLT images show PET tracer uptake in the vessel wall of the aortic arch (arrows). From Ye et al.48.
Multi-organ PET/CT has explored whether resting amygdalae activity, which is prompted by stress, is associated with subsequent cardiovascular events in patients. This prototype study interrelated the nervous system, immune interactions in the cardiovascular system and the hematopoetic system. 18F-FDG PET/CT imaging was applied to three regions simultaneously to quantify regional brain metabolism (i.e. amygdalar activity), hematopoietic tissue activity in the bone marrow and large vessel arterial plaque inflammation. Increased 18F-FDG PET uptake in the amygdala, bone marrow and arterial wall (aorta) linked brain activity to subsequent cardiovascular disease through increased bone marrow activity and arterial inflammation. Emotional stress correlated with increased cardiovascular disease risk (Fig. 6)99. We believe these multi-organ studies will progress towards PET/MRI and thus incorporate several imaging reporters for distinct biological processes. For instance, fMRI for brain activity and cardiovascular Gd-enhanced MRI could be combined with 18F-FLT PET to track cell proliferation in different systems or to assess glial activation in the brain by TSPO imaging95. These system-wide multiparametric studies are the direction in which cardiovascular imaging ought to progress, because they provide unique information on complex disease processes in humans.
Figure 6.
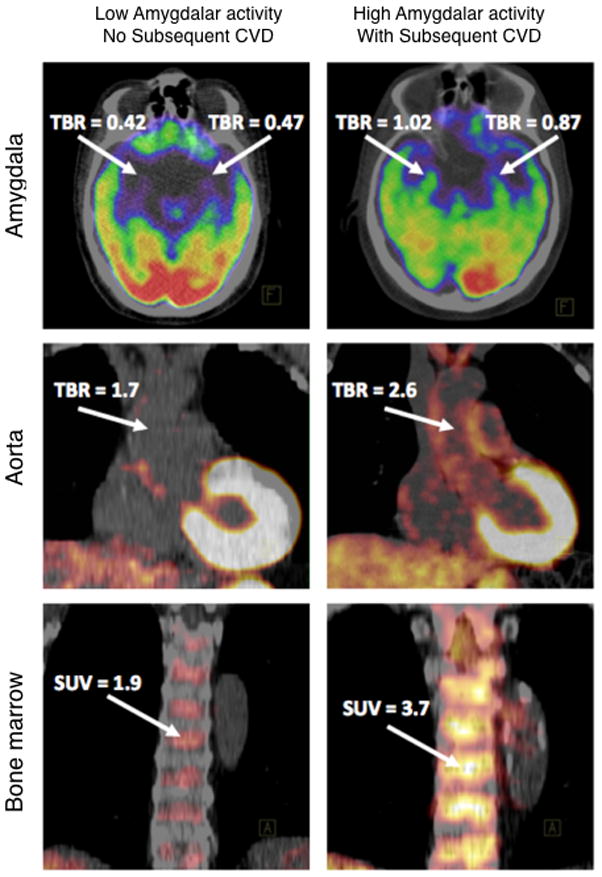
Emotional stress, measured by the metabolic rate of resting amygdalae activity, predicted cardiovascular events. Increased 18F-fluorodeoxyglucose (FDG) uptake in the amygdala, bone marrow and arterial wall (aorta) in a subject who experienced an ischemic stroke during the follow-up period (right) vs. a subject who did not (left). From Tawakol et al.99
Challenges and future directions
Multi-organ multiparametric imaging will dynamically show when and where genetically and biochemically defined molecules, signals and processes appear, interact and disappear. Well-thought-out study designs with proper randomization are crucial to investigate causality of correlating imaging biomarkers. Going forward, the challenge will be to integrate all important inputs and visualize the cellular and subcellular interactions in disease development while muting less relevant information. Optical intravital and PET/MR imaging acquire large amounts of data on molecular and cellular processes such as migration or cell-cell interaction. These processes can be quantified to reveal interactions among stromal and inflammatory cells, like monocytes and macrophages; leukocyte production in the bone marrow; the vasculature; large vessels and target organs such as the heart and brain.
One of the challenges in collecting multiplex datasets is quantifying and integrating these data. Although existing algorithms and statistical methods may be adequate for processing and analyzing a single data stream, generating large data sets requires innovation. Standardization is a prerequisite when comparing information acquired from different modalities using different tracers. Coupling imaging with relevant genetic data would further enrich output. One research area pushing froward into these possibilities is human neuroimaging, which has already been called a ‘big data’ science100. For example, The Enhancing Neuroimaging Genetics through Meta-Analysis (ENIGMA; enigma.loni.ucla.edu) platform has brought together researchers in neuroimaging and genetics to study brain structure and function using MRI, DTI, fMRI and genome-wide association study (GWAS) data100. Another example is systems biology frameworks that have been developed for archiving and mining data101. Discriminating decisive biomarker interactions in these large datasets might provide clues about underlying biological mechanisms and thus pave the way for discovery-oriented cardiovascular science. The terabytes of data will supply input for pattern-seeking and other algorithms 100 that can help decipher complex pathophysiological processes in cardiovascular disease.
Conclusion
We have sought here to explain, illustrate and extend multichannel imaging technologies on a systems level for translatable cardiovascular imaging research. Advances in multicolor intravital microscopy and multichannel PET/MRI help visualizing the molecular and cellular interactions that alter living cells and organ systems in cardiovascular disease. Further technical refinement of these technologies will likely occur in the foreseeable future, continuing the progress of the last decade.
Motion-corrected multiparametric imaging of the heart and large vessels has uncovered specific immune cell functions and their actions, including neutrophils, monocytes and macrophages. Similarly, nervous and hematopoietic system interactions were mapped via multichannel imaging of specific biomarker selections. Multi-biomarker information may give new systems insights on disease pathophysiology and act as a predictive tool for cardiovascular disease. Looking ahead, we envision that imaging research will discover informative disease biomarker combinations which provide insight into the dynamic spatial, molecular and cellular aspects of cardiovascular disease. For clinical practice, such data may be harnessed to identify patients at high risk for cardiovascular events and then direct their therapies towards improved prevention.
Supplementary Material
Acknowledgments
We thank Kaley Joyes, PhD for editing the manuscript. Figure 1 was produced using Servier Medical Art (www.servier.com).
Sources of Funding
This work was supported by grants from the NIH (HL096576, HL114477, NS084863, HL128264, HL117829)
Footnotes
Disclosures
None.
References
- 1.Stephens DJ, Allan VJ. Light microscopy techniques for live cell imaging. Science. 2003;300:82–86. doi: 10.1126/science.1082160. [DOI] [PubMed] [Google Scholar]
- 2.Zipfel WR, Williams RM, Webb WW. Nonlinear magic: multiphoton microscopy in the biosciences. Nat Biotechnol. 2003;21:1369–1377. doi: 10.1038/nbt899. [DOI] [PubMed] [Google Scholar]
- 3.Shaner NC, Steinbach PA, Tsien RY. A guide to choosing fluorescent proteins. Nat Methods. 2005;2:905–909. doi: 10.1038/nmeth819. [DOI] [PubMed] [Google Scholar]
- 4.McArdle S, Mikulski Z, Ley K. Live cell imaging to understand monocyte, macrophage, and dendritic cell function in atherosclerosis. J Exp Med. 2016;213:1117–1131. doi: 10.1084/jem.20151885. [DOI] [PMC free article] [PubMed] [Google Scholar]
- 5.Courties G, Herisson F, Sager HB, Heidt T, Ye Y, Wei Y, Sun Y, Severe N, Dutta P, Scharff J, Scadden DT, Weissleder R, Swirski FK, Moskowitz MA, Nahrendorf M. Ischemic stroke activates hematopoietic bone marrow stem cells. Circ Res. 2015;116:407–417. doi: 10.1161/CIRCRESAHA.116.305207. [DOI] [PMC free article] [PubMed] [Google Scholar]
- 6.Zipfel WR, Williams RM, Christie R, Nikitin AY, Hyman BT, Webb WW. Live tissue intrinsic emission microscopy using multiphoton-excited native fluorescence and second harmonic generation. Proc Natl Acad Sci U S A. 2003;100:7075–7080. doi: 10.1073/pnas.0832308100. [DOI] [PMC free article] [PubMed] [Google Scholar]
- 7.Pittet MJ, Weissleder R. Intravital imaging. Cell. 2011;147:983–991. doi: 10.1016/j.cell.2011.11.004. [DOI] [PMC free article] [PubMed] [Google Scholar]
- 8.Filonov GS, Piatkevich KD, Ting LM, Zhang J, Kim K, Verkhusha VV. Bright and stable near-infrared fluorescent protein for in vivo imaging. Nat Biotechnol. 2011;29:757–761. doi: 10.1038/nbt.1918. [DOI] [PMC free article] [PubMed] [Google Scholar]
- 9.Shu X, Royant A, Lin MZ, Aguilera TA, Lev-Ram V, Steinbach PA, Tsien RY. Mammalian expression of infrared fluorescent proteins engineered from a bacterial phytochrome. Science. 2009;324:804–807. doi: 10.1126/science.1168683. [DOI] [PMC free article] [PubMed] [Google Scholar]
- 10.Lo Celso C, Fleming HE, Wu JW, Zhao CX, Miake-Lye S, Fujisaki J, Côté D, Rowe DW, Lin CP, Scadden DT. Live-animal tracking of individual haematopoietic stem/progenitor cells in their niche. Nature. 2009;457:92–96. doi: 10.1038/nature07434. [DOI] [PMC free article] [PubMed] [Google Scholar]
- 11.Mazo IB, Gutierrez-Ramos JC, Frenette PS, Hynes RO, Wagner DD, von Andrian UH. Hematopoietic progenitor cell rolling in bone marrow microvessels: parallel contributions by endothelial selectins and vascular cell adhesion molecule 1. J Exp Med. 1998;188:465–474. doi: 10.1084/jem.188.3.465. [DOI] [PMC free article] [PubMed] [Google Scholar]
- 12.Grutzendler J, Kasthuri N, Gan WB. Long-term dendritic spine stability in the adult cortex. Nature. 2002;420:812–816. doi: 10.1038/nature01276. [DOI] [PubMed] [Google Scholar]
- 13.Davalos D, Grutzendler J, Yang G, Kim JV, Zuo Y, Jung S, Littman DR, Dustin ML, Gan WB. ATP mediates rapid microglial response to local brain injury in vivo. Nat Neurosci. 2005;8:752–758. doi: 10.1038/nn1472. [DOI] [PubMed] [Google Scholar]
- 14.Ricard C, Debarbieux FC. Six-color intravital two-photon imaging of brain tumors and their dynamic microenvironment. Front Cell Neurosci. 2014;8:57. doi: 10.3389/fncel.2014.00057. [DOI] [PMC free article] [PubMed] [Google Scholar]
- 15.Swirski FK, Nahrendorf M, Etzrodt M, Wildgruber M, Cortez-Retamozo V, Panizzi P, Figueiredo JL, Kohler RH, Chudnovskiy A, Waterman P, Aikawa E, Mempel TR, Libby P, Weissleder R, Pittet MJ. Identification of splenic reservoir monocytes and their deployment to inflammatory sites. Science. 2009;325:612–616. doi: 10.1126/science.1175202. [DOI] [PMC free article] [PubMed] [Google Scholar]
- 16.Arnon TI, Horton RM, Grigorova IL, Cyster JG. Visualization of splenic marginal zone B-cell shuttling and follicular B-cell egress. Nature. 2013;493:684–688. doi: 10.1038/nature11738. [DOI] [PMC free article] [PubMed] [Google Scholar]
- 17.Marques PE, Oliveira AG, Chang L, Paula-Neto HA, Menezes GB. Understanding liver immunology using intravital microscopy. J Hepatol. 2015;63:733–742. doi: 10.1016/j.jhep.2015.05.027. [DOI] [PubMed] [Google Scholar]
- 18.Kuan EL, Ivanov S, Bridenbaugh EA, Victora G, Wang W, Childs EW, Platt AM, Jakubzick CV, Mason RJ, Gashev AA, Nussenzweig M, Swartz MA, Dustin ML, Zawieja DC, Randolph GJ. Collecting lymphatic vessel permeability facilitates adipose tissue inflammation and distribution of antigen to lymph node-homing adipose tissue dendritic cells. J Immunol. 2015;194:5200–5210. doi: 10.4049/jimmunol.1500221. [DOI] [PMC free article] [PubMed] [Google Scholar]
- 19.Vinegoni C, Aguirre AD, Lee S, Weissleder R. Imaging the beating heart in the mouse using intravital microscopy techniques. Nat Protoc. 2015;10:1802–1819. doi: 10.1038/nprot.2015.119. [DOI] [PMC free article] [PubMed] [Google Scholar]
- 20.McArdle S, Chodaczek G, Ray N, Ley K. Intravital live cell triggered imaging system reveals monocyte patrolling and macrophage migration in atherosclerotic arteries. J Biomed Opt. 2015;20:26005. doi: 10.1117/1.JBO.20.2.026005. [DOI] [PMC free article] [PubMed] [Google Scholar]
- 21.Livet J, Weissman TA, Kang H, Draft RW, Lu J, Bennis RA, Sanes JR, Lichtman JW. Transgenic strategies for combinatorial expression of fluorescent proteins in the nervous system. Nature. 2007;450:56–62. doi: 10.1038/nature06293. [DOI] [PubMed] [Google Scholar]
- 22.Yu VW, Yusuf RZ, Oki T, Wu J, Saez B, Wang X, Cook C, Baryawno N, Ziller MJ, Lee E, Gu H, Meissner A, Lin CP, Kharchenko PV, Scadden DT. Epigenetic Memory Underlies Cell-Autonomous Heterogeneous Behavior of Hematopoietic Stem Cells. Cell. 2016;167:1310–1322. e17. doi: 10.1016/j.cell.2016.10.045. [DOI] [PubMed] [Google Scholar]
- 23.Packer AM, Roska B, Häusser M. Targeting neurons and photons for optogenetics. Nat Neurosci. 2013;16:805–815. doi: 10.1038/nn.3427. [DOI] [PMC free article] [PubMed] [Google Scholar]
- 24.Malvache A, Reichinnek S, Villette V, Haimerl C, Cossart R. Awake hippocampal reactivations project onto orthogonal neuronal assemblies. Science. 2016;353:1280–1283. doi: 10.1126/science.aaf3319. [DOI] [PubMed] [Google Scholar]
- 25.Nussinovitch U, Gepstein L. Optogenetics for in vivo cardiac pacing and resynchronization therapies. Nat Biotechnol. 2015;33:750–754. doi: 10.1038/nbt.3268. [DOI] [PubMed] [Google Scholar]
- 26.Richardson DS, Lichtman JW. Clarifying Tissue Clearing. Cell. 2015;162:246–257. doi: 10.1016/j.cell.2015.06.067. [DOI] [PMC free article] [PubMed] [Google Scholar]
- 27.Vakoc BJ, Lanning RM, Tyrrell JA, Padera TP, Bartlett LA, Stylianopoulos T, Munn LL, Tearney GJ, Fukumura D, Jain RK, Bouma BE. Three-dimensional microscopy of the tumor microenvironment in vivo using optical frequency domain imaging. Nat Med. 2009;15:1219–1223. doi: 10.1038/nm.1971. [DOI] [PMC free article] [PubMed] [Google Scholar]
- 28.Nahrendorf M, Sosnovik DE, Waterman P, Swirski FK, Pande AN, Aikawa E, Figueiredo JL, Pittet MJ, Weissleder R. Dual channel optical tomographic imaging of leukocyte recruitment and protease activity in the healing myocardial infarct. Circ Res. 2007;100:1218–1225. doi: 10.1161/01.RES.0000265064.46075.31. [DOI] [PubMed] [Google Scholar]
- 29.Ughi GJ, Wang H, Gerbaud E, Gardecki JA, Fard AM, Hamidi E, Vacas-Jacques P, Rosenberg M, Jaffer FA, Tearney GJ. Clinical Characterization of Coronary Atherosclerosis With Dual-Modality OCT and Near-Infrared Autofluorescence Imaging. JACC Cardiovasc Imaging. 2016;9:1304–1314. doi: 10.1016/j.jcmg.2015.11.020. [DOI] [PMC free article] [PubMed] [Google Scholar]
- 30.Attia AB, Ho CJ, Chandrasekharan P, Balasundaram G, Tay HC, Burton NC, Chuang KH, Ntziachristos V, Olivo M. Multispectral optoacoustic and MRI coregistration for molecular imaging of orthotopic model of human glioblastoma. J Biophotonics. 2016;9:701–708. doi: 10.1002/jbio.201500321. [DOI] [PubMed] [Google Scholar]
- 31.Nahrendorf M, Keliher E, Marinelli B, Waterman P, Feruglio PF, Fexon L, Pivovarov M, Swirski FK, Pittet MJ, Vinegoni C, Weissleder R. Hybrid PET-optical imaging using targeted probes. Proc Natl Acad Sci U S A. 2010;107:7910–7915. doi: 10.1073/pnas.0915163107. [DOI] [PMC free article] [PubMed] [Google Scholar]
- 32.Keliher EJ, Ye YX, Wojtkiewicz GR, Aguirre AD, Tricot B, Senders ML, Groenen H, Fay F, Perez-Medina C, Calcagno C, Carlucci G, Reiner T, Sun Y, Courties G, Iwamoto Y, Kim HY, Wang C, Chen JW, Swirski FK, Wey HY, Hooker J, Fayad ZA, Mulder WJ, Weissleder R, Nahrendorf M. Polyglucose nanoparticles with renal elimination and macrophage avidity facilitate PET imaging in ischaemic heart disease. Nat Commun. 2017;8:14064. doi: 10.1038/ncomms14064. [DOI] [PMC free article] [PubMed] [Google Scholar]
- 33.Judenhofer MS, Cherry SR. Applications for preclinical PET/MRI. Semin Nucl Med. 2013;43:19–29. doi: 10.1053/j.semnuclmed.2012.08.004. [DOI] [PubMed] [Google Scholar]
- 34.Klein C, Nekolla SG, Bengel FM, Momose M, Sammer A, Haas F, Schnackenburg B, Delius W, Mudra H, Wolfram D, Schwaiger M. Assessment of myocardial viability with contrast-enhanced magnetic resonance imaging: comparison with positron emission tomography. Circulation. 2002;105:162–167. doi: 10.1161/hc0202.102123. [DOI] [PubMed] [Google Scholar]
- 35.Bailey DL, Antoch G, Bartenstein P, Barthel H, Beer AJ, Bisdas S, Bluemke DA, Boellaard R, Claussen CD, Franzius C, Hacker M, Hricak H, la Fougère C, Gückel B, Nekolla SG, Pichler BJ, Purz S, Quick HH, Sabri O, Sattler B, Schäfer J, Schmidt H, van den Hoff J, Voss S, Weber W, Wehrl HF, Beyer T. Combined PET/MR: The Real Work Has Just Started. Mol Imaging Biol; Summary Report of the Third International Workshop on PET/MR Imaging; February 17–21, 2014; Tübingen, Germany. 2015. pp. 297–312. [DOI] [PMC free article] [PubMed] [Google Scholar]
- 36.Bakermans AJ, Abdurrachim D, Moonen RP, Motaal AG, Prompers JJ, Strijkers GJ, Vandoorne K, Nicolay K. Small animal cardiovascular MR imaging and spectroscopy. Prog Nucl Magn Reson Spectrosc. 2015;88–89:1–47. doi: 10.1016/j.pnmrs.2015.03.001. [DOI] [PubMed] [Google Scholar]
- 37.Merino JG, Warach S. Imaging of acute stroke. Nat Rev Neurol. 2010;6:560–571. doi: 10.1038/nrneurol.2010.129. [DOI] [PubMed] [Google Scholar]
- 38.Logothetis NK. What we can do and what we cannot do with fMRI. Nature. 2008;453:869–878. doi: 10.1038/nature06976. [DOI] [PubMed] [Google Scholar]
- 39.Sosnovik DE, Wang R, Dai G, Wang T, Aikawa E, Novikov M, Rosenzweig A, Gilbert RJ, Wedeen VJ. Diffusion spectrum MRI tractography reveals the presence of a complex network of residual myofibers in infarcted myocardium. Circ Cardiovasc Imaging. 2009;2:206–212. doi: 10.1161/CIRCIMAGING.108.815050. [DOI] [PMC free article] [PubMed] [Google Scholar]
- 40.Flögel U, Ding Z, Hardung H, Jander S, Reichmann G, Jacoby C, Schubert R, Schrader J. In vivo monitoring of inflammation after cardiac and cerebral ischemia by fluorine magnetic resonance imaging. Circulation. 2008;118:140–148. doi: 10.1161/CIRCULATIONAHA.107.737890. [DOI] [PMC free article] [PubMed] [Google Scholar]
- 41.Vandoorne K, Vandsburger MH, Jacobs I, Han Y, Dafni H, Nicolay K, Strijkers GJ. Noninvasive mapping of endothelial dysfunction in myocardial ischemia by magnetic resonance imaging using an albumin-based contrast agent. NMR Biomed. 2016;29:1500–1510. doi: 10.1002/nbm.3599. [DOI] [PubMed] [Google Scholar]
- 42.Vandsburger M, Vandoorne K, Oren R, Leftin A, Mpofu S, Delli Castelli D, Aime S, Neeman M. Cardio-chemical exchange saturation transfer magnetic resonance imaging reveals molecular signatures of endogenous fibrosis and exogenous contrast media. Circ Cardiovasc Imaging. 2015;8:e002180. doi: 10.1161/CIRCIMAGING.114.002180. [DOI] [PubMed] [Google Scholar]
- 43.Drzezga A, Souvatzoglou M, Eiber M, Beer AJ, Fürst S, Martinez-Möller A, Nekolla SG, Ziegler S, Ganter C, Rummeny EJ, Schwaiger M. First clinical experience with integrated whole-body PET/MR: comparison to PET/CT in patients with oncologic diagnoses. J Nucl Med. 2012;53:845–855. doi: 10.2967/jnumed.111.098608. [DOI] [PubMed] [Google Scholar]
- 44.Lee WW, Marinelli B, van der Laan AM, Sena BF, Gorbatov R, Leuschner F, Dutta P, Iwamoto Y, Ueno T, Begieneman MP, Niessen HW, Piek JJ, Vinegoni C, Pittet MJ, Swirski FK, Tawakol A, Di Carli M, Weissleder R, Nahrendorf M. PET/MRI of inflammation in myocardial infarction. J Am Coll Cardiol. 2012;59:153–163. doi: 10.1016/j.jacc.2011.08.066. [DOI] [PMC free article] [PubMed] [Google Scholar]
- 45.Hyafil F, Schindler A, Sepp D, Obenhuber T, Bayer-Karpinska A, Boeckh-Behrens T, Höhn S, Hacker M, Nekolla SG, Rominger A, Dichgans M, Schwaiger M, Saam T, Poppert H. High-risk plaque features can be detected in non-stenotic carotid plaques of patients with ischaemic stroke classified as cryptogenic using combined (18)F-FDG PET/MR imaging. Eur J Nucl Med Mol Imaging. 2016;43:270–279. doi: 10.1007/s00259-015-3201-8. [DOI] [PubMed] [Google Scholar]
- 46.Riedl V, Utz L, Castrillón G, Grimmer T, Rauschecker JP, Ploner M, Friston KJ, Drzezga A, Sorg C. Metabolic connectivity mapping reveals effective connectivity in the resting human brain. Proc Natl Acad Sci U S A. 2016;113:428–433. doi: 10.1073/pnas.1513752113. [DOI] [PMC free article] [PubMed] [Google Scholar]
- 47.Wollenweber T, Roentgen P, Schäfer A, Schatka I, Zwadlo C, Brunkhorst T, Berding G, Bauersachs J, Bengel FM. Characterizing the inflammatory tissue response to acute myocardial infarction by clinical multimodality noninvasive imaging. Circ Cardiovasc Imaging. 2014;7:811–818. doi: 10.1161/CIRCIMAGING.114.001689. [DOI] [PubMed] [Google Scholar]
- 48.Ye YX, Calcagno C, Binderup T, Courties G, Keliher EJ, Wojtkiewicz GR, Iwamoto Y, Tang J, Pérez-Medina C, Mani V, Ishino S, Johnbeck CB, Knigge U, Fayad ZA, Libby P, Weissleder R, Tawakol A, Dubey S, Belanger AP, Di Carli MF, Swirski FK, Kjaer A, Mulder WJ, Nahrendorf M. Imaging Macrophage and Hematopoietic Progenitor Proliferation in Atherosclerosis. Circ Res. 2015;117:835–845. doi: 10.1161/CIRCRESAHA.115.307024. [DOI] [PMC free article] [PubMed] [Google Scholar]
- 49.Kim EJ, Kim S, Kang DO, Seo HS. Metabolic activity of the spleen and bone marrow in patients with acute myocardial infarction evaluated by 18f-fluorodeoxyglucose positron emission tomograpic imaging. Circ Cardiovasc Imaging. 2014;7:454–460. doi: 10.1161/CIRCIMAGING.113.001093. [DOI] [PubMed] [Google Scholar]
- 50.Chapon C, Jackson JS, Aboagye EO, Herlihy AH, Jones WA, Bhakoo KK. An in vivo multimodal imaging study using MRI and PET of stem cell transplantation after myocardial infarction in rats. Mol Imaging Biol. 2009;11:31–38. doi: 10.1007/s11307-008-0174-z. [DOI] [PubMed] [Google Scholar]
- 51.Walter HL, Walberer M, Rueger MA, Backes H, Wiedermann D, Hoehn M, Neumaier B, Graf R, Fink GR, Schroeter M. In vivo analysis of neuroinflammation in the late chronic phase after experimental stroke. Neuroscience. 2015;292:71–80. doi: 10.1016/j.neuroscience.2015.02.024. [DOI] [PubMed] [Google Scholar]
- 52.Maier FC, Wehrl HF, Schmid AM, Mannheim JG, Wiehr S, Lerdkrai C, Calaminus C, Stahlschmidt A, Ye L, Burnet M, Stiller D, Sabri O, Reischl G, Staufenbiel M, Garaschuk O, Jucker M, Pichler BJ. Longitudinal PET-MRI reveals β-amyloid deposition and rCBF dynamics and connects vascular amyloidosis to quantitative loss of perfusion. Nat Med. 2014;20:1485–1492. doi: 10.1038/nm.3734. [DOI] [PubMed] [Google Scholar]
- 53.Werner P, Saur D, Zeisig V, Ettrich B, Patt M, Sattler B, Jochimsen T, Lobsien D, Meyer PM, Bergh FT, Dreyer A, Boltze J, Classen J, Fritzsch D, Hoffmann KT, Sabri O, Barthel H. Simultaneous PET/MRI in stroke: a case series. J Cereb Blood Flow Metab. 2015;35:1421–1425. doi: 10.1038/jcbfm.2015.158. [DOI] [PMC free article] [PubMed] [Google Scholar]
- 54.de Haan S, Rijnierse MT, Harms HJ, Verberne HJ, Lammertsma AA, Huisman MC, Windhorst AD, van Rossum AC, Allaart CP, Knaapen P. Myocardial denervation coincides with scar heterogeneity in ischemic cardiomyopathy: A PET and CMR study. J Nucl Cardiol. 2015;23:1480–1488. doi: 10.1007/s12350-015-0316-z. [DOI] [PubMed] [Google Scholar]
- 55.Irkle A, Vesey AT, Lewis DY, Skepper JN, Bird JL, Dweck MR, Joshi FR, Gallagher FA, Warburton EA, Bennett MR, Brindle KM, Newby DE, Rudd JH, Davenport AP. Identifying active vascular microcalcification by (18)F-sodium fluoride positron emission tomography. Nat Commun. 2015;6:7495. doi: 10.1038/ncomms8495. [DOI] [PMC free article] [PubMed] [Google Scholar]
- 56.Gilad AA, McMahon MT, Walczak P, Winnard PT, Raman V, van Laarhoven HW, Skoglund CM, Bulte JW, van Zijl PC. Artificial reporter gene providing MRI contrast based on proton exchange. Nat Biotechnol. 2007;25:217–219. doi: 10.1038/nbt1277. [DOI] [PubMed] [Google Scholar]
- 57.Shapiro MG, Ramirez RM, Sperling LJ, Sun G, Sun J, Pines A, Schaffer DV, Bajaj VS. Genetically encoded reporters for hyperpolarized xenon magnetic resonance imaging. Nat Chem. 2014;6:629–634. doi: 10.1038/nchem.1934. [DOI] [PubMed] [Google Scholar]
- 58.Burton JB, Johnson M, Sato M, Koh SB, Mulholland DJ, Stout D, Chatziioannou AF, Phelps ME, Wu H, Wu L. Adenovirus-mediated gene expression imaging to directly detect sentinel lymph node metastasis of prostate cancer. Nat Med. 2008;14:882–888. doi: 10.1038/nm.1727. [DOI] [PMC free article] [PubMed] [Google Scholar]
- 59.Stark K, Eckart A, Haidari S, Tirniceriu A, Lorenz M, von Brühl ML, Gärtner F, Khandoga AG, Legate KR, Pless R, Hepper I, Lauber K, Walzog B, Massberg S. nCapillary and arteriolar pericytes attract innate leukocytes exiting through venules and ‘instruct’ them with pattern-recognition and motility programs. Nat Immunol. 2013;14:41–51. doi: 10.1038/ni.2477. [DOI] [PubMed] [Google Scholar]
- 60.Stark K, Philippi V, Stockhausen S, Busse J, Antonelli A, Miller M, Schubert I, Hoseinpour P, Chandraratne S, von Brühl ML, Gärtner F, Lorenz M, Agresti A, Coletti R, Antoine DJ, Heermann R, Jung K, Reese S, Laitinen I, Schwaiger M, Walch A, Sperandio M, Nawroth PP, Reinhardt C, Jäckel S, Bianchi ME, Massberg S. Disulfide HMGB1 derived from platelets coordinates venous thrombosis in mice. Blood. 2016;128:2435–2449. doi: 10.1182/blood-2016-04-710632. [DOI] [PMC free article] [PubMed] [Google Scholar]
- 61.Chèvre R, González-Granado JM, Megens RT, Sreeramkumar V, Silvestre-Roig C, Molina-Sánchez P, Weber C, Soehnlein O, Hidalgo A, Andrés V. High-resolution imaging of intravascular atherogenic inflammation in live mice. Circ Res. 2014;114:770–779. doi: 10.1161/CIRCRESAHA.114.302590. [DOI] [PubMed] [Google Scholar]
- 62.Kwee RM, Teule GJ, van Oostenbrugge RJ, Mess WH, Prins MH, van der Geest RJ, Ter Berg JW, Franke CL, Korten AG, Meems BJ, Hofman PA, van Engelshoven JM, Wildberger JE, Kooi ME. Multimodality imaging of carotid artery plaques: 18F-fluoro-2-deoxyglucose positron emission tomography, computed tomography, and magnetic resonance imaging. Stroke. 2009;40:3718–3724. doi: 10.1161/STROKEAHA.109.564088. [DOI] [PubMed] [Google Scholar]
- 63.Ripa RS, Knudsen A, Hag AM, Lebech AM, Loft A, Keller SH, Hansen AE, von Benzon E, Højgaard L, Kjær A. Feasibility of simultaneous PET/MR of the carotid artery: first clinical experience and comparison to PET/CT. Am J Nucl Med Mol Imaging. 2013;3:361–371. [PMC free article] [PubMed] [Google Scholar]
- 64.Li X, Heber D, Rausch I, Beitzke D, Mayerhoefer ME, Rasul S, Kreissl M, Mitthauser M, Wadsak W, Hartenbach M, Haug A, Zhang X, Loewe C, Beyer T, Hacker M. Quantitative assessment of atherosclerotic plaques on (18)F-FDG PET/MRI: comparison with a PET/CT hybrid system. Eur J Nucl Med Mol Imaging. 2016;43:1503–1512. doi: 10.1007/s00259-016-3308-6. [DOI] [PMC free article] [PubMed] [Google Scholar]
- 65.Uppal R, Catana C, Ay I, Benner T, Sorensen AG, Caravan P. Bimodal thrombus imaging: simultaneous PET/MR imaging with a fibrin-targeted dual PET/MR probe--feasibility study in rat model. Radiology. 2011;258:812–820. doi: 10.1148/radiol.10100881. [DOI] [PMC free article] [PubMed] [Google Scholar]
- 66.Nahrendorf M, Jaffer FA, Kelly KA, Sosnovik DE, Aikawa E, Libby P, Weissleder R. Noninvasive vascular cell adhesion molecule-1 imaging identifies inflammatory activation of cells in atherosclerosis. Circulation. 2006;114:1504–1511. doi: 10.1161/CIRCULATIONAHA.106.646380. [DOI] [PubMed] [Google Scholar]
- 67.Li W, Nava RG, Bribriesco AC, Zinselmeyer BH, Spahn JH, Gelman AE, Krupnick AS, Miller MJ, Kreisel D. Intravital 2-photon imaging of leukocyte trafficking in beating heart. J Clin Invest. 2012;122:2499–2508. doi: 10.1172/JCI62970. [DOI] [PMC free article] [PubMed] [Google Scholar]
- 68.Jung K, Kim P, Leuschner F, Gorbatov R, Kim JK, Ueno T, Nahrendorf M, Yun SH. Endoscopic time-lapse imaging of immune cells in infarcted mouse hearts. Circ Res. 2013;112:891–899. doi: 10.1161/CIRCRESAHA.111.300484. [DOI] [PMC free article] [PubMed] [Google Scholar]
- 69.Sosnovik DE, Nahrendorf M, Deliolanis N, Novikov M, Aikawa E, Josephson L, Rosenzweig A, Weissleder R, Ntziachristos V. Fluorescence tomography and magnetic resonance imaging of myocardial macrophage infiltration in infarcted myocardium in vivo. Circulation. 2007;115:1384–1391. doi: 10.1161/CIRCULATIONAHA.106.663351. [DOI] [PubMed] [Google Scholar]
- 70.Leuschner F, Rauch PJ, Ueno T, Gorbatov R, Marinelli B, Lee WW, Dutta P, Wei Y, Robbins C, Iwamoto Y, Sena B, Chudnovskiy A, Panizzi P, Keliher E, Higgins JM, Libby P, Moskowitz MA, Pittet MJ, Swirski FK, Weissleder R, Nahrendorf M. Rapid monocyte kinetics in acute myocardial infarction are sustained by extramedullary monocytopoiesis. J Exp Med. 2012;209:123–137. doi: 10.1084/jem.20111009. [DOI] [PMC free article] [PubMed] [Google Scholar]
- 71.Rischpler C, Langwieser N, Souvatzoglou M, Batrice A, van Marwick S, Snajberk J, Ibrahim T, Laugwitz KL, Nekolla SG, Schwaiger M. PET/MRI early after myocardial infarction: evaluation of viability with late gadolinium enhancement transmurality vs. 18F-FDG uptake. Eur Heart J Cardiovasc Imaging. 2015;16:661–669. doi: 10.1093/ehjci/jeu317. [DOI] [PubMed] [Google Scholar]
- 72.Rischpler C, Nekolla SG, Kossmann H, Dirschinger RJ, Schottelius M, Hyafil F, Wester HJ, Laugwitz KL, Schwaiger M. Upregulated myocardial CXCR4-expression after myocardial infarction assessed by simultaneous GA-68 pentixafor PET/MRI. J Nucl Cardiol. 2016;23:131–133. doi: 10.1007/s12350-015-0347-5. [DOI] [PubMed] [Google Scholar]
- 73.Thackeray JT, Bengel FM. PET imaging of the autonomic nervous system. Q J Nucl Med Mol Imaging. 2016;60:362–382. [PubMed] [Google Scholar]
- 74.Rijnierse MT, Allaart CP, de Haan S, Harms HJ, Huisman MC, Wu L, Beek AM, Lammertsma AA, van Rossum AC, Knaapen P. Sympathetic denervation is associated with microvascular dysfunction in non-infarcted myocardium in patients with cardiomyopathy. Eur Heart J Cardiovasc Imaging. 2015;16:788–798. doi: 10.1093/ehjci/jev013. [DOI] [PubMed] [Google Scholar]
- 75.Schaffer CB, Friedman B, Nishimura N, Schroeder LF, Tsai PS, Ebner FF, Lyden PD, Kleinfeld D. Two-photon imaging of cortical surface microvessels reveals a robust redistribution in blood flow after vascular occlusion. PLoS Biol. 2006;4:e22. doi: 10.1371/journal.pbio.0040022. [DOI] [PMC free article] [PubMed] [Google Scholar]
- 76.Sigler A, Murphy TH. In vivo 2-photon imaging of fine structure in the rodent brain: before, during, and after stroke. Stroke. 2010;41:S117–23. doi: 10.1161/STROKEAHA.110.594648. [DOI] [PubMed] [Google Scholar]
- 77.Niklass S, Stoyanov S, Garz C, Bueche CZ, Mencl S, Reymann K, Heinze HJ, Carare RO, Kleinschnitz C, Schreiber S. Intravital imaging in spontaneously hypertensive stroke-prone rats-a pilot study. Exp Transl Stroke Med. 2014;6:1. doi: 10.1186/2040-7378-6-1. [DOI] [PMC free article] [PubMed] [Google Scholar]
- 78.Shih AY, Blinder P, Tsai PS, Friedman B, Stanley G, Lyden PD, Kleinfeld D. The smallest stroke: occlusion of one penetrating vessel leads to infarction and a cognitive deficit. Nat Neurosci. 2013;16:55–63. doi: 10.1038/nn.3278. [DOI] [PMC free article] [PubMed] [Google Scholar]
- 79.Li T, Pang S, Yu Y, Wu X, Guo J, Zhang S. sProliferation of parenchymal microglia is the main source of microgliosis after ischaemic stroke. Brain. 2013;136:3578–3588. doi: 10.1093/brain/awt287. [DOI] [PubMed] [Google Scholar]
- 80.Fumagalli S, Perego C, Ortolano F, De Simoni MG. CX3CR1 deficiency induces an early protective inflammatory environment in ischemic mice. Glia. 2013;61:827–842. doi: 10.1002/glia.22474. [DOI] [PubMed] [Google Scholar]
- 81.Huang JY, Li LT, Wang H, Liu SS, Lu YM, Liao MH, Tao RR, Hong LJ, Fukunaga K, Chen Z, Wilcox CS, Lai EY, Han F. In vivo two-photon fluorescence microscopy reveals disturbed cerebral capillary blood flow and increased susceptibility to ischemic insults in diabetic mice. CNS Neurosci Ther. 2014;20:816–822. doi: 10.1111/cns.12268. [DOI] [PMC free article] [PubMed] [Google Scholar]
- 82.Szalay G, Martinecz B, Lénárt N, Környei Z, Orsolits B, Judák L, Császár E, Fekete R, West BL, Katona G, Rózsa B, Dénes Á. Microglia protect against brain injury and their selective elimination dysregulates neuronal network activity after stroke. Nat Commun. 2016;7:11499. doi: 10.1038/ncomms11499. [DOI] [PMC free article] [PubMed] [Google Scholar]
- 83.Anenberg E, Arstikaitis P, Niitsu Y, Harrison TC, Boyd JD, Hilton BJ, Tetzlaff W, Murphy TH. Ministrokes in channelrhodopsin-2 transgenic mice reveal widespread deficits in motor output despite maintenance of cortical neuronal excitability. J Neurosci. 2014;34:1094–1104. doi: 10.1523/JNEUROSCI.1442-13.2014. [DOI] [PMC free article] [PubMed] [Google Scholar]
- 84.Cheng MY, Wang EH, Woodson WJ, Wang S, Sun G, Lee AG, Arac A, Fenno LE, Deisseroth K, Steinberg GK. Optogenetic neuronal stimulation promotes functional recovery after stroke. Proc Natl Acad Sci U S A. 2014;111:12913–12918. doi: 10.1073/pnas.1404109111. [DOI] [PMC free article] [PubMed] [Google Scholar]
- 85.Bauer AQ, Kraft AW, Wright PW, Snyder AZ, Lee JM, Culver JP. Optical imaging of disrupted functional connectivity following ischemic stroke in mice. Neuroimage. 2014;99:388–401. doi: 10.1016/j.neuroimage.2014.05.051. [DOI] [PMC free article] [PubMed] [Google Scholar]
- 86.Siffrin V, Brandt AU, Radbruch H, Herz J, Boldakowa N, Leuenberger T, Werr J, Hahner A, Schulze-Topphoff U, Nitsch R, Zipp F. Differential immune cell dynamics in the CNS cause CD4+ T cell compartmentalization. Brain. 2009;132:1247–1258. doi: 10.1093/brain/awn354. [DOI] [PubMed] [Google Scholar]
- 87.Paterka M, Siffrin V, Voss JO, Werr J, Hoppmann N, Gollan R, Belikan P, Bruttger J, Birkenstock J, Jung S, Esplugues E, Yogev N, Flavell RA, Bopp T, Zipp F. Gatekeeper role of brain antigen-presenting CD11c+ cells in neuroinflammation. EMBO J. 2016;35:89–101. doi: 10.15252/embj.201591488. [DOI] [PMC free article] [PubMed] [Google Scholar]
- 88.Shaked I, Hanna RN, Shaked H, Chodaczek G, Nowyhed HN, Tweet G, Tacke R, Basat AB, Mikulski Z, Togher S, Miller J, Blatchley A, Salek-Ardakani S, Darvas M, Kaikkonen MU, Thomas GD, Lai-Wing-Sun S, Rezk A, Bar-Or A, Glass CK, Bandukwala H, Hedrick CC. Transcription factor Nr4a1 couples sympathetic and inflammatory cues in CNS-recruited macrophages to limit neuroinflammation. Nat Immunol. 2015;16:1228–1234. doi: 10.1038/ni.3321. [DOI] [PMC free article] [PubMed] [Google Scholar]
- 89.Cai D, Cohen KB, Luo T, Lichtman JW, Sanes JR. Improved tools for the Brainbow toolbox. Nat Methods. 2013;10:540–547. [PubMed] [Google Scholar]
- 90.Loulier K, Barry R, Mahou P, Le Franc Y, Supatto W, Matho KS, Ieng S, Fouquet S, Dupin E, Benosman R, Chédotal A, Beaurepaire E, Morin X, Livet J. Multiplex cell and lineage tracking with combinatorial labels. Neuron. 2014;81:505–520. doi: 10.1016/j.neuron.2013.12.016. [DOI] [PubMed] [Google Scholar]
- 91.Desai M, Kahn I, Knoblich U, Bernstein J, Atallah H, Yang A, Kopell N, Buckner RL, Graybiel AM, Moore CI, Boyden ES. Mapping brain networks in awake mice using combined optical neural control and fMRI. J Neurophysiol. 2011;105:1393–1405. doi: 10.1152/jn.00828.2010. [DOI] [PMC free article] [PubMed] [Google Scholar]
- 92.Kahn I, Desai M, Knoblich U, Bernstein J, Henninger M, Graybiel AM, Boyden ES, Buckner RL, Moore CI. Characterization of the functional MRI response temporal linearity via optical control of neocortical pyramidal neurons. J Neurosci. 2011;31:15086–15091. doi: 10.1523/JNEUROSCI.0007-11.2011. [DOI] [PMC free article] [PubMed] [Google Scholar]
- 93.Wehrl HF, Hossain M, Lankes K, Liu CC, Bezrukov I, Martirosian P, Schick F, Reischl G, Pichler BJ. Simultaneous PET-MRI reveals brain function in activated and resting state on metabolic, hemodynamic and multiple temporal scales. Nat Med. 2013;19:1184–1189. doi: 10.1038/nm.3290. [DOI] [PubMed] [Google Scholar]
- 94.Sander CY, Hooker JM, Catana C, Normandin MD, Alpert NM, Knudsen GM, Vanduffel W, Rosen BR, Mandeville JB. Neurovascular coupling to D2/D3 dopamine receptor occupancy using simultaneous PET/functional MRI. Proc Natl Acad Sci U S A. 2013;110:11169–11174. doi: 10.1073/pnas.1220512110. [DOI] [PMC free article] [PubMed] [Google Scholar]
- 95.Loggia ML, Chonde DB, Akeju O, Arabasz G, Catana C, Edwards RR, Hill E, Hsu S, Izquierdo-Garcia D, Ji RR, Riley M, Wasan AD, Zürcher NR, Albrecht DS, Vangel MG, Rosen BR, Napadow V, Hooker JM. Evidence for brain glial activation in chronic pain patients. Brain. 2015;138:604–615. doi: 10.1093/brain/awu377. [DOI] [PMC free article] [PubMed] [Google Scholar]
- 96.Dutta P, Courties G, Wei Y, Leuschner F, Gorbatov R, Robbins CS, Iwamoto Y, Thompson B, Carlson AL, Heidt T, Majmudar MD, Lasitschka F, Etzrodt M, Waterman P, Waring MT, Chicoine AT, van der Laan AM, Niessen HW, Piek JJ, Rubin BB, Butany J, Stone JR, Katus HA, Murphy SA, Morrow DA, Sabatine MS, Vinegoni C, Moskowitz MA, Pittet MJ, Libby P, Lin CP, Swirski FK, Weissleder R, Nahrendorf M. Myocardial infarction accelerates atherosclerosis. Nature. 2012;487:325–329. doi: 10.1038/nature11260. [DOI] [PMC free article] [PubMed] [Google Scholar]
- 97.Dutta P, Sager HB, Stengel KR, Naxerova K, Courties G, Saez B, Silberstein L, Heidt T, Sebas M, Sun Y, Wojtkiewicz G, Feruglio PF, King K, Baker JN, van der Laan AM, Borodovsky A, Fitzgerald K, Hulsmans M, Hoyer F, Iwamoto Y, Vinegoni C, Brown D, Di Carli M, Libby P, Hiebert SW, Scadden DT, Swirski FK, Weissleder R, Nahrendorf M. Myocardial Infarction Activates CCR2(+) Hematopoietic Stem and Progenitor Cells. Cell Stem Cell. 2015;16:477–487. doi: 10.1016/j.stem.2015.04.008. [DOI] [PMC free article] [PubMed] [Google Scholar]
- 98.Heidt T, Sager HB, Courties G, Dutta P, Iwamoto Y, Zaltsman A, von Zur Muhlen C, Bode C, Fricchione GL, Denninger J, Lin CP, Vinegoni C, Libby P, Swirski FK, Weissleder R, Nahrendorf M. Chronic variable stress activates hematopoietic stem cells. Nat Med. 2014;20:754–758. doi: 10.1038/nm.3589. [DOI] [PMC free article] [PubMed] [Google Scholar]
- 99.Tawakol A, Ishai A, Takx RA, Figueroa AL, Ali A, Kaiser Y, Truong QA, Solomon CJ, Calcagno C, Mani V, Tang CY, Mulder WJ, Murrough JW, Hoffmann U, Nahrendorf M, Shin LM, Fayad ZA, Pitman RK. Relation between resting amygdalar activity and cardiovascular events: a longitudinal and cohort study. Lancet. 2017;6736:31714–31717. doi: 10.1016/S0140-6736(16)31714-7. [DOI] [PMC free article] [PubMed] [Google Scholar]
- 100.Van Horn JD, Toga AW. Human neuroimaging as a “Big Data” science. Brain Imaging Behav. 2014;8:323–331. doi: 10.1007/s11682-013-9255-y. [DOI] [PMC free article] [PubMed] [Google Scholar]
- 101.Hood L, Heath JR, Phelps ME, Lin B. Systems biology and new technologies enable predictive and preventative medicine. Science. 2004;306:640–643. doi: 10.1126/science.1104635. [DOI] [PubMed] [Google Scholar]
Associated Data
This section collects any data citations, data availability statements, or supplementary materials included in this article.