

Abstract
High-density lipoproteins (HDLs) protect pancreatic β-cells against apoptosis. This property might relate to the increased risk to develop diabetes in patients with low HDL blood levels. However, the mechanisms by which HDLs protect β-cells are poorly characterized. Here we used a transcriptomic approach to identify genes differentially modulated by HDLs in β-cells subjected to apoptotic stimuli. The transcript encoding 4E-binding protein (4E-BP)1 was up-regulated by serum starvation, and HDLs blocked this increase. 4E-BP1 inhibits cap-dependent translation in its non- or hypophosphorylated state but it loses this ability when hyperphosphorylated. At the protein level, 4E-BP1 was also up-regulated in response to starvation and IL-1β, and this was blunted by HDLs. Whereas an ectopic increase of 4E-BP1 expression induced β-cell death, silencing 4E-BP1 increase with short hairpin RNAs inhibited the apoptotic-inducing capacities of starvation. HDLs can therefore protect β-cells by blocking 4E-BP1 protein expression, but this is not the sole protective mechanism activated by HDLs. Indeed, HDLs blocked apoptosis induced by endoplasmic reticulum stress with no associated decrease in total 4E-BP1 induction. Although, HDLs favored the phosphorylation, and hence the inactivation of 4E-BP1 in these conditions, this appeared not to be required for HDL protection. Our results indicate that HDLs can protect β-cells through modulation of 4E-BP1 depending on the type of stress stimuli.
Inhibition of 4E-BP1 up-regulation is a stimulus-specific mechanism by which HDLs protect beta cells from apoptosis.
Diabetes is one of the major health problems worldwide. The incidence of type 2 diabetes has increased at a very fast rate over the last decades, reaching epidemic proportions (1, 2). Type 2 diabetes is recognized as a complex disease where environmental factors interplay with genetically determined susceptibility factors (2, 3, 4). It is often associated with metabolic lipid disorders characterized by higher levels of triglycerides, free fatty acids, and small dense low-density lipoprotein particles and low high-density lipoprotein (HDL) levels in plasma (5). Even though clear randomized controlled trials have yet to demonstrate that drugs specifically aimed at raising plasma HDL particles can reduce diabetes onset (6, 7), the association of low HDLs and increased risk of developing diabetes suggest that HDLs exert beneficial functions on β-cells. Consistent with this notion is the observation that HDL particles directly protect pancreatic β-cells against apoptosis (8, 9) and restore the function of stressed β-cells (9, 10). However, the molecular mechanisms underlying this protection are poorly defined. To gain insight into the molecules involved in β-cell protection by HDLs, a transcriptomic analysis was performed on β-cells subjected to a metabolic stress in the presence or absence of HDL particles. Our results indicate that the expression of the gene encoding 4E-binding protein (4E-BP)1, a translation regulator, depending on the stress stimulus, is down-regulated or hyperphosphorylated by HDLs. 4E-BP1 down-regulation participates in HDL-mediated protection of starved β-cells. In contrast, the hyperphosphorylation of 4E-BP1, known to lead to its inactivation, did not appear to play a role in the way by which HDLs inhibit endoplasmic reticulum (ER) stress-induced β-cell apoptosis.
Results
Gene array analysis
A transcriptomic analysis was performed to identify genes regulated by HDLs in the context of their protective effect on pancreatic β-cells in response to stress. Trophic factor removal was used as a broad-acting stress that perturbs the general homeostasis of the cell and that causes cell death during islet isolation (11) or that could mimic the atherosclerotic lesions observed in the pancreas in old and/or diabetic patients (12). The insulin-secreting β-TC3 cell line was therefore subjected to serum deprivation in the absence or in the presence of 1 mm human HDL-cholesterol. After a 72-h serum deprivation period, about 20% of the cells were undergoing apoptosis (Fig. 1A). As expected, the presence of HDLs markedly blunted this cell death response (Fig. 1A). To identify the earliest genes regulated by HDLs that could mediate their protective effect, β-TC3 cells were treated as in Fig. 1A but lysed after 6 h of treatment for the preparation of the cRNAs to be hybridized on Affymetrix oligonucleotide microarrays. Three comparisons were made between the different groups to select genes significantly affected by serum deprivation alone, HDL incubation alone, or by the interaction of these two factors (i.e. genes the regulation of which by serum deprivation was modulated by HDLs). This analysis resulted in the identification of almost 10,000 genes that were significantly regulated by serum deprivation and about 400 by HDLs. Among the 10,000 genes regulated by serum deprivation, only 262 had their induction or repression affected by HDLs (Fig. 1B). A selection of the genes the regulation of which by serum deprivation was affected by HDLs is presented in Table 1.
Fig. 1.
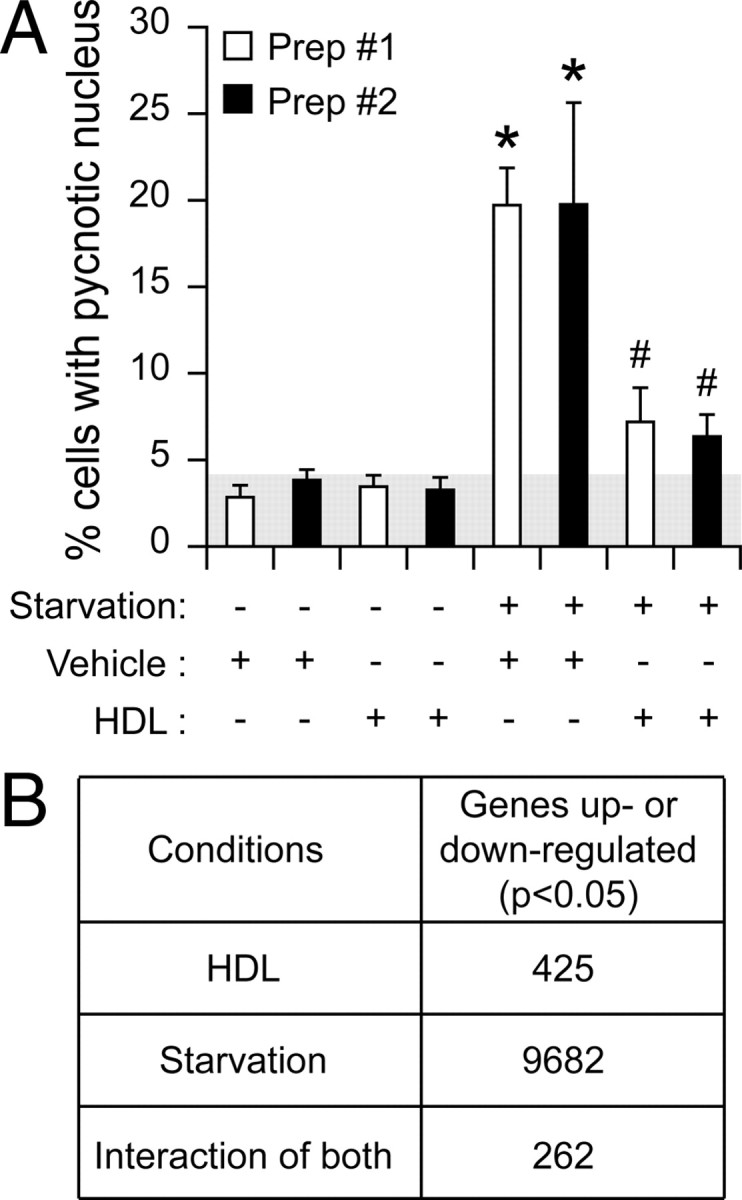
Genes from insulin-secreting cells modulated by stress (serum deprivation) and HDLs. A, βTC3 cells were grown for 2 d in complete medium, washed twice with 3 ml PBS, and incubated for 72 h in the presence or in the absence of 1 mm HDL-cholesterol in either complete medium or in medium lacking serum. Apoptosis was then quantified. The results correspond to the mean ± sem of two independent experiments performed in triplicate and that involved two different preparations of HDLs. Asterisks denote a statistically significant difference with the control condition (vehicle only). Pound signs indicate a statistically significant difference with the vehicle + starvation condition. The threshold of significance was at P = 0.010 (five comparisons for each HDL preparation). B, βTC3 cells were treated as described in panel A except that the cells were subjected to the indicated conditions for 6 h. After RNA extraction, the cRNA was prepared separately for each condition and hybridized to Affymetrix mouse 430 version 2 gene chip (Affymetrix). The numbers of genes significantly (adjusted P < 0.05) up- or down-regulated by HDLs, serum deprivation, or those the modulation by serum deprivation of which was altered by HDLs (interaction of both) are listed. See Materials and Methods for details. Prep., Preparation.
Table 1.
Genes induced or repressed by serum deprivation that display the highest differential modulation by HDLs
| Gene symbol | Gene title | Fold change | P value | |
|---|---|---|---|---|
| Cyp4v3 | Cytochrome P450, family 4, subfamily v, polypeptide 3 | 1.15 | 0.0271 | S+ |
| Apcs | Serum amyloid P-component | 1.13 | 0.0234 | S+ |
| 4930429H24Rik | RIKEN cDNA 4930429H24 gene | 0.75 | 0.0302 | A+ |
| Fosl2 | fos-Like antigen 2 | 0.75 | 0.0019 | A+ |
| Cebpb | CCAAT/enhancer binding protein (C/EBP), β | 0.75 | 0.0145 | A+ |
| Depdc6 | DEP domain containing 6 | 0.74 | 0.0257 | A+ |
| Vldlr | Very-low-density lipoprotein receptor | 0.74 | 0.0008 | A+ |
| Crem | CAMP-responsive element modulator | 0.74 | 0.0019 | A+ |
| Cebpb | CCAAT/enhancer-binding protein (C/EBP), β | 0.72 | 0.0070 | A+ |
| Nupr1 | Nuclear protein 1 | 0.71 | 0.0019 | A+ |
| Mbd5 | Methyl-CpG-binding domain protein 5 | 0.70 | 0.0022 | A+ |
| Gpt2 | Glutamic pyruvate transaminase (alanine aminotransferase) 2 | 0.68 | 0.0019 | A+ |
| Vldlr | Very-low-density lipoprotein receptor | 0.67 | 0.0049 | A+ |
| Trim66 | Tripartite motif-containing 66 | 0.67 | 0.0345 | A+ |
| Gpt2 | Glutamic pyruvate transaminase (alanine aminotransferase) 2 | 0.64 | 0.0045 | A+ |
| Nupr1 | Nuclear protein 1 | 0.63 | 0.0015 | A+ |
| Vldlr | Very-low-density lipoprotein receptor | 0.75 | 0.0217 | A+ |
| Eif4ebp1 | Eukaryotic translation initiation factor 4E-binding protein 1 | 0.73 | 0.0128 | A+ |
| Eif4ebp1 | Eukaryotic translation initiation factor 4E-binding protein 1 | 0.73 | 0.0019 | A+ |
| LOC98434 | Hypothetical LOC98434 | 0.71 | 0.0019 | A+ |
| Trib3 | Tribbles homolog 3 (Drosophila) | 0.64 | 0.0072 | A+ |
| Trib3 | Tribbles homolog 3 (Drosophila) | 0.55 | 0.0019 | A+ |
| Apob | Apolipoprotein B | 1.23 | 0.0144 | A− |
| Rasgrp1 | RAS guanyl-releasing protein 1 | 1.23 | 0.0291 | A− |
| 4932417H02Rik | RIKEN cDNA 4932417H02 gene | 1.20 | 0.0234 | A− |
| Dusp15 | Expressed sequence AI851682 | 1.20 | 0.0118 | A− |
| Slc2a2 | Solute carrier family 2 (facilitated glucose transporter), member 2 | 1.30 | 0.0022 | A− |
| Nudt7 | Nudix (nucleoside diphosphate-linked moiety X)-type motif 7 | 1.26 | 0.0093 | A− |
| Hnrpd | Heterogeneous nuclear ribonucleoprotein D | 1.21 | 0.0301 | A− |
| Aldh1l2 | Aldehyde dehydrogenase 1 family, member L2 | 0.87 | 0.0350 | S− |
| Eif2s2 | Eukaryotic translation initiation factor 2, subunit 2 (β) | 0.85 | 0.0367 | S− |
| 6430517E21Rik | RIKEN cDNA 6430517E21 gene | 0.85 | 0.0329 | S− |
| 2700022B06Rik | RIKEN cDNA 2700022B06 gene | 0.85 | 0.0222 | S− |
| Gpc6 | Glypican 6 | 0.85 | 0.0215 | S− |
| Slc30a1 | Solute carrier family 30 (zinc transporter), member 1 | 0.82 | 0.0070 | S− |
| Egr1 | Early growth response 1 | 0.81 | 0.0106 | S− |
| 1810008K03Rik | RIKEN cDNA 1810008K03 gene | 0.74 | 0.0145 | S− |
The indicated fold changes correspond to the ratio of the (″HDL + serum deprivation″ condition/vehicle condition) values over the (serum deprivation condition/vehicle condition) values (S+, HDLs amplify the stimulation effect of serum deprivation (synergistic effect); A+, HDLs decrease the stimulation effect of serum deprivation (buffering effect); A−, HDLs decrease the inhibitory effect of serum deprivation (buffering effect); S−, HDLs increase the inhibitory effect of serum deprivation (synergistic effect). In the A+ category, only the genes associated with a HDL-induced modulation ≥25% (i.e. fold changes ≤0.75 and ≥1.25) are shown. In the A− category, only the genes associated with a HDL-induced modulation ≥20% (i.e. fold changes ≤0.80 and ≥1.20) are shown. A gene symbol can be mentioned several times if identified as significantly regulated by independent probe sets. The full list of the 262 genes induced or repressed by serum deprivation that are differentially modulated by HDLs can be found in supplemental Table 5.
The fold changes in gene expression induced by HDLs on starved cells was only moderate (Table 1), most likely because we focused our analysis on a early time point (6 h) when the antiapoptotic effects of HDLs are not yet observed (data not shown). To assess the validity of such small changes in expression levels, we determined whether genes expected to be regulated by HDLs were indeed found to be significantly modulated in the transcriptomic analysis. HDLs can induce cholesterol efflux from cells, macrophages in particular (13), but they can also deliver cholesterol to cells (14, 15). This cholesterol transfer is expected to keep sterol-regulatory element-binding proteins (SREBPs) anchored in the ER away from the nucleus, preventing the expression of SREBP-regulated genes (16, 17). Many of the genes involved in cholesterol synthesis are regulated by SREBPs (18) and are consequently turned off when cells are incubated with cholesterol-containing lipoproteins (16). Figure 2 shows that the expression of seven of 15 SREBP-regulated genes involved in cholesterol synthesis were significantly reduced in the present transcriptomic analysis. This indicates that, despite the early time point chosen, our approach can detect some of the expected changes in gene expression induced by HDLs.
Fig. 2.

HDL effect on cholesterol synthesis genes. The figure shows enzymes involved in cholesterol synthesis that are regulated by SREBPs. Those the mRNAs of which were found to be negatively modulated by HDLs in the transcriptomic analysis are in gray boxes. The numbers correspond to the decrease in mRNAs levels induced by HDLs in starved cells compared with the values obtained from control starved cells. Asterisks indicate when the decrease is statistically significant (*, P < 0.05; **, P < 0.01; ***, P < 0.001). Hmgcs1, 3-Hydroxy-3-methyl-glutaryl (HMG)-CoA synthase 1; Hmgcr, HMG-CoA reductase; Mvk, mevalonate kinase; Pmvk, phospho-mevalonate kinase; Mvd, mevalonate pyrophosphate decarboxylate; Idi1, isopentenyl-diphosphate Δ-isomerase 1; Fdps, farnesyl diphosphate synthase; Fdft1, farnesyl diphosphate farnesyl transferase 1; Sqle, squalene epoxidase; Lss, lanosterol synthase; CYP51, lanosterol 14α-demethylase; Sc4 mol, sterol-C4-methyl oxidase-like; Nsdhl, nicotinamide adenine dinucleotide (phosphate)-dependent steroid dehydrogenase-like; Sc5d, sterol C5-desaturase; Dhcr7, 7-dehydrocholesterol reductase.
Regulation of 4E-BP1 levels by HDLs in stressed insulin-secreting cells
The eukaryotic initiation factor 4E-BP1, a regulator of cap-dependent translation (19, 20), was found to be significantly regulated by serum deprivation and HDLs (Fig. 3A and Table 1). Cap-dependent translation requires the formation of a complex between the eukaryotic translation initiation factors eiF4E and eiF4G. 4E-BP1 has the capacity to bind to eiF4E (21), which blocks the formation of the eiF4E-eiF4G complex and consequently the initiation of cap-dependent translation (22). 4E-BP1 is phosphorylated on multiple sites in a multistep mechanism: mammalian target of rapamycin (mTOR) phosphorylates human 4E-BP1 on two basal sites, Thr37 and Thr46 (23). Phosphorylation of these residues, although not interfering with the capacity to bind to eiF4E (23), is a priming event for subsequent phosphorylation of several sites within the eiF4E binding site (Ser65, Thr70, Ser83) that will block the ability of 4E-BP1 to repress translation (23). Different phosphorylation forms can by visualized by Western blot analysis (Fig. 3): band α corresponds to a hypophosphorylated form, band β corresponds to an intermediate phosphorylated form, and band γ corresponds to a hyperphosphorylated form bearing in particular the phosphorylated Ser65 and Thr70 residues (24).
Fig. 3.

HDL regulation of 4E-BP1 levels. A, Left graph: 4E-BP1 transcript levels derived from the gene array data. The indicated fold changes were normalized to the mRNA levels obtained in control cells (mean ± sd). The results were derived from the cell samples used in Fig. 1A analyzed with two different 4E-BP1 probe sets. The threshold of significance was at P = 0.025 (two comparisons). Right graph: MIN6 cells were left untreated or subjected to a 6-h serum starvation in the presence or in the absence of 1 mm HDL. The 4E-BP1 mRNA levels were then quantitated by real-time PCR. The results are normalized to the mRNA expression levels of the reference protein RPLP0 and expressed as fold increase over the value obtained in untreated cells (mean ± sem; five independent experiments). The threshold of significance was at P = 0.0167 (three comparisons). B, 4E-BP1 total protein expression levels were followed during 48 h. βTC3 cells were grown for 2 d in complete medium, washed twice with PBS, and then incubated in culture medium lacking serum for the indicated periods of times. Cells were lysed and the lysates were subjected to Western blot analysis to assess 4E-BP1 protein expression levels. The results are expressed as the fold increase over the basal 4E-BP1 levels at t = 0 h (mean ± sem of six independent experiments). C, βTC3 cells were grown for 2 d in complete medium, washed twice with PBS, and then incubated for 24 h in serum containing medium (CM) or in medium lacking serum (St) in the presence or in the absence of 1 mm HDL. Cell lysates were subjected to Western blot analysis to assess 4E-BP1 and actin protein expression levels. Representative blots are shown at the top and the quantitation of the 4E-BP1 signals is shown at the bottom. The values for 4E-BP1 in the graph were normalized to actin levels (mean ± sem; eight independent experiments). The threshold of significance was at P = 0.0167 (three comparisons). MW, Molecular weight. D, MIN6 cells were treated as described in panel C. The results were derived from 19 independent experiments. The threshold of significance was at P = 0.0167 (three comparisons). E, Human islets were starved (St.) or not (CM) for 24 h in the absence or in the presence of 1 mm HDLs. The islets were then lysed and 10–20 μg of the lysates were subjected to Western blot analysis to assess 4E-BP1 expression. The values for 4E-BP1 in the graph were normalized to actin levels (mean ± sem; three independent experiments performed with islets from different donors). NS, Nonsignificant; WB, Western blot. *, Statistically significant as defined in Materials and Methods; α, hypophosphorylated form; β, intermediate phosphorylated form; γ, hyperphosphorylated form.
4E-BP1 transcript levels increased upon serum deprivation, but this increase was blocked by HDLs (Fig. 3A). A time course experiment was performed to determine the pattern of 4E-BP1 protein expression upon serum deprivation. Figure 3B shows that maximal induction of 4E-BP1 protein (1.6-fold) is reached 24 h after serum deprivation. One day of serum deprivation was therefore used in later experiments to assess the effect of HDLs on serum deprivation-induced 4E-BP1 expression. In the βTC3 and MIN6 insulinoma cell lines (Fig. 3, C and D) and in primary human islets (Fig. 3E), the up-regulation of 4E-BP1 protein levels induced by serum deprivation was blunted by HDLs (the changes observed in human islets did not reach statistical significance however). The modulation of 4E-BP1 total protein levels in starved cells by HDLs, however, was not accompanied by a marked change in the proportion of the inactive 4E-BP1 form (band γ) among all forms of 4E-BP1 (slight increase of about 5%; see Table 2).
Table 2.
HDLs increase the proportion of the γ−form of 4E-BP1 in β−cells experiencing ER stress
| No HDL | With HDLs | Variation induced by HDLs | No. of independent experiments | |
|---|---|---|---|---|
| Serum deprivation | 47.9 ± 5.1% | 52.8 ± 4.7% | +4.9 ± 1.7%a | 10 |
| IL-1β | 52.1 ± 2.2% | 54.2 ± 1.9% | +2.1 ± 0.5%a | 6 |
| TM | 50.4 ± 4.9% | 62.6 ± 5.0% | +12.2 ± 3.7%a | 5 |
| TG | 57.5 ± 1.9% | 70.9 ± 5.2% | +16.2 ± 2.7%a | 3 |
The percentage of the γ form of 4E-BP1 among total 4E-BP1 in cells subjected to the indicated stresses in the absence or in the presence of HDLs was determined from Western blot analyses such as those depicted in Figs. 3, 4, and 6. The variation of this percentage induced by HDLs is indicated in the last column (a indicates a statistically significant increase as assessed by t test analyses after Bonferonni correction). The increase in the variation induced by HDLs in cells subjected to ER stress (TM or TG) was significantly higher (∼3- to 6-fold) than the corresponding increase in cells exposed to serum deprivation or IL-1β (P < 0.001; one-way ANOVA analysis). In contrast, the increase in the variation induced by HDLs was not statistically different within the “serum deprivation/IL-1β” group or within the “ER stress” group (P = 0.26).
To determine whether the regulation of 4E-BP1 protein levels in insulin-secreting cells could be regulated by HDLs in response to apoptotic stimuli other than serum deprivation, MIN6 cells were treated with IL-1β (10 ng/ml) for 72 h in the absence or in the presence of HDLs. The induction of apoptosis by IL-1β correlated with increased 4E-BP1 expression (Fig. 4).
Fig. 4.
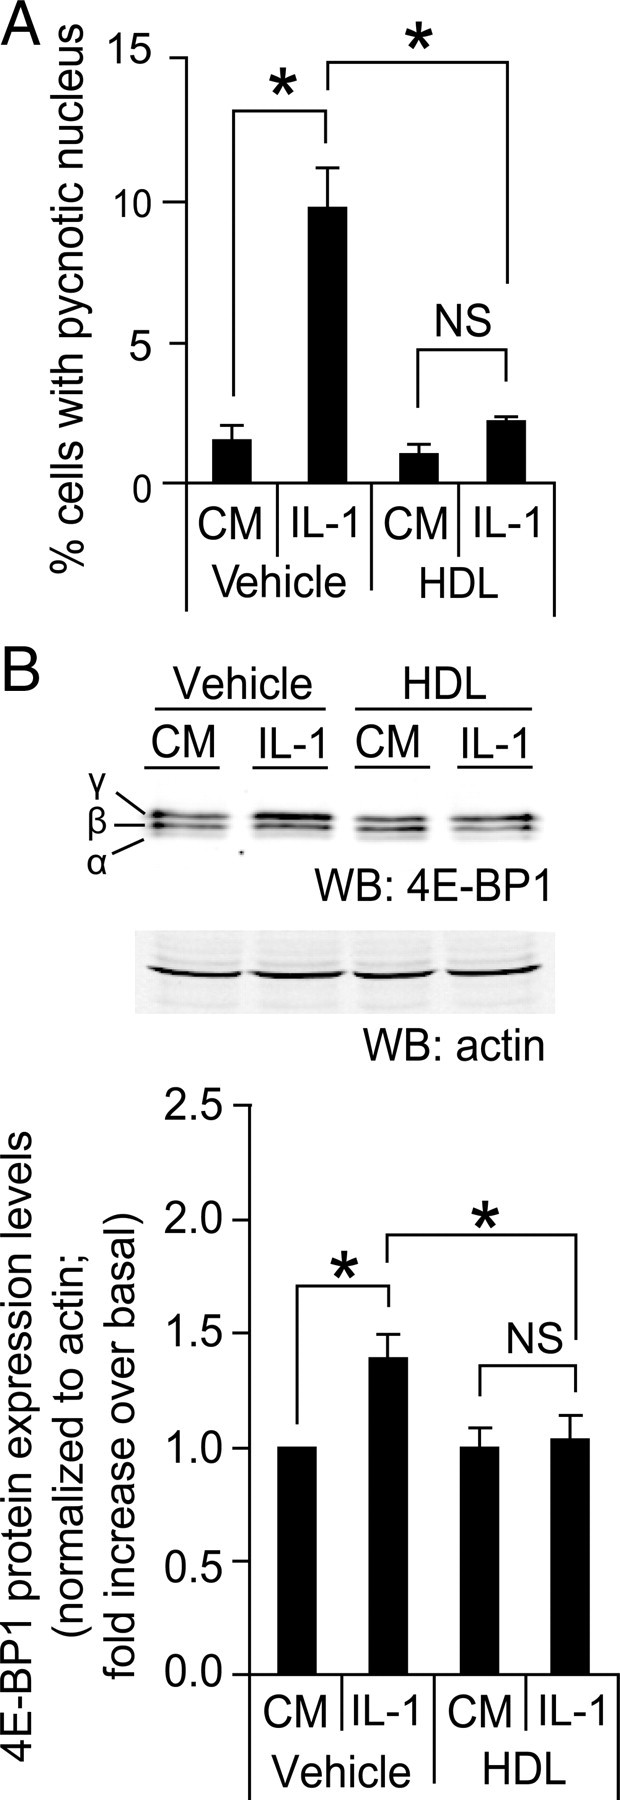
Effect of HDLs on IL-1β-induced apoptosis and increased 4E-BP1 levels. A, MIN6 cells were grown 2 d in complete medium, washed twice with PBS, and then incubated for 72 h, either in control conditions [culture medium containing serum (CM)] or treated with 10 ng/ml of IL-1β in the absence (vehicle) or in the presence of 1 mm HDLs. Apoptosis was then determined. The results correspond to the mean ± sem of four independent experiments. The threshold of significance was at P = 0.0167 (three comparisons). B, Alternatively, the cells treated or not with IL-1β were lysed and Western blot analysis was performed as described in Fig. 3B. The values for 4E-BP1 in the bar graph (black bars, mean ± sem; seven independent experiments) were normalized to actin levels. The threshold of significance was at P = 0.0167 (three comparisons). NS, Nonsignificant; WB, Western blot. *, Statistically significant as defined in Materials and Methods; α, hypophosphorylated form; β, intermediate phosphorylated form; γ, hyperphosphorylated form.
HDLs significantly reduced the extent of the death response induced by the cytokine, and this was accompanied by a reduction in 4E-BP1 expression levels (Fig. 4). As was the case for serum deprivation, HDLs did not markedly affect the proportion of the γ-form among all 4E-BP1 forms in IL-1β-treated cells (marginal increase of ∼2%; Table 2).
We next assessed whether the mere overexpression of 4E-BP1 could mimic the ability of serum deprivation to induce apoptosis. Figure 5A shows that transfection of MIN6 cells with a plasmid encoding 4E-BP1 induced an apoptotic response in nonstarved cells similar to the death response observed in starved cells transfected with a control plasmid. Interestingly, there was no further increase in apoptosis induced by 4E-BP1 expression in starved cells (compare the last two lanes in Fig. 5A). This is consistent with the notion that increased 4E-BP1 expression is a limiting event in the mechanism by which serum deprivation induces apoptosis.
Fig. 5.

4E-BP1 induces apoptosis in insulin-producing cells. A, MIN6 cells were transfected with a control vector (pcDNA3) or with the m4E-BP1.sport6 plasmid encoding 4E-BP1 together with a GFP-encoding plasmid (pEGFP-C1). The following day, the cells were incubated in normal (CM) or serum-free medium (St.) for an additional 24-h period. Apoptosis was then determined by scoring GFP-positive cells displaying a pycnotic nucleus. The results correspond to the mean ± sem of five independent experiments. The threshold of significance was at P = 0.0167 (three comparisons). B, MIN6 cells were infected with 0.8 ml empty viruses or 0.8 ml V5–4E-BP1-encoding viruses. The culture medium was changed 24 h later. After an additional 48-h period, the cells were split and 2 d later the cells were incubated for 24 h in control serum-containing medium (CM) or in serum-free medium (St.). Finally, the cells were lysed to assess 4E-BP1 expression by Western blot analysis. Alternatively, the percentage of apoptotic cells was determined. The results correspond to the mean ± sem of four independent experiments. The threshold of significance was at P = 0.0167 (three comparisons). In addition, the cells were submitted to immunostaining using an anti-V5 antibody to assess the infection efficiency (the nuclei were labeled with the Hoechst 33342 dye). C, HEK 293T cells were transfected or not with a mouse 4E-BP1-encoding plasmid (m4EBP1.sport6) together with increasing quantities of 4E-BP1-specific shRNA-encoding plasmid (m4EBP1-29.spr). The cells were lysed 2 d later, and the lysates were subjected to Western blot analysis. The blot is representative of three independent experiments. Ectopic expression of 4E-BP1 resulted in the appearance of four to five immunoreactive bands on Western blots, a pattern that differed from what was observed with the endogenous protein (see Fig. 3D for example), and which may have resulted from overexpression of the protein from the m4EBP1.sport6 plasmid. Note that the exposure time used to reveal the ectopically expressed 4E-BP1 barely allows the visualization of the endogenous protein (first lane). D, MIN6 cells were infected with m4E-BP1-si29 lentiviruses. The cells were washed 72 h later twice with PBS and starved or not for an additional 24-h period, at which point the cells were lysed to assess 4E-BP1 expression (left panel). Alternatively, apoptosis was scored (right panel). The results correspond to the mean ± sem of four independent experiments. The threshold of significance was at P = 0.0167 (three comparisons). The differences in basal and starvation-induced apoptosis between panel A and panels B and D likely result from the use of different transduction methods (transfection in panel A and infection followed by cell recovery in panels B and D). Despite these differences, the fold increase induced by starvation over the basal apoptosis remains similar (∼3 fold). NS, Nonsignificant; WB, Western blot. *, Statistically significant as defined in Materials and Methods; α, hypophosphorylated form; β, intermediate phosphorylated form; γ, hyperphosphorylated form.
The experiment above does not allow precise quantitation of the level of 4E-BP1 expression in the transfected cells because the transfection efficiency obtained with lipofectamine in MIN6 cells is less than 30%. We therefore used lentiviral infection to ensure that the whole-cell population would express a 4E-BP1-encoding construct. MIN6 cells were infected with a lentivirus bearing a V5-tagged 4E-BP1 construct. The amount of virus chosen for the infection resulted in virtually all of the cells expressing the V5-tagged 4E-BP1 protein (Fig. 5B, right panel) and led to an increased expression of 4E-BP1 comparable to what was obtained in starved cells (Fig. 5B, left panel). Importantly, the resulting apoptotic response was similar between the V5–4E-BP1-expressing cells and the starved cells (Fig. 5B, middle panel), suggesting that 4E-BP1 induction in insulinoma cells subjected to an apoptotic stimulus can fully account for the death response that ensues.
Finally we used a gene-silencing approach to have a direct assessment of the implication of 4E-BP1 induction levels in the apoptotic response observed in stressed insulinoma cells. Several small interfering RNAs (siRNAs) directed at the 4E-BP1 mRNA were designed. The best of these reduced by approximately 60% the expression of ectopically expressed 4E-BP1 (Fig. 5C). This siRNA was found to partially inhibit the induction of 4E-BP1 expression induced by serum deprivation, but it did not modulate the basal levels of the protein (Fig. 5D, left panel). This, in fact, allowed us to specifically assess the role of 4E-BP1 induction in response to stress independently of a possible confounding influence on the basal expression of the protein. A reduction in the serum deprivation-induced increase in 4E-BP1 expression with the siRNA led to a concomitant decrease in the apoptotic response (Fig. 5D, right panel). Altogether, these results indicate that up-regulation of 4E-BP1 expression levels is an important determinant of the apoptotic response observed in β-cells.
Recent genetic and biochemical evidence in both humans and mice supports a requirement for the unfolded protein response to preserve ER homeostasis and prevent β-cell failure. Chronic or overwhelming ER stress stimuli, associated, for example, with overstimulation of β-cells, can disrupt protein folding in the ER, reduce insulin production, and activate cell death pathways (25). In this context, the ER stress-inducing drugs, tunicamycin (TM) and thapsigargin (TG), have recently been shown to increase 4E-BP1 expression in β-cells in an activating transcription factor 4 (ATF4)-dependent manner (26). To assess the ability of HDLs to protect β-cells from ER stresses, MIN6 cells were incubated with TM and TG in the absence or in the presence of HDLs. Figure 6A shows that HDLs very efficiently protected β-cells from ER stress-induced apoptosis. As reported (26), TM and TG induced an increase in 4E-BP1 expression, but this was not blunted by HDLs (Fig. 6, B and C). However, the proportion of the γ-form (i.e. the hyperphosphorylated inactive form) in β-cells experiencing ER stress was increased by HDLs to a significantly higher level compared with stresses such as serum deprivation and IL-1β (Table 2). This suggests that in response to ER stress, HDLs can favor 4E-BP1 inhibition by promoting its hyperphosphorylation. However, in the presence of rapamycin, a mTORC1 inhibitor, the protection against ER stress induced by HDLs remained unaffected (Fig. 6C). The dose of rapamycin used efficiently inhibited mTORC1 activity (as assessed by the blockage of the phosphorylation of the mTORC1 substrate S6K; bottom blot of Fig. 6D) that was accompanied by an efficient inhibition of 4E-BP1 phosphorylation (top blot of Fig. 6D). These results indicate that hyperphosphorylation of 4E-BP1 is not required for HDL-mediated protection of ER-stressed β-cells (Fig. 6C).
Fig. 6.
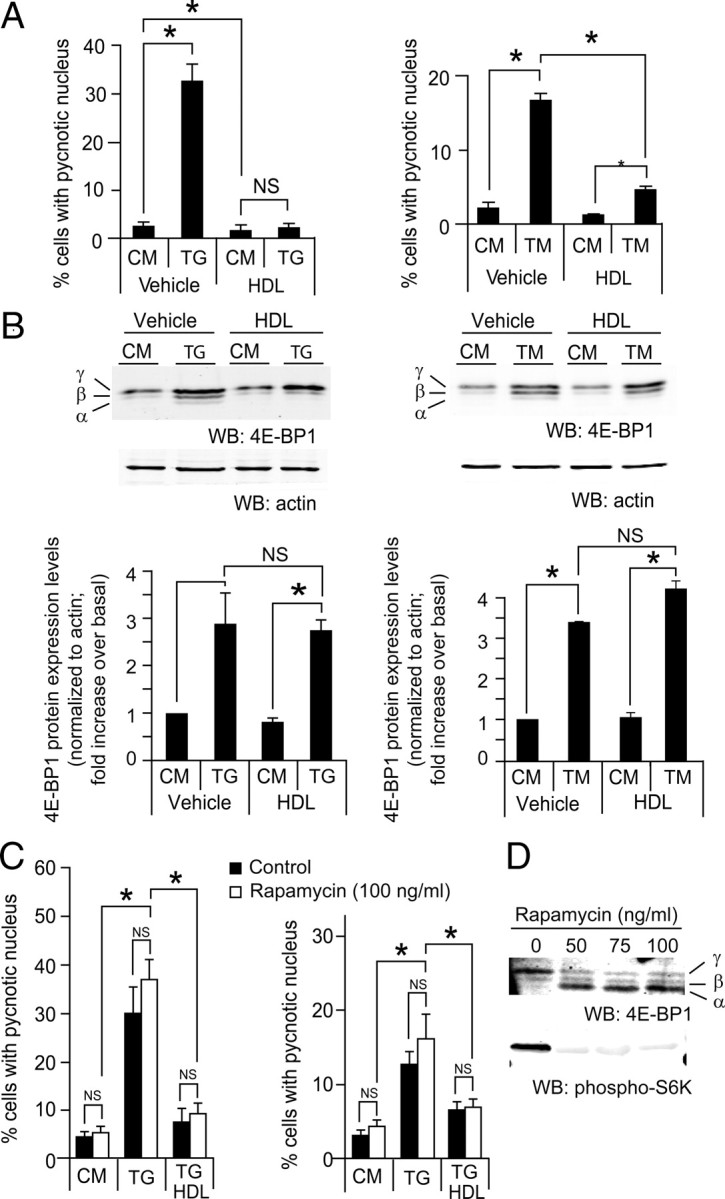
HDLs protect form ER stress-induced apoptosis independently of 4E-BP1. A and B, MIN6 cells were plated at 0.5 million per well in six-well plates and cultured for 2 d. They were then treated with 0.5 μm TG or 2 μg/ml TM in the presence or in the absence of 1 mm HDL for 24 h. Cells were then fixed, and apoptosis was determined by scoring the percentage of cells displaying pycnotic nucleus (panel A). Alternatively, the cells were lysed and Western blot analysis to assess 4E-BP1 expression was performed (panel B). The bar graphs in panel B represent total 4E-BP1 expression levels. The results of both panels correspond to the mean ± sem of three independent experiments. The threshold of significance was at P = 0.0167 (three comparisons). C, Cells were treated as in panel B but in the presence or in the absence of 100 ng/ml of rapamycin for 18 h. D, The functionality of rapamycin was checked by blotting for 4E-BP1 and phospho-S6K (panel D). The results of panel D correspond to the mean ± sem of four independent experiments. The threshold of significance was at P = 0.01 (five comparisons). CM, Complete medium; NS, nonsignificant; WB, Western blot. *, Statistically significant as defined in Materials and Methods; α, hypophosphorylated form; β, intermediate phosphorylated form; γ, hyperphosphorylated form.
Serum withdrawal has been reported to induce ER stress in some situations but not in others (27, 28, 29, 30). If depleting MIN6 cells from serum induces ER stress, one would predict that serum withdrawal leads to the same type of 4E-BP1 regulation as generated by the ER stressors TG and TM. The results presented above indicate, however, that up-regulation of 4E-BP1 levels can be blocked by HDLs when this up-regulation is induced by serum starvation but not when it is stimulated by TM and TG. This suggests that serum withdrawal and ER stressors do not induce similar responses, and, in particular, that serum starvation does not lead to ER stress. To assess this point, MIN6 cells were serum-depleted or treated with TG or TM, and up-regulation of the ER stress markers binding immunoglobulin protein (BiP) and ATF4 was measured. Figure 7 shows that, as expected, TG and TM significantly induced the expression of both ER stress markers. However, serum withdrawal did not affect BiP expression at all. Serum removal seemed to marginally increase ATF4 expression, but this did not reach statistical significance. Figures 5A and 6A show that 48 h of serum deprivation and 24 h of incubation with TM induce a similar apoptotic response, yet Fig. 7 indicates that, over these time periods, this does not translate into comparable activations of the ER stress pathway. Altogether, these results suggest that serum withdrawal and ER stressors activate different intracellular pathways leading to apoptosis.
Fig. 7.

ER stress markers are not up-regulated upon serum deprivation in MIN6 cells. MIN6 cells were stimulated with 0.5 μm TG, 2 μg/ml TM, or were serum deprived for the indicated periods of time. The cells were then lysed and the lysates were subjected to Western blot analysis using an antibody specific for the ER stress marker BiP. Alternatively, the RNA was isolated from the cell extracts, reverse transcribed into cDNA, and amplified by real-time PCR using primers specific for the ER stress marker ATF4. The graph represents the quantitation of the Western blot signals or the real-time PCR data, normalized to the values at time 0 h. The results correspond to the mean ± sem of the indicated number of independent experiments (when not indicated, the number of independent experiments corresponds to five). The threshold of significance was at P = 0.005 (10 comparisons). For the BiP quantitation, the P values <0.05 are indicated. *, Statistically significant as defined in Material and Methods.
Modulation of 4E-BP1 and protein synthesis
To determine whether modulation of 4E-BP1 induced by the different stimuli used in this study could affect global mRNA translation, a 35S-labeled amino acid incorporation assay was performed on MIN6 cells. Figure 8 shows that none of the stimuli used in this study induced a sustained repression in global mRNA translation (although cycloheximide, a protein synthesis inhibitor used here as a control, did). Serum withdrawal, on the contrary, tended to marginally stimulate protein synthesis. As seen in other cell types (31, 32), global amino acid incorporation over a 24-h period in the MIN6 insulinoma cells was not affected by IL-1β. ER stressors (TG and TM) induced a transient repression in global protein synthesis after 3 h, as reported elsewhere (26), but the translation rate was back to normal 5 h later. These results suggest that modulation of 4E-BP1 by the various stimuli used here does not markedly affect global protein synthesis. The lack of a major effect of 4E-BP1 on global mRNA translation is consistent with a recent study reporting no overall inhibition of protein synthesis after efficient 4E-BP1 silencing (33). 4E-BP1 modulation might, however, regulate the translation of a selected set of proteins, including some that could be involved in cell survival and death. Additional work will be required to identify the proteins, the mRNAs of which are targeted by 4E-BP1, that are playing a role in HDL-mediated protection of insulin-secreting cells.
Fig. 8.

Amino acid incorporation upon treatments that modulate 4E-BP1. MIN6 cells were serum starved or treated with 0.5 μm thapsigargin, 2 μg/ml tunicamycin, 10 ng/ml IL-1β, or 20 ng/ml cycloheximide for the indicated periods of time. The cells were then pulsed with [35S]methionine/cysteine for 15 min, and the incorporation of the radioactive amino acid into proteins was determined as described in Materials and Methods. The results shown are normalized to the values obtained at t = 0. The graph represents the mean ± sem of three independent experiments. Differences with the values at t = 0 were assessed using a t test. The P values that are <0.05 are indicated, and asterisks indicate significance after Bonferonni correction. The threshold of significance was at P = 0.0125 (four comparisons) and P = 0.025 (two comparisons) for the first four graphs and the last graph, respectively. NS, Nonsignificant.
Effect of HDLs on IL-1β-induced nuclear factor-κB (NF-κB)
HDLs have been shown to inhibit NF-κB activation in certain cell types (34, 35, 36, 37). To investigate the effect of HDLs on NF-κB in insulin-secreting cells, MIN6 cells were transfected with a NF-κB reporter construct and stimulated with IL-1β. Figure 9A shows that IL-1β-induced NF-κB stimulation was not altered by HDLs. In addition, the IL-1β-mediated increase of the mRNA levels of the NF-κB-target genes inducible nitric oxide synthase (iNOS) and cyclooxygenase 2 (COX-2) were not affected by HDLs (Fig. 9, B and C). These results suggest that HDLs do not inhibit NF-κB in β-cells.
Fig. 9.
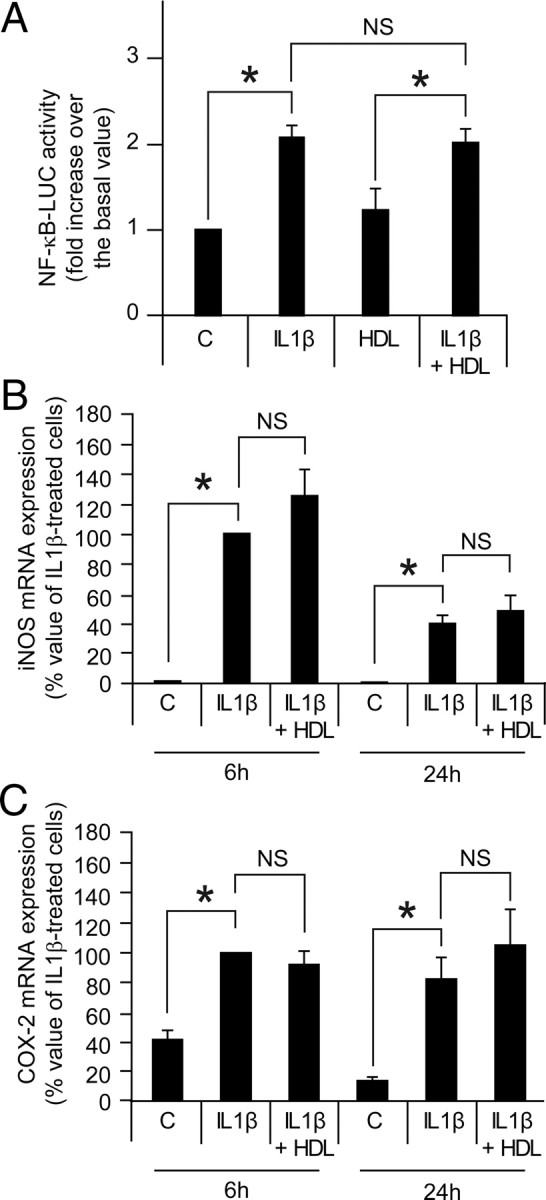
Effects of HDLs on IL-1β-induced NF-κB activation and IL-1β-mediated iNOS and COX-2 mRNA expression. Panel A, MIN6 cells were transfected with a NF-κB-driven firefly luciferase reporter and a Renilla luciferase-encoding construct. The following day, the cells were incubated 18 h with and without 10 ng/ml IL-1β in the absence or in the presence of 1 mm HDLs. NF-κB activity was then measured as described in Materials and Methods. The results correspond to the mean ± sem of five independent experiments. The threshold of significance was at P = 0.0167 (three comparisons). Panels B and C, MIN6 cells were treated or not with 10 ng/ml IL-1β for 6 or 24 h in the absence or in the presence of 1 mm HDLs. RNA was then extracted and reverse transcribed, and real-time PCR was performed to measure iNOS (panel B) and COX-2 (panel C) mRNA expression. The results are normalized to a control gene (RPLP0) and expressed as the percentage of the response obtained with a 6-h stimulation with IL-1β (mean ± sem of three and five independent experiments for the 6-h and 24-h time points, respectively). The threshold of significance was at 0.0125 (four comparisons). NS, Nonsignificant; C, control untreated cells.
Discussion
The beneficial properties of HDLs have been extensively studied in endothelial cells (38, 39, 40). Less is known on their protective functions in other cell types, including pancreatic β-cells (7). In this study, we aimed to identify genes that would be modulated by HDLs in stressed β-cells. The chosen stress stimulus was serum deprivation because this represents a profound perturbation of the cell homeostasis and because trophic factor removal appears to be a main determinant in cell death during islet isolation (11) and could mimic the atherosclerotic lesions observed in the pancreas in old and/or diabetic patients (12). The exposure time to this stress was kept short to detect early gene expression variations. The gene encoding 4E-BP1 was among the few genes the expression of which by serum deprivation was modulated by HDLs. Protein expression levels of 4E-BP1 were found to be up-regulated by apoptotic stimuli such as serum deprivation and IL-1β. Moreover, ectopic expression of 4E-BP1 resulted in β-cell death, and blocking the up-regulation of 4E-BP1 with short hairpin RNAs (shRNAs) reduced the apoptotic response in starved β-cells. HDLs were found to inhibit both the induction of 4E-BP1 and apoptosis in insulin-producing cells subjected to serum deprivation and inflammatory cytokines. These results indicate that 4E-BP1 up-regulation favors β-cell death and that one mechanism allowing HDLs to protect these cells relies on the inhibition of 4E-BP1-increased expression. On the other hand, HDLs were not found to modulate 4E-BP1 expression in response to the ER stressors TM and TG despite being able to efficiently protect β-cells from these compounds. This indicates that reduction in 4E-BP1 levels is not the sole mechanism used by HDLs to protect cells and that the protective pathways induced by HDLs are stress stimulus specific. Nevertheless, in response to specific forms of stresses (serum deprivation, inflammatory cytokines), blocking the increase in 4E-BP1 levels appears to be a mechanism mediating HDL-induced protection.
It has been reported that an up-regulation of the ATF4 transcription factor is required for ER stress-induced 4E-BP1 expression (26). Our results indicate that serum withdrawal, despite inducing 4E-BP1 expression, does not lead to an increase in ATF4 expression. It is therefore unlikely that ATF4 mediates 4E-BP1 up-regulation in serum-starved cells. This is also evidence that serum withdrawal and ER stress regulate 4E-BP1 via distinct mechanisms. Serum contains factors that activate the ERK MAPK pathway. It has been shown that this pathway activates the Egr-1 transcription factor that can repress 4E-BP1 promoter activity (41). It is tempting to speculate that serum withdrawal will lead to a reduction in the tonic stimulation of the ERK MAPK pathway in cells, inducing, in turn, a down-regulation of Egr-1, a relief of the brake on the 4E-BP1 promoter, and an ensuing up-regulation of 4E-BP1 protein levels.
4E-BP1 regulates translation by its ability, in its hypophosphorylated state, to interact with the eukaryotic initiation factor (eiF) 4E (42). This interaction blocks the binding of eiF4E to eiF4G. The interaction of eiF4E and eiF4G is required for the formation of the eiF4F complex that promotes the translation of capped mRNAs. Binding of 4E-BP1 to eIF4E therefore prevents translation of those mRNAs (42) but cap-independent translation [i.e. internal ribosome entry site (IRES)-mediated] still occurs (43). When hyperphosphorylated, 4E-BP1 loses its ability to repress translation (23). HDLs were found to minimally modulate the phosphorylation of 4E-BP1 in response to serum deprivation and IL-1β. In contrast, in response to ER stresses, HDLs increased the proportion of the hyperphosphorylated form of 4E-BP1 to a significantly higher level than in response to other stresses. However, this increase in 4E-BP1 phosphorylation did not appear to be required for HDLs to prevent ER stress-induced β-cell apoptosis because this protective response was unaltered in the presence of rapamycin, an mTOR inhibitor that induced efficient 4E-BP1 dephosphorylation.
Global protein synthesis was not markedly affected by serum deprivation or IL-1β stimulation. TG and TM treatment induced only a transient reduction of mRNA translation at early time points (e.g. 3 h). As reported, this decrease is independent of 4E-BP1 because it occurs in MIN6 devoid of 4E-BP1 (26). Therefore, the modulation of 4E-BP1 levels induced by the various stresses used in our study appears not to modulate global mRNA translation. In fact, it has been reported that global translation changes in response to specific stimuli can be relatively small, e.g. after hormone treatment, whereas dramatic changes are observed for several specific mRNAs (44). The way by which 4E-BP1 induction promotes apoptosis probably results from rather subtle change in the balance between pro- and antiapoptotic protein levels (43).
When cap-dependent translation is inhibited, alternative mechanisms of translation initiation are used (45). Features as IRES in the 5′-untranslated region are important for alternate translational control (46). IRES elements can be activated by stresses, notably as a consequence of changes in the expression and subcellular localization of specific IRES trans-activating factors (47). Regardless of the mechanisms, both anti- and proapoptotic proteins can be translated in a cap-independent manner (43, 46). Moreover, depending on the type of apoptotic stimuli, cap-independent translation will be affected and a different set of mRNAs will be translated preferentially (45). For example, the antiapoptotic XIAP protein, the mRNA of which contains an IRES in its 5′-untranslated region, is translated in response to γ-irradiation but not after etoposide treatment (43). Additionally, studies performed in fibroblasts have revealed that intermediate 4E-BP1-mediated repression of cap-dependent translation results in apoptosis whereas maximal repression of translation repressed the cell death response (48, 49). Some IRESs that act during apoptosis have been identified in MCF7 cells upon TNF-related apoptosis inducing ligand (TRAIL) treatment such as in cyclin T1, SET7, ZnF217, CYP1B1, MTG8A, Notch 2, HeS1, and c-myc. However, intriguingly other IRES were found to be inhibited (nucleophosmin and presenilin) (47). In addition, HeLa cells in which 4E-BP1 was silenced had an unaltered global translation rate. Only a few proteins were more expressed in these cells compared with control HeLa cells (33), including S100 calcium-binding protein A4 and transgelin 2, which are involved in tumor progression and invasion (33). Consequently, it is difficult to predict which pro- or antiapoptotic proteins are regulated by 4E-BP1.
In agreement with our data, it has been shown that in genetic models of diabetic mice (Ins2WT/C96Y, Wfs−/− and Lep−/− mice) leading to a chronic ER stress in β-cells, 4E-BP1 levels are increased (26). Based mainly on indirect and nonspecific measurement of apoptosis (i.e. using assays monitoring the integrity of mitochondria function), it has been suggested that β-cells lacking 4E-BP1 die more readily than control cells when treated with ER stress inducers. Lack of 4E-BP1 appears therefore to be detrimental for β-cells. Our results indicate that increased expression of 4E-BP1 is deleterious depending on the stress stimuli. These data suggest that adequate levels of 4E-BP1 are required to keep the balance between pro- and antiapoptotic protein translation rates to avoid cell death.
One of the molecules known to induce β-cell death is NF-κB, a transcription factor regulating many genes including iNOS and COX-2. For example, IL-1β-induced iNOS expression and apoptosis in pancreatic β-cells can be prevented by a NF-κB superrepressor (50). Because HDLs are able to efficiently protect β-cell, it could have been expected that HDLs inhibit NF-κB activation and expression of NF-κB-dependent genes. However, this did not appear to be the case because HDLs neither inhibited the activation of a NF-κB-dependent promoter, nor did they prevent iNOS and COX-2 mRNA expression. HDLs appear therefore to be able to protect β-cells despite the activation of inflammatory genes. The reason why HDLs block NF-κB in some cell types could be due to cell type-specific protein expression. For example, in endothelial cells, HDLs indirectly inhibit sphingosine-1-phosphate- and TNF-induced NF-κB activation by stimulating, through increased phosphorylation of endothelial nitric oxide synthase, NO production that blocks NF-κB activity (37). The absence of endothelial nitric oxide synthase expression in β-cells could be one reason why this cell type does not inhibit NF-κB in response to HDL stimulation.
In conclusion, the current data indicate that changes in 4E-BP1 levels in β-cells modulate their survival ability. The molecular mechanisms controlling 4E-BP1 levels in β-cells, and which mRNAs are regulated, in response to HDLs in particular, will need to be characterized as they represent, together with 4E-BP1, potential therapeutic targets for the treatment of diabetes.
Materials and Methods
Western blot analysis and immunocytochemistry
Insulinoma cells were lysed in monoQ-c [70 mm β-glycerophosphate, 0.5% Triton X-100, 2 mm MgCl2, 1 mm EGTA, 100 μm Na3VO4, 1 mm dithiothreitol, 20 μg/ml aprotinin, complete EDTA-free Protease Inhibitor Cocktail Tablets (one tablet per 50 ml; Roche Applied Science, Indianapolis, IN; catalog no. 1873580)]. The volume of lysis was 100 μl when the cells were cultured in six-well plates.
Human islets were lysed as follows: the cultured islets were collected in 1 ml PBS, spun in an Eppendorf centrifuge for 5 min at 2000 rpm at 4 C. The pellet was then resuspended in 100 μl of ice-cold human lysis buffer [20 mm Tris (pH 7.5), 150 mm NaCl, 1% Triton X-100, 10% glycerol, complete EDTA-free Protease Inhibitor Cocktail Tablets (one tablet per 50 ml; Roche catalog no. 1873580), 1 mm Na3VO4, 1 mm NaF, 1 mm phenylmethylsulfonylfluoride, and 1 mm EDTA] and incubated 15 min on ice. The lysate was spun in an Eppendorf centrifuge for 10 min at full speed at 4 C, and the cleared lysate was then recovered.
Proteins were separated on SDS-PAGE and blotted onto nitrocellulose membranes (Bio-Rad catalog no. 1620115; Bio-Rad Laboratories, Hercules, CA). Thereafter, membranes were incubated with a casein-blocking solution [40 mm NaCl, 2.7 mm Na2HPO4, 0.6 mm KH2PO4, 1% casein (sodium salt; Sigma catalog no. C8654; Sigma Chemical Co., St Louis, MO), 0.02% NaAzide (pH 7.5)] for 1 h at room temperature and then incubated overnight in the same solution with the appropriate primary antibody. Primary antibodies were detected with Alexa Fluor 680-conjugated secondary antibodies (Molecular Probes, Inc., Eugene, OR; catalog no. A21109) or IR-Dye800-conjugated affinity purified antimouse IgG (Rockland Immunochemicals, Philadelphia, PA; catalog no. 610-132-121) diluted 1:5000 in TBS (18 mm HCl, 130 mm NaCl, 20 mm Tris), 5% casein. The primary antibody against 4E-BP1 (Cell Signaling Technologies, Beverly, MA; catalog no. 9452) was diluted 1:500 (vol/vol) in casein solution containing 0.1% Tween 20 (Acros Organics, Geel, Belgium; catalog no. 233362500). The primary antibody against actin (Cell Signaling Technologies; catalog no. 4968) was diluted 1:5000 (vol/vol) in TBS containing 5% milk. The primary antibody against BiP (Santa Cruz Biotechnology, Inc., Santa Cruz, CA; catalog no. sc-13968) was diluted 1:500 in TBS-Tween containing 5% BSA. Membranes were washed after each incubation in TBS containing 0.1% Tween (vol/vol). Visualization and quantitations were performed using the Odyssey infrared imaging device and software (Licor, Homburg, Germany).
Chemicals
IL-1β, thapsigargin (TG), tunicamycin (TM), and rapamycin, were from Sigma (catalog nos. I5271, T9033, T7765, and R0395, respectively). TG and TM stocks were prepared in dimethylsulfoxide. The final dimethylsulfoxide concentrations in experiments using TG and TM were 0.05% and 0.01%, respectively.
Lentivirus
Human embryonic kidney (HEK)293T cells were cotransfected using the calcium phosphate DNA precipitation method (51) with 10 μg of the lentiviral vector containing the shRNA or the cDNA of interest, 2.5 μg of the envelope protein-coding plasmid (pMD.G), and 7.5 μg of the packaging construct (pCMVDR8.91). The virus-containing medium was harvested 2 d after the transfection. Infection of the cells was performed as follows. Cells were seeded in six-well plates at a density of 0.3 million cells per well. Hexadimethrine bromide (Polybrene; Sigma catalog no. 52495) was added 2 d later to a final concentration of 5 μg/ml, followed by the addition of the lentiviruses. The plates were then centrifuged 45 min at 800 × g at room temperature and placed 24 h at 37 C in a 5% CO2 humidified atmosphere. The medium was then replaced with fresh medium, and the cells were further cultured for an additional 72-h period at which time they were split 1:2.5 in new six-well plates. The cells were subjected 24 h later to the conditions indicated in the figures.
Cells and cell culture
The mouse insulinoma MIN6 cell line was maintained in DMEM (Life Technologies, Inc., Gaithersburg, MD; catalog no. 61965) supplemented with 15% fetal calf serum (FCS; Life Technologies), 1% sodium pyruvate (Sigma; catalog no. S86636), 83 μm β-mercaptoethanol (Life Technologies; catalog no. 31350-010). The mouse βTC3 insulinoma cell line was grown in RPMI (Life Technologies; catalog no. 61870) supplemented with 10% FCS and sodium pyruvate (1 mm). HEK293T cells were grown in DMEM supplemented with 10% FCS.
Human islets were isolated from pancreata of organ donors. Human islets were cultured in CMRL-1066 medium containing 5 mm glucose, 100 U/ml penicillin, 100 mg/ml streptomycin, and 10% FCS (Invitrogen, Basel, Switzerland). Islets (∼300 islets per plate) were cultured on extracellular matrix (ECM)-coated 35-mm plates (Novamed, Jerusalem, Israel; the ECM being derived from bovine corneal endothelial cells). The islets cultured on ECM were left in islet media for 2–3 d to adhere and spread before initiation of the experiments.
Plasmids
Plasmid m4E-BP1.sport6 (purchased from RZPD, Deutsches Ressourcenzentrum für Genomforschung), encodes the full-length mouse 4E-BP1 cDNA sequence (NCBI entry BC002045). Plasmid m4EBP1-29.spr encodes a shRNA specific for mouse 4E-BP1. It was constructed by annealing a forward oligonucleotide (GATCCCC AAATTTCTGATGGAGTGTCGGAACTCACC TTCAAGAGA GGTGAGTTCCGACACTCCATCAGAAATTT TTTTTGGAAA) with a reverse oligonucleotide (AGCTTTTCCAAAAA AAATTTCTGATGGAGTGTCG-GAACTCACC TCTCTTGAA GGTGAGTTCCGACACTCCATCAGAAATTT GGG) and by subcloning them into the pSUPER plasmid (52) opened with BglII and HindIII enzymes. The 4E-BP1-complementary sequences are indicated in bold. Plasmid m4E-BP1-si29-pll3.7.lti encodes the shRNA-encoding sequence described above in a lentiviral expression vector. It was constructed by subcloning the XhoI/BamHI 356-bp fragment of plasmid m4E-BP1.spr into pLentiLox3.7 (53). The latter vector was purchased form Addgene (plasmid 11795; http://www.addgene.org).
Transfection
MIN6 cells were transfected using Lipofectamine 2000 (Invitrogen, Carlsbad, CA; catalog no. 11668-027) following the manufacturer’s protocol. The cells (500,000 per well) were plated in six-well plates, and the following day transfected with 1 μg of the plasmid of interest together with 0.5 μg of a green fluorescent protein (GFP)-encoding plasmid.
Lipoprotein preparation and purification
Plasma lipoprotein fractions from human healthy donor serum were isolated with the use of NaBr by sequential ultracentrifugation, as described previously (54, 55). Very low-density lipoprotein + intermediate density lipoprotein (density 1.019) are first isolated, followed by low-density lipoprotein (density 1.063), and finally HDL (density 1.21). The fractions are dialyzed for 48 h against PBS, 100 μm EDTA and stored at 4 C. Before use, HDLs were dialyzed for 24 h against PBS and 24 h against culture medium (DMEM). They were then used within a 14-d period. The medium used for dialysis (labeled “vehicle” in the figures) and HDLs were filtered through 0.22-μm filters (Millipore Corp, Bedfrod, MA; Millex-GV SLGV033RS), and the cholesterol concentration was measured by an enzymatic in vitro test kit from Roche Applied Science (catalog no. 2016630). The quality of the preparations is checked on sodium dodecyl sulfate gels stained with Coomassie by comparing the intensities of the ApoA-I and ApoB100 bands. The ApoB100/ApoA-I ratio in our HDL preparations was less than 1%. Experiments using HDLs were done with preparations from different donors or with mixed preparations.
Apoptosis determination
Apoptosis was determined by scoring the number of cells, fixed in PBS, 2% paraformaldehyde, and stained with Hoechst 33342, that display pycnotic nuclei (56). In experiments involving transfected cells, pEGFP-C1 was included in the transfection solution to label the transfected cells with a green fluorescent marker. In this case, the extent of apoptosis was assessed in the transfected cells only.
Immunocytochemistry
Cells on coverslips were washed in PBS and fixed with PBS, 2% paraformaldehyde containing 2.5 mg/ml Hoechst 33342 (Invitrogen; catalog no. H21492) for 15 min. After an additional washing with PBS, the cells were permeabilized with 0.2% (vol/vol) Triton X-100 (Fluka Chemical Co., Buchs, Switzerland; catalog no. 93426) in PBS for 15 min. The cells were then washed in DMEM containing 10% FCS and incubated 1 h with the primary antibody against the V5 tag (Bethyl Laboratories, Montgomery, TX; catalog no. A190–120A; the V5 epitope tag, GKPIPNPLLGLDST, is derived from proteins of the simian virus 5 paramyxovirus) used at a 1:200 dilution in DMEM, 10% FCS. After a washing step in PBS, the cells were incubated with a 1:500 dilution in the same medium containing the secondary antibody (fluorescein isothiocyanate-conjugated donkey antirabbit IgG (Jackson ImmunoResearch Laboratories, Inc., West Grove, PA; catalog no. 711–095-152). Finally, six washes over a 16-h period were performed in PBS before the coverslips were mounted in mounting medium for fluorescence (Vectashield; Vector Laboratories, Burlingame, CA). Images were acquired using a Zeiss AxioVis C1 microscope (Carl Zeiss, Thornwood, NY).
Statistics
All the statistical analyses (except those applied on the microarray data; see below) were performed with Microsoft Excel using the two-tailed paired Student’s t test. Significance is indicated by an asterisk when P < 0.05/n, where P is the probability derived from the t test analysis and n is the number of comparisons performed (Bonferonni correction).
Microarrays
Cells were washed, lysed using RLT buffer (QIAGEN; catalog no. 79216) and scraped off the dishes using a rubber policeman. Lysates were then added to a QIAshredder column (Qiagen kit for the isolation of total RNA from animal cells; catalog no. 74104) and spun at maximum speed in an Eppendorf centrifuge for 2 min at room temperature. The lysate was then frozen at −80 C. The QIAshredder unit is used to homogenize lysates and to reduce viscosity caused by high molecular weight cellular components and cell debris. RNA was then isolated and purified using the RNeasy column (QIAGEN; catalog no. 74104). Total RNA was checked for quality on an RNA Nano labChip using the Bioanalyzer system (Agilent Technologies, Palo Alto, CA).
Total RNA material (1 μg) was amplified and labeled with biotin according to Affymetrix protocols using the Enzo kit (Affymetrix, Santa Clara, CA; catalog no. 900182) for in vitro transcription. Fragmented cRNA was then hybridized to Affymetrix MOE430_2 chips according to standard procedures. Samples were randomized in the labeling and hybridizing process. Hybridized chips were washed and then scanned on an Affymetrix GeneChip 3000 scanner according to the Affymetrix expression analysis technical manual. Gene expression signals were extracted from the scanned microarrays by the MAS 5.0 software provided by Affymetrix. The microarray datasets were deposited in the GEO public gene expression archive [http://www.ncbi.nlm.nih.gov/projects/geo;accession no. GSE17647 (NCBI tracking system 15683040)].
Microarray analyses
As a first step, an ANOVA (with the null hypothesis being “all the groups are identical” and the alternative hypothesis being “at least one group is different from the other”) was performed to extract signal from noise. Genes with an adjusted (by false discovery rate) P value <0.05 were selected (11351 probesets). Second, genes the mean across all hybridizations of which was more than 50 (∼5.6 in log2) were selected (10714 probesets). The list of these genes is found in supplemental Table 1 published as supplemental data on The Endocrine Society’s Journals Online web site at http://mend.endojournals.org. A linear model, M = μ + α.x1 + β.x2 + α.β.x1.x2 + ε [where M corresponds to the expression level of any gene, μ represents the basal effect (vehicle), β the HDL effect, α the serum deprivation effect, α. β the interaction effect between the HDLs and serum deprivation conditions, and ε the error], was then used to estimate the different parameters of the model (using the Limma software package; http://bioinf.wehi.edu.au/limma) (57). Using an adjusted (by false discovery rate) P value threshold of 0.05, three lists of significantly regulated genes were generated: 1) genes regulated by HDLs (supplemental Table 2); 2) genes regulated by serum deprivation (supplemental Table 3); and 3) genes regulated by HDLs during serum deprivation (“interaction of both”) (supplemental Table 4).
[35S]Methionine/cysteine incorporation
MIN6 cells were plated in six-well plates at a 0.5 million per well density and cultured for 2 d. After the indicated treatments, the cells were washed three times with 2 ml PBS and incubated 30 min in 1 ml of DMEM lacking l-methionine and l-cysteine (Life Technologies catalog no. 21013) supplemented with 15% FCS previously dialyzed four times against PBS (each time with a volume of serum-volume of PBS ratio of 0.0024). [35S]Methionine/cysteine (15 μCi) [Hartmann-analytic (Braunschweig, Germany) catalog no. IS-103] per well was then added for 15 min at 37 C. The cells were washed once more with PBS and lysed in 100 μl monoQ-c lysis buffer. Protein (20 μg) was loaded and run on a 12% sodium dodecyl sulfate gel. The gel was stained with Coomassie blue [3 mm Brilliant Blue G (Acros Organics catalog no. 191480250), 45.5% methanol, 0.9% glacial acetic acid], washed in a 30% methanol-10% glacial acid acetic solution until the background was removed, incubated in water three times for 5 min and dried, and a picture of the gel was taken. Finally, the dried gel was exposed to a phosphor screen (Bio-Rad) for 1.5 h. Measurement of 35S incorporation and total protein amount was performed on the phosphor imager picture and the Coomassie image, respectively, using the ImageJ software (Rasband, W. S., ImageJ, National Institutes of Health, Bethesda, MD; http://rsb.info.nih.gov/ij/, 1997–2008). The 35S intensity of a whole lane in the gel was normalized against the corresponding Coomassie staining.
RNA extraction
In the experiment shown in Fig. 7, RNA was extracted by lysing cells with 500 μl TRI buffer (1.7 m guanidium thiocyanate, 0.1 m sodium citrate, 0.25% N-lauryl-sarcosyl sodium, 0.05 m β-mercaptoethanol, 0.1 m sodium acetate), followed by the addition of 200 μl chloroform. The tubes were then vortexed, kept at room temperature for 5 min, and spun at maximal speed in an Eppendorf centrifuge for 15 min. After the transfer of the aqueous phase in a new tube, 500 μl isopropanol was added and the solution was mixed by inversion approximately five times. The samples were then incubated o/n at −20 C. After spinning 20 min at maximum speed in an Eppendorf centrifuge, the upper phase (isopropanol) was aspirated; the pellet was washed twice with 800 μl 70% ethanol and dried 5–10 min at 50 C. The pellet was finally resuspended in 50 μl of water and RNA was quantitated at 260 nm.
In the experiments shown in Figs. 3A and 9, RNA was extracted using the RNeasy Plus Mini kit (QIAGEN catalog no. 74134).
Reverse transcription
For the reverse transcription used in Fig. 7, 0.5 μg of RNA was mixed with 500 ng of random hexamers (Microsynth, Balgach, Switzerland), and water was added to reach a final volume of 11 μl. The samples were incubated 3 min at 70 C and then kept on ice. A mix (14 μl) containing 5 μl of 10 nm dinucleotide triphosphates (Promega catalog no. U120D-123D), 0.5 μl of RNasin (Promega catalog no. N211A), 5 μl of buffer 5×, 2 μl dithiothreitol, 0.5 μl Superscript reverse transcriptase, and 1 μl water (the buffer 5×, the dithiothreitol and the transcriptase coming from the Superscript II reverse Transcriptase Kit; Invitrogen catalog no. 18064–014) was added to the RNA-hexamer mix. After incubation at 39 C for 1 h followed by 15 min at 70 C, the cDNA was diluted 1:3 in water.
In the experiments shown in Figs. 3A and 9, reverse transcription was performed on 500 ng of RNA using the Transcriptor High Fidelity kit (Roche). At the end of the procedure, the cDNA (10 μl) was diluted 1:3 in water.
Quantitative PCR
Quantitative PCR assays were carried out on a real-time PCR detection system (iQ5; Bio-Rad) using iQ SYBR Green Supermix (Bio-Rad catalog no. 170-8862), with 500 nmol/liter primers, 1 μl of template per 20 μl of PCR, and an annealing temperature of 59 C for ATF4 and RPLP0 and 60 C for iNOS, COX-2, and 4E-BP1. Melting curve analyses were performed on all PCRs to rule out nonspecific amplification. Reactions were carried out in triplicate.
Primers
The primers used in real-time PCR are indicated below:
4E-BP1: sense, 5′-GGG GAC TAC AGC ACC ACTC-3′; antisense, 5′-CTC ATC GCT GGT AGG GCTA-3′; iNOS: sense, 5′-CAC CTT GGA GTT CAC CCA CT-3′; antisense, 5′-ACC ACT CGT ACT TGG GAT GC-3′; COX-2: sense, 5′-TTC AAA AGA AGT GCT GGA AAA GGT-3′; antisense, 5′-GAT CAT CTC TAC CTG AGT GTC TTT-3′; RPLP0: sense, 5′-ACC TCC TTC TTC CAG GCT TT-3′; antisense, 5′-AAA GAC TGG AGA CAA GGT GG-3′; ATF4: sense:5′-ATC CAG CAA AGC CCC ACA AC-3′; antisense, 5′-CAA GCC ATC ATC CAT AGC CG-3′.
NF-κB reporter assay
MIN6 cells were transfected with 0.5 μg of the prLUC NF-κB reporter plasmid (58) and 0.5 μg of pRL-TK encoding the Renilla luciferase (Promega) used as an internal control. Luciferase assay was performed using the Dual-Luciferase Reporter Assay from Promega (catalog no. E1910) as per the manufacturer’s protocol. Light emission was measured using an automatized bioluminometer (Promega Glomax 96 microplate luminometer). The activity of the NF-κB reporter plasmid was normalized to the activity of the internal control.
Acknowledgments
We thank Allen Roses (Duke University Medical Center, Durham, NC) and Scott Sundseth (GlaxoSmithKline R & D Drug Discovery, Research Triangle Park, NC) for their support in the initiation of this project, and Warren Strittmatter (Duke University Medical Center, Durham, NC) and Marc Donath (Zürich University Hospital, Zürich, Switzerland) for helpful discussions and support. We thank Yingnian Shen and Douglas Corwin (GlaxoSmithKline R & D Drug Discovery, Research Triangle Park, NC) for their expert technical assistance with preparation of the RNA samples and hybridization to the Affymetrix microarrays, respectively. We also thank Dimitri Favre (Lausanne University, Lausanne, Switzerland) for primers, protocols, and advices about ER stress markers.
Footnotes
This work was supported by grants from the Swiss National Science Foundation.
Disclosure Summary: K.A., S.G., and V.M. are or were full-time employees of GlaxoSmithKline at the time the data presented in this work were collected. The other authors declare no duality of interest associated with this manuscript.
First Published Online July 2, 2009
C.W. and G.W. share senior authorship.
Abbreviations: ATF4, Activating transcription factor 4; BiP, binding immunoglobulin protein; COX-2, cyclooxygenase 2; ECM, extracellular matrix; 4E-BP, 4E-binding protein; eiF, eukaryotic translation initiation factor; ER, endoplasmic reticulum; FCS, fetal calf serum; GFP, green fluorescent protein; HDL, high-density lipoprotein; HEK, human embryonic kidney; iNOS, inducible nitric oxide synthase; IRES, internal ribosome entry site; mTOR, mammalian target of rapamycin; NF-κB, nuclear factor-κB; siRNA, small interfering RNA; SREBP, sterol-regulatory element-binding protein; TG, thapsigargin; TM, tunicamycin.
References
- 1.Stumvoll M, Goldstein BJ, van Haeften TW2005. Type 2 diabetes: principles of pathogenesis and therapy. Lancet 365:1333–1346 [DOI] [PubMed] [Google Scholar]
- 2.Permutt MA, Wasson J, Cox N2005. Genetic epidemiology of diabetes. J Clin Invest 115:1431–1439 [DOI] [PMC free article] [PubMed] [Google Scholar]
- 3.Frayling TM2007. Genome-wide association studies provide new insights into type 2 diabetes aetiology. Nat Rev Genet 8:657–662 [DOI] [PubMed] [Google Scholar]
- 4.Zeggini E, Weedon MN, Lindgren CM, Frayling TM, Elliott KS, Lango H, Timpson NJ, Perry JR, Rayner NW, Freathy RM, Barrett JC, Shields B, Morris AP, Ellard S, Groves CJ, Harries LW, Marchini JL, Owen KR, Knight B, Cardon LR, Walker M, Hitman GA, Morris AD, Doney AS, McCarthy MI, et al.2007. Replication of genome-wide association signals in UK samples reveals risk loci for type 2 diabetes. Science 316:1336–1341 [DOI] [PMC free article] [PubMed] [Google Scholar]
- 5.Shepherd J2007. Dyslipidaemia in diabetic patients: time for a rethink. Diabetes Obes Metab 9:609–616 [DOI] [PubMed] [Google Scholar]
- 6.Tenenbaum A, Motro M, Fisman EZ, Schwammenthal E, Adler Y, Goldenberg I, Leor J, Boyko V, Mandelzweig L, Behar S2004. Peroxisome proliferator-activated receptor ligand bezafibrate for prevention of type 2 diabetes mellitus in patients with coronary artery disease. Circulation 109:2197–2202 [DOI] [PubMed] [Google Scholar]
- 7.Pétremand J, Abderrahmani A, Widmann C2008. Genetics and molecular biology: HDLs and their multiple ways to protect cells. Curr Opin Lipidol 19:95–97 [DOI] [PubMed] [Google Scholar]
- 8.Roehrich ME, Mooser V, Lenain V, Herz J, Nimpf J, Azhar S, Bideau M, Capponi A, Nicod P, Haefliger JA, Waeber G2003. Insulin-secreting β-cell dysfunction induced by human lipoproteins. J Biol Chem 278:18368–18375 [DOI] [PubMed] [Google Scholar]
- 9.Abderrahmani A, Niederhauser G, Favre D, Abdelli S, Ferdaoussi M, Yang JY, Regazzi R, Widmann C, Waeber G2007. Human high-density lipoprotein particles prevent activation of the JNK pathway induced by human oxidised low-density lipoprotein particles in pancreatic β cells. Diabetologia 50:1304–1314 [DOI] [PubMed] [Google Scholar]
- 10.Drew BG, Duffy SJ, Formosa MF, Natoli AK, Henstridge DC, Penfold SA, Thomas WG, Mukhamedova N, de Courten B, Forbes JM, Yap FY, Kaye DM, van Hall G, Febbraio MA, Kemp BE, Sviridov D, Steinberg GR, Kingwell BA2009. High-density lipoprotein modulates glucose metabolism in patients with type 2 diabetes mellitus. Circulation 119:2103–2111 [DOI] [PubMed] [Google Scholar]
- 11.Ilieva A, Yuan S, Wang RN, Agapitos D, Hill DJ, Rosenberg L1999. Pancreatic islet cell survival following islet isolation: the role of cellular interactions in the pancreas. J Endocrinol 161:357–364 [DOI] [PubMed] [Google Scholar]
- 12.Rosso D, Carnazzo G, Giarelli L, Motta L, Maugeri D2001. Atherosclerosis and pancreatic damage. Arch Gerontol Geriatr 32:95–100 [DOI] [PubMed] [Google Scholar]
- 13.Rader DJ2006. Molecular regulation of HDL metabolism and function: implications for novel therapies. J Clin Invest 116:3090–3100 [DOI] [PMC free article] [PubMed] [Google Scholar]
- 14.Dobreva I, Zschörnig O, James RW, Waeber G, Widmann C2005. Cholesterol is the major component of native lipoproteins activating the p38 MAPKs. Biol Chem 368:909–918 [DOI] [PubMed] [Google Scholar]
- 15.Graf GA, Connell PM, van der Westhuyzen DR, Smart EJ1999. The class B, type I scavenger receptor promotes the selective uptake of high density lipoprotein cholesterol ethers into caveolae. J Biol Chem 274:12043–12048 [DOI] [PubMed] [Google Scholar]
- 16.Horton JD, Goldstein JL, Brown MS2002. SREBPs: activators of the complete program of cholesterol and fatty acid synthesis in the liver. J Clin Invest 109:1125–1131 [DOI] [PMC free article] [PubMed] [Google Scholar]
- 17.Eberlé D, Hegarty B, Bossard P, Ferré P, Foufelle F2004. SREBP transcription factors: master regulators of lipid homeostasis. Biochimie 86:839–848 [DOI] [PubMed] [Google Scholar]
- 18.Horton JD, Shah NA, Warrington JA, Anderson NN, Park SW, Brown MS, Goldstein JL2003. Combined analysis of oligonucleotide microarray data from transgenic and knockout mice identifies direct SREBP target genes. Proc Natl Acad Sci USA 100:12027–12032 [DOI] [PMC free article] [PubMed] [Google Scholar]
- 19.Sachs AB, Varani G2000. Eukaryotic translation initiation: there are (at least) two sides to every story. Nat Struct Biol 7:356–361 [DOI] [PubMed] [Google Scholar]
- 20.Beretta L, Gingras AC, Svitkin YV, Hall MN, Sonenberg N1996. Rapamycin blocks the phosphorylation of 4E-BP1 and inhibits cap-dependent initiation of translation. EMBO J 15:658–664 [PMC free article] [PubMed] [Google Scholar]
- 21.Lin TA, Kong X, Haystead TA, Pause A, Belsham G, Sonenberg N, Lawrence Jr JC1994. PHAS-I as a link between mitogen-activated protein kinase and translation initiation. Science 266:653–656 [DOI] [PubMed] [Google Scholar]
- 22.Haghighat A, Mader S, Pause A, Sonenberg N1995. Repression of cap-dependent translation by 4E-binding protein 1: competition with p220 for binding to eukaryotic initiation factor-4E. EMBO J 14:5701–5709 [DOI] [PMC free article] [PubMed] [Google Scholar]
- 23.Gingras AC, Gygi SP, Raught B, Polakiewicz RD, Abraham RT, Hoekstra MF, Aebersold R, Sonenberg N1999. Regulation of 4E-BP1 phosphorylation: a novel two-step mechanism. Genes Dev 13:1422–1437 [DOI] [PMC free article] [PubMed] [Google Scholar]
- 24.Jiang YP, Ballou LM, Lin RZ2001. Rapamycin-insensitive regulation of 4e-BP1 in regenerating rat liver. J Biol Chem 276:10943–10951 [DOI] [PubMed] [Google Scholar]
- 25.Scheuner D, Kaufman RJ2008. The unfolded protein response: a pathway that links insulin demand with β-cell failure and diabetes. Endocr Rev[Erratum (2008)29:631] 29:317–333 [DOI] [PMC free article] [PubMed] [Google Scholar]
- 26.Yamaguchi S, Ishihara H, Yamada T, Tamura A, Usui M, Tominaga R, Munakata Y, Satake C, Katagiri H, Tashiro F, Aburatani H, Tsukiyama-Kohara K, Miyazaki J, Sonenberg N, Oka Y2008. ATF4-mediated induction of 4E-BP1 contributes to pancreatic β cell survival under endoplasmic reticulum stress. Cell Metab 7:269–276 [DOI] [PubMed] [Google Scholar]
- 27.Voccoli V, Mazzoni F, Garcia-Gil M, Colombaioni L2007. Serum-withdrawal-dependent apoptosis of hippocampal neuroblasts involves Ca++ release by endoplasmic reticulum and caspase-12 activation. Brain Res 1147:1–11 [DOI] [PubMed] [Google Scholar]
- 28.Hoppe V, Hoppe J2004. Mutations dislocate caspase-12 from the endoplasmatic reticulum to the cytosol. FEBS Lett 576:277–283 [DOI] [PubMed] [Google Scholar]
- 29.Brewster JL, Linseman DA, Bouchard RJ, Loucks FA, Precht TA, Esch EA, Heidenreich KA2006. Endoplasmic reticulum stress and trophic factor withdrawal activate distinct signaling cascades that induce glycogen synthase kinase-3 β and a caspase-9-dependent apoptosis in cerebellar granule neurons. Mol Cell Neurosci 32:242–253 [DOI] [PubMed] [Google Scholar]
- 30.Nakagawa T, Zhu H, Morishima N, Li E, Xu J, Yankner BA, Yuan J2000. Caspase-12 mediates endoplasmic-reticulum-specific apoptosis and cytotoxicity by amyloid-β. Nature 403:98–103 [DOI] [PubMed] [Google Scholar]
- 31.Keller GA, West MA, Harty JT, Wilkes LA, Cerra FB, Simmons RL1985. Modulation of hepatocyte protein synthesis by endotoxin-activated Kupffer cells. III. Evidence for the role of a monokine similar to but not identical with interleukin-1. Ann Surg 201:436–443 [DOI] [PMC free article] [PubMed] [Google Scholar]
- 32.Broussard SR, McCusker RH, Novakofski JE, Strle K, Shen WH, Johnson RW, Dantzer R, Kelley KW2004. IL-1beta impairs insulin-like growth factor i-induced differentiation and downstream activation signals of the insulin-like growth factor I receptor in myoblasts. J Immunol 172:7713–7720 [DOI] [PubMed] [Google Scholar]
- 33.Magagnin MG, van den Beucken T, Sergeant K, Lambin P, Koritzinsky M, Devreese B, Wouters BG2008. The mTOR target 4E-BP1 contributes to differential protein expression during normoxia and hypoxia through changes in mRNA translation efficiency. Proteomics 8:1019–1028 [DOI] [PubMed] [Google Scholar]
- 34.Robbesyn F, Garcia V, Auge N, Vieira O, Frisach MF, Salvayre R, Negre-Salvayre A2003. HDL counterbalance the proinflammatory effect of oxidized LDL by inhibiting intracellular reactive oxygen species rise, proteasome activation, and subsequent NF-κB activation in smooth muscle cells. FASEB J 17:743–745 [DOI] [PubMed] [Google Scholar]
- 35.Schmidt A, Geigenmüller S, Völker W, Buddecke E2006. The antiatherogenic and antiinflammatory effect of HDL-associated lysosphingolipids operates via Akt →NF-κB signalling pathways in human vascular endothelial cells. Basic Res Cardiol 101:109–116 [DOI] [PubMed] [Google Scholar]
- 36.Park SH, Park JH, Kang JS, Kang YH2003. Involvement of transcription factors in plasma HDL protection against TNF-α-induced vascular cell adhesion molecule-1 expression. Int J Biochem Cell Biol 35:168–182 [DOI] [PubMed] [Google Scholar]
- 37.Kimura T, Tomura H, Mogi C, Kuwabara A, Damirin A, Ishizuka T, Sekiguchi A, Ishiwara M, Im DS, Sato K, Murakami M, Okajima F2006. Role of scavenger receptor class B type I and sphingosine 1-phosphate receptors in high density lipoprotein-induced inhibition of adhesion molecule expression in endothelial cells. J Biol Chem 281:37457–37467 [DOI] [PubMed] [Google Scholar]
- 38.Argraves KM, Argraves WS2007. HDL serves as an S1P signaling platform mediating a multitude of cardiovascular effects. J Lipid Res 48:2325–2333 [DOI] [PubMed] [Google Scholar]
- 39.Mineo C, Deguchi H, Griffin JH, Shaul PW2006. Endothelial and antithrombotic actions of HDL. Circ Res 98:1352–1364 [DOI] [PubMed] [Google Scholar]
- 40.Negre-Salvayre A, Dousset N, Ferretti G, Bacchetti T, Curatola G, Salvayre R2006. Antioxidant and cytoprotective properties of high-density lipoproteins in vascular cells. Free Radic Biol Med 41:1031–1040 [DOI] [PubMed] [Google Scholar]
- 41.Rolli-Derkinderen M, Machavoine F, Baraban JM, Grolleau A, Beretta L, Dy M2003. ERK and p38 inhibit the expression of 4E-BP1 repressor of translation through induction of Egr-1. J Biol Chem 278:18859–18867 [DOI] [PubMed] [Google Scholar]
- 42.Mamane Y, Petroulakis E, LeBacquer O, Sonenberg N2006. mTOR, translation initiation and cancer. Oncogene 25:6416–6422 [DOI] [PubMed] [Google Scholar]
- 43.Holcik M, Sonenberg N2005. Translational control in stress and apoptosis. Nat Rev Mol Cell Biol 6:318–327 [DOI] [PubMed] [Google Scholar]
- 44.Gingras AC, Raught B, Sonenberg N2001. Regulation of translation initiation by FRAP/mTOR. Genes Dev 15:807–826 [DOI] [PubMed] [Google Scholar]
- 45.Spriggs KA, Stoneley M, Bushell M, Willis AE2008. Re-programming of translation following cell stress allows IRES-mediated translation to predominate. Biol Cell 100:27–38 [DOI] [PubMed] [Google Scholar]
- 46.Holcik M, Sonenberg N, Korneluk RG2000. Internal ribosome initiation of translation and the control of cell death. Trends Genet 16:469–473 [DOI] [PubMed] [Google Scholar]
- 47.Bushell M, Stoneley M, Kong YW, Hamilton TL, Spriggs KA, Dobbyn HC, Qin X, Sarnow P, Willis AE2006. Polypyrimidine tract binding protein regulates IRES-mediated gene expression during apoptosis. Mol Cell 23:401–412 [DOI] [PubMed] [Google Scholar]
- 48.Li S, Sonenberg N, Gingras AC, Peterson M, Avdulov S, Polunovsky VA, Bitterman PB2002. Translational control of cell fate: availability of phosphorylation sites on translational repressor 4E-BP1 governs its proapoptotic potency. Mol Cell Biol 22:2853–2861 [DOI] [PMC free article] [PubMed] [Google Scholar]
- 49.Polunovsky VA, Gingras AC, Sonenberg N, Peterson M, Tan A, Rubins JB, Manivel JC, Bitterman PB2000. Translational control of the antiapoptotic function of Ras. J Biol Chem 275:24776–24780 [DOI] [PubMed] [Google Scholar]
- 50.Heimberg H, Heremans Y, Jobin C, Leemans R, Cardozo AK, Darville M, Eizirik DL2001. Inhibition of cytokine-induced NF-κB activation by adenovirus-mediated expression of a NF-κB super-repressor prevents β-cell apoptosis. Diabetes 50:2219–2224 [DOI] [PubMed] [Google Scholar]
- 51.Jordan M, Schallhorn A, Wurm FM1996. Transfecting mammalian cells: optimization of critical parameters affecting calcium-phosphate precipitate formation. Nucleic Acids Res 24:596–601 [DOI] [PMC free article] [PubMed] [Google Scholar]
- 52.Brummelkamp TR, Bernards R, Agami R2002. A system for stable expression of short interfering RNAs in mammalian cells. Science 296:550–553 [DOI] [PubMed] [Google Scholar]
- 53.Rubinson DA, Dillon CP, Kwiatkowski AV, Sievers C, Yang L, Kopinja J, Rooney DL, Zhang M, Ihrig MM, McManus MT, Gertler FB, Scott ML, Van Parijs L2003. A lentivirus-based system to functionally silence genes in primary mammalian cells, stem cells and transgenic mice by RNA interference. Nat Genet 33:401–406 [DOI] [PubMed] [Google Scholar]
- 54.Havel RJ, Eder HA, Bragdon JH1955. The distribution and chemical composition of ultracentrifugally separated lipoproteins in human serum. J Clin Invest 34:1345–1353 [DOI] [PMC free article] [PubMed] [Google Scholar]
- 55.James RW, Pometta D1990. Differences in lipoprotein subfraction composition and distribution between type I diabetic men and control subjects. Diabetes 39:1158–1164 [DOI] [PubMed] [Google Scholar]
- 56.Michod D, Widmann C2007. TAT-RasGAP317–326 requires p53 and PUMA to sensitize tumor cells to genotoxins. Mol Cancer Res 5:497–507 [DOI] [PubMed] [Google Scholar]
- 57.Smyth GK2004. Linear models and empirical bayes methods for assessing differential expression in microarray experiments. Stat Appl Genet Mol Biol 3:Article3 [DOI] [PubMed]
- 58.Bonvin C, Guillon A, van Bemmelen MX, Gerwins P, Johnson GL, Widmann C2002. Role of the amino-terminal domains of MEKKs in the activation of NFκB and MAPK pathways and in the regulation of cell proliferation and apoptosis. Cell Signal 14:123–131 [DOI] [PubMed] [Google Scholar]