

Abstract
Many biochemical pathways are driven by G protein-coupled receptors, cell surface proteins that convert the binding of extracellular chemical, sensory, and mechanical stimuli into cellular signals. Their interaction with various ligands triggers receptor activation that typically couples to and activates heterotrimeric G proteins, which in turn control the propagation of secondary messenger molecules (e.g. cAMP) involved in critically important physiological processes (e.g. heart beat). Successful transfer of information from ligand binding events to intracellular signaling cascades involves a dynamic interplay between ligands, receptors, and G proteins. The development of Förster resonance energy transfer and bioluminescence resonance energy transfer-based methods has now permitted the kinetic analysis of initial steps involved in G protein-coupled receptor-mediated signaling in live cells and in systems as diverse as neurotransmitter and hormone signaling. The direct measurement of ligand efficacy at the level of the receptor by Förster resonance energy transfer is also now possible and allows intrinsic efficacies of clinical drugs to be linked with the effect of receptor polymorphisms.
GPCR studies in live cells have revealed kinetics and rate-limiting steps in receptor-mediated signaling, and have linked receptor polymorphisms and drug selectivity.
Brief Overview of G Protein-Coupled Receptors (GPCRs)
GPCRs consist of seven membrane-spanning α-helical structures (1, 2) with an extracellular amino terminus and an intracellular carboxy tail, and represent the largest family of cell surface receptors (Fig. 1A). They have evolved to detect and transmit a large palette of extracellular signals into virtually every eukaryotic cell (Fig. 1B). Signal transduction begins when an extracellular ligand agonist binds and switches the receptor from an inactive state to an active state conformation. Activated receptors catalyze the exchange of GDP for GTP on the α-subunit of heterotrimeric G proteins (Gαβγ), which in turn engages conformational and/or dissociational events between the Gα and dimeric Gβγ subunits (3). Both the GTP-bound Gα subunit and the Gβγ dimer can then initiate or suppress the activity of effector enzymes (e.g. adenylyl cyclases, phosphodiesterases, phospholipases), and ion channels (e.g. G protein-activated inwardly rectifying K+ channels) that modulate diverse signaling pathways (4). As key regulators of many biochemical cascades involved in the physiology of vital systems such as cardiovascular, nervous, immune, and endocrine, GPCRs have emerged as important targets for human therapeutics (5, 6). Defects in receptor signaling caused by overexpression or genetic mutations of receptors are intimately involved in various human pathologies such as cancer, retinitis pigmentosa, hypercalcemia, and dwarfism, among others (7, 8, 9). The ubiquitous presence of GPCRs and their critical role in cellular signaling, and in human diseases, underscores the importance of elucidating signaling mechanisms of this central family of cell membrane receptors. Several questions are critically important to understand the principle of GPCR signaling in intact cells. What are the kinetics of GPCR activation and signaling? Can a receptor adopt multiple active states to induce distinct signaling pathways? How do ligands of different intrinsic efficacies act on receptors? Do receptor polymorphisms influence drug sensitivity? Can receptors exist in variable states of coupling/precoupling to G proteins? In this perspective, we discuss the most recent studies aimed to address these fundamental questions.
Fig. 1.

Basic principle of GPCR-mediated signal transduction. A, Molecular representation of a GPCR based on the x-ray crystal structure of rhodopsin (1 ). Helices 3 and 6 are shown in blue and green, respectively. B, Basic pattern of ligand-mediated GPCR signal transduction. After ligand agonist binding, the receptor undergoes conformational changes, which promotes the coupling with heterotrimeric G proteins (Gαβγ) and catalyzes the exchange of GDP by GTP on the α-subunit. This event engages conformational and /or dissociational events between the α- and βγ-subunits, and both GTP-bound Gα-subunit and the Gβγ-dimer can then modulate the activity of various effectors. For example, stimulation or inhibition of adenylyl cyclase (AC)-mediated cAMP synthesis by the α-subunit of the Gs or Gi families, respectively; production of inositol 1,4,5-triphosphate (IP3) and 1,2-diacylglycerol (DAG) after cleavage of phosphatidylinositol 4,5-biphosphate (PIP2) by Gαq stimulation of phopholipase C (PLC); activation of Gi and Go also mediated most of the Gβγ-mediated signaling processes such as activation of GIRK.
Receptor Activation
The nature and mechanisms of receptor activation have been revealed in part by a series of spectroscopic and biochemical techniques (10), which consistently suggested that agonist-induced activation of GPCRs leads to a rearrangement of the receptor’s transmembrane helices relative to one another, particularly helices 3 and 6 (Fig. 1A and Refs. 11, 12, 13). In the case of the β2AR, full receptor activation is triggered by at least two independent molecular mechanisms. This includes the release of an ionic lock switch that holds together the cytoplasmic sides of helix 3 and helix 6 in the inactive state of the receptor, and a rotamer toggle switch mechanism that modulates the conformation of helix 6 (14). Such helical movements have been monitored for purified receptors by diverse biophysical and biochemical approaches recently reviewed (15) and are thought to expose receptor epitopes at the cytosolic side that drive coupling and activation of heterotrimeric G proteins. A limitation with these studies performed on purified and reconstituted receptors was the difficulty of recording fast kinetics of ligand-induced conformational changes that would be compatible with the biological response to receptor activation occurring within seconds. The use of a Förster resonance energy transfer (FRET) and bioluminescence resonance energy transfer (BRET) approaches have now detailed in live cells kinetics of receptor activation (see Box 1).
The rapid formation of the active receptor state can be monitored by an intramolecular FRET signal that occurs in a GPCR with both cyan fluorescent protein (CFP) and yellow fluorescent protein (YFP), or CFP and fluorescein arsenical hairpin binder (FlAsH) attached to the third intracellular loop and the carboxy tail (referred to as GPCRCFP/YFP or GPCRCFP/FlAsH; see Fig. 2B and Box 1 for details). Vilardaga et al. (16) showed that upon agonist binding, a FRET signal produced by a receptor sensor rapidly followed a monoexponential decrease, presumably reflecting a conformational rearrangement that takes place as the receptor switches from an inactive to an active state. The use of CFP/YFP as a FRET pair limits structural information on distance change within the receptor (see Box 1); however, the decrease of the FRET signal is compatible with a movement of the third intracellular loop away from the carboxy termini of the receptor during activation. Successfully applied to receptors as diverse as the adenosine A2A-receptor, the α2A- and β1-adrenergic receptors (α2AAR, β1AR), and the PTH receptor (PTHR), this strategy revealed that a shift of the receptor into an active signaling conformation is much faster than previously thought. For example, receptor switching by a full agonist is much faster for the adenosine A2A-receptor, the α2AAR, and the β1AR (time constant τ = 30–50 msec) than the PTHR (τ ≈ 1 sec) (Fig. 3A) (16, 17, 18). The mechanistic reasons for these differences in kinetics are not clear but may depend both on the nature of the receptor and on distinct modes of binding between peptide hormones and smaller molecules. In particular, Castro et al. (19) revealed a complex mode of binding of PTH to PTHR, with a first fast interaction (τ = 140 msec) with the N-terminal domain of the receptor followed by a second slower binding step (τ = 1 sec) to the receptor’s transmembrane domain that coincides with the activation switch of the receptor. Additional studies should reveal whether the time course of receptor activation is an intrinsic property of the receptor or dependent on the type of ligand and its mode of binding to the receptor. Alternate possibilities are not excluded; for example, interaction of the PTHR with one of the single transmembrane protein member of the receptor activity-modifying protein family (20), and/or the Na+/H+ exchanger regulatory factor adaptor protein (21), may stabilize distinct receptor conformations and influence kinetics of PTHR activation.
Fig. 2.
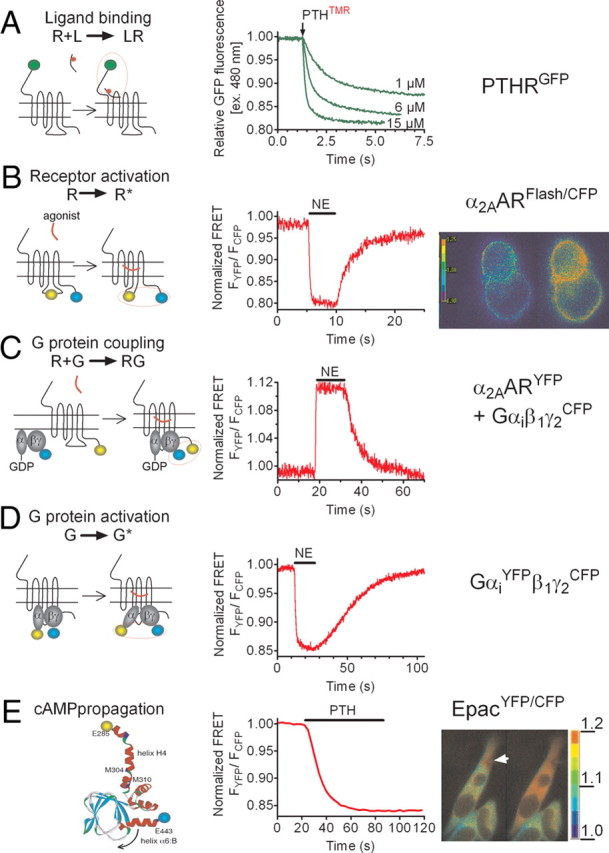
Application of FRET for recording individual steps of GPCR activation in live cells. Ligand binding (A), receptor interaction (B), G protein coupling (C), G protein activation (D), cAMP propagation (E). The left panels illustrate the design of FRET sensors (green, GFP; blue, CFP, yellow, YFP), and the right panels represent the normalized YFP/CFP emission ratios (see Box 1 for details). A, Ligand-receptor interaction measured by FRET between GFP-tagged PTHR and TMR-labeled PTH. Shown are the changes of GFP emission by FRET in response to rapid superfusion of diverse concentrations of PTH(1-34)-TMR. [Adapted with permission from M. Castro et al.: Proc Natl Acad Sci USA 102:16084–16089, 2005 (19 ). ©National Academy of Sciences.] B, After norepinephrine (NE) application (horizontal bar), activation of α2AAR was monitored in a single HEK-293 cell by a decrease in the FRET signal of α2AARFlAsH/CFP defined as the ratio of emission intensities of FlAsH/CFP. [Adapted with permission from C. Hoffmann et al.: Nat Methods 2:171–176, 2005 (17 ). ©Nature Publishing Group.] C, The interaction between α2AAR and Gi proteins in response to NE is measured as an increase in FRET between YFP-labeled α2AAR and CFP-labeled Gγ2 in combination with Gαi1 and Gβ1 proteins. [Adapted with permission from P. Hein et al.: EMBO J 24:4106–4114, 2005 (36 ). ©European Molecular Biology Organization.] D, Detection of Gi activation in cells expressing the wild-type α2AAR by recording FRET between YFP-labeled Gαi and CFP-labeled Gγ2-subunits. [Adapted with permission from M. Bünemann et al.: Proc Natl Acad Sci USA 100:16077–16082, 2003 (49 ). ©National Academy of Sciences.] E, PTH-mediated cAMP response upon PTHR activation in HEK-293 cells measured as a decrease of FRET in the EpacCFP/YFP sensor. The right panels show the propagation of the cAMP response represented as pseudocolored image of the FRET (CFP/YFP emission) ratio before and after stimulation of a single cell with PTH(1–34) via a pipette indicated by an arrow at t = 0 sec. The scale bar on the right indicates the pseudocolored scale of the fluorescence ratios. The inner bar represents 5 μm. s, Seconds. [Adapted with permission from M. Castro et al.: Proc Natl Acad Sci USA 102:16084–16089, 2005 (19 ). ©National Academy of Sciences.]
Fig. 3.

Kinetics of receptor activation. A, Relationship between the apparent rate constant kobs of receptor activation and agonist concentrations. Size comparison of norepinephrine and PTH(1-34) are shown. [Adapted with permission from J.-P. Vilardaga et al.: Nat Biotechnol 21:807–812, 2003 (16 ). ©Nature Publishing Group.] B, Simultaneous recording of FRET responses and GIRK current from a single cell expressing α2AARCFP/YFP and GIRK1+4, and during continuous superfusion with control buffer or 100 μm norepinephrine (NE) (horizontal bar). ms, Milliseconds.
Direct Measurement of Drug Efficacies at GPCRs
A fundamental property of drugs acting at receptors is the distinction between ligands that either produce a maximal (full agonists) or submaximal (partial agonists) receptor-mediated response, or reduce (inverse agonists) basal levels of receptor signaling. To understand the mechanism by which these distinct classes of ligands produce variable responses corresponding to their varying intrinsic efficacies, two general models for allosteric proteins of Monod, Wyman, and Changeux (22), and Koshland, Nemethy, and Filmer (23) have been envisioned. In the Monod-Wyman-Changeux model, full- and partial agonists shift the receptor from an inactive ground state (called R) into the active conformational state (called R*) capable of coupling and activating G proteins, but partial agonists stabilize the receptor in its active conformation (R*) less effectively, thereby producing smaller cellular signals. In contrast, inverse agonists preferentially stabilize the resting state (R). In the Koshland-Nemethy-Filmer model, agonists of distinct efficacies induce different receptor conformations, each displaying distinct abilities to activate G protein signaling. In support of this latter model, several fluorescence spectroscopic studies comparing the effects of full and partial agonists on purified β2-adrenergic and serotonin 5-hydroxytryptamine (5-HT4) receptors provided evidence that GPCRs adopt distinct conformations in response to agonists of distinct efficacies (25, 26). Recent FRET studies with the α2A-adrenergic receptor also showed that a GPCR adopts multiple conformational states in a living cell (27, 28). For example, full and partial agonists produce a decrease of FRET in the α2AARCFP/YFP biosensor, whereas inverse agonists produce effects in the opposite direction (Fig. 4A). These compounds not only induced conformational changes of a different nature, but divergence also appeared in the kinetics: FRET signals induced by partial agonists are smaller and slower than those induced by full agonists and depend on the functional efficacies of the agonist (Fig. 4A). The action of inverse agonists is even slower still. These different kinetics depend on neither structural differences between ligands nor their binding affinities but correlate with ligand efficacies (28). These studies support the view that GPCRs in live cells not only switch between an inactive receptor state (off) and a ligand-bound active receptor state (on), but may adopt distinct conformations in response to compounds of diverse intrinsic efficacies.
Fig. 4.

Direct recording of intrinsic efficacy at GPCRs. A, Example of FRET signal seen during sequential application of ligands of distinct efficacies to a single human embryonic kidney (HEK)-293 cell expressing α2AARYFP/CFP. [Adapted with permission from J.-P. Vilardaga et al.: Nat Chem Biol 1:25–28, 2005 (27 ). ©Nature Publishing Group.] The left trace represents the FRET signals mediated by the full agonist norepinephrine (NE), and by the inverse agonist yohimbine. The right trace represents the action of saturating concentrations of the full agonist NE or the partial agonist clonidine added alone or together. The simultaneous application of NE and clonidine restored the partial response seen with clonidine alone. This corresponds to the predicted properties of a high-affinity partial agonist. [Adapted with permission from J.-P. Vilardaga et al.: Nat Biotechnol 21:807–812, 2003 (16 ). ©Nature America Publishing.] The right panel represents the correlation between the rate constant of receptor activation, and respective extent of FRET amplitude seen with ligands of different efficacies. Norepinephrine (NE), UK-14,403 (UK), dopamine (DA), moxonidine (Mox), oxymetazoline (Oxy), clonidine (Clo), RX821002 (RX), yohimbine (Yoh), and rauwolscine (Rau). [Adapted with permission from J.-P. Vilardaga et al.: Nat Chem Biol 1:25–28, 2005 (27 ). ©Nature Publishing Group.] B, Effect of β1-AR polymorphisms on β-blocker responses. FRET signals in cells expressing the Gly389-β1ARCFP/YFP sensor (black traces) or the Arg389-β1ARCFP/YFP sensor (red traces) after application of the β-blockers carvedilol or metoprolol. The right panel represents tracing of the beating frequency of primary cardiomyocytes expressing the Gly389-β1ARCFP/YFP or the Arg389-β1ARCFP/YFP before and after stimulation with carvedilol. The marked inverse agonist effect of carvedilol on the Arg389-β1AR led to a significant reduction of the beating frequency of cells carrying this receptor variant. s, Seconds. [Adapted with permission from F. Rochais et al.: J Clin Invest 117:229–235, 2007 (18 ). ©American Society for Clinical Investigation.]
Linking Receptor Polymorphisms and Drug Selectivity
The ability to record the effects of ligand efficacy directly at the level of the receptor has now allowed intrinsic efficacies of clinically used drugs to be linked with the effects of receptor polymorphisms. In particular, the successful treatment of patients with chronic heart failure by drugs known as β-blockers (i.e. β-receptor antagonists) seems to differ according to the genetic heterogeneity of the β1AR. A frequent receptor polymorphism found in heart failure patients is the substitution of Arg or Gly at position 389 in the carboxy terminus tail of the β1AR, and patients with the Arg389 variant showed a better survival rate upon treatment with the β-blocker bucindolol (29). Other β-blockers currently in clinical use, such as metoprolol, bisoprolol, and carvedilol, act as inverse agonists of the human β1AR and have demonstrated significant improvement in survival in patients with severe chronic heart failure (30). Yet the association of receptor polymorphisms and the effect of these three β-blockers to prevent receptor signaling are unclear. The results of a FRET study done with the β1ARCFP/YFP sensor (18) showed that the three β-blockers switched off the Gly389-variant receptor to varying degrees, but carvedilol differentiated itself from both metoprolol and bisoprolol by specific and marked inverse agonist effects at the Arg389-variant (Fig. 4B). The specific effect of carvedilol on the more frequent Arg389-variant of the β1AR was further confirmed by the different control of beating frequency in cardiac myocytes expressing the two receptor variants (18) (Fig. 4B). This FRET study suggests that carvedilol therapy could be the treatment best suited for individuals carrying the Arg389-variant receptor. This opens a strategy that may fine-tune a therapy targeted to the receptor genotype of a patient as an example of personalized medicine.
Coupling of G Proteins to Receptors: Precoupling or Diffusion-Controlled Mechanisms?
Activated GPCRs interact and activate diverse subtypes of heterotrimeric G proteins (e.g., Gs, Gq, G12/13, and Gi) attached to the inner side of the cell membrane to mediate signal transduction in what is presumably a rapid and selective process. Rapidity and selectivity challenge the classical model of receptor signaling based on random collisions between the receptor and G proteins that diffuse freely along the plasma membrane. Even though the receptor-G protein (R/G) interaction has been the object of many investigations, no final conclusion has been drawn regarding the general principle of coupling. It is under intense debate whether the receptor-G protein complex is constitutively assembled in an inactive state and only becomes activated upon ligand binding to the receptor (precoupling model), or whether it only forms after agonist exposure, in which case the receptor-G protein interaction would be diffusion limited (free collision coupling). Many groups favor the concept of free collision coupling (31, 32), whereas others postulate coupling within a preformed complex (33, 34, 35). FRET and BRET have recently been employed to investigate this interaction in live cells (Fig. 2C and Box 1). By measuring FRET between α2AARYFP and Gαi1, GβγCFP, Hein et al. (36) were able to measure an agonist-stimulated FRET signal with an amplitude limited by the transient nature of the receptor-G protein interaction (Fig. 5A). At saturating agonist concentrations, the onset kinetics of the R/G interaction were surprisingly fast and almost indistinguishable from receptor activation kinetics (both τ ≈ 40 msec). Although this may indicate that receptors and G proteins are precoupled in the absence of agonist, Hein et al. (36) found no evidence of a specific precoupling between inactive α2AAR and Gi and showed that interaction kinetics were dependent on the expression level of functional G proteins as predicted for collision coupling. In this case, the expression level of the individual proteins is always very critical for kinetics of a bimolecular reaction. Therefore, kinetics of receptor-G protein interaction may change dramatically dependent on the level of receptor expression and may change from tissue to tissue. For instance, substantial differences in the level of receptor expression actually have been reported to be responsible for differential kinetics of adenosine- and acetylcholine-mediated GIRK (G protein-regulated inward rectifier potassium channels) activation in atrial myocytes (37).
Fig. 5.

FRET-based detection of receptor-G protein interaction and G protein activation in single cells. A, FRET between fluorescent α2AAR and fluorescent heterotrimeric Gi proteins was detected in single cells. When agonist [norepinephrine NE)] was applied, receptor/G protein complex formation resulted in generation of a FRET signal. The amplitude of the FRET was dramatically increased when using a N270D mutation of Gαi1 (Gαi1-ND), which prolongs receptor-G protein interaction (36 ). These results led to the conclusion that wild type (WT) G proteins only interact with activated receptors and that the time period of interaction is short relative to the G protein cycle. B, FRET-based measurement of mammalian Gi protein activity revealed increased FRET between α- and βγ-subunits during activation, challenging the widely accepted hypothesis of subunit dissociation after activation. Comparison of Gi (left panel) and Go (right panel) protein activation revealed a differential activation pattern of Gi and Go proteins. Whether Gαo-containing heterotrimers dissociate or just undergo a differential subunit rearrangement remains an open question. s, Seconds. [Adapted with permission from M. Bünemann et al.: Proc Natl Acad Sci USA 100:16077–16082, 2003 (49 ). ©National Academy of Sciences; and M. Frank et al.: J Biol Chem 280:24584–24590, 2005 (50 ). ©American Society for Biochemistry and Molecular Biology.]
This question was recently reexamined by Qin et al. (38) who used a technique based on measuring the lateral mobility of the α2AAR and Gi proteins with fluorescence recovery after photobleaching (FRAP). They found that immobilizing cell surface α2AARs had no detectable effect on the mobility of fluorescently labeled Gα-subunits or Gβγ-dimers, even though it could be shown that these receptors and G proteins interacted functionally. These observations are not consistent with a highly-stable precoupled complex between α2AAR and G proteins.
These findings from Hein et al. and Qin et al. (36, 38) that precoupling of α2AAR and Gi proteins either does not exist or occurs with a probability below the limit of detection is not uncontested, because independent FRET and BRET studies using similar conditions (identical receptor-G protein combinations and cellular background) supported an association of inactive receptors and G proteins. The reason for these opposite conclusions is unclear. The sensitivities of the various assays employed and the reliance on control proteins to rule out nonspecific interactions may be important factors. In any case it seems likely that receptors might differ in their ability to precouple to G proteins. By non-RET-based studies Levy and colleagues (44) have made a strong case for a differential precoupling of serotonin receptors. 5-HT7 receptors specifically precouple with Gs proteins, whereas no such precoupling was observed for 5-HT4 receptors. Obviously, this topic will need further studies including the clarification of the physiological role of precoupling.
Activation of G Proteins: Conformational or Dissociational Events?
Heterotrimeric G proteins comprise a family of functionally diverse but structurally conserved α- and βγ-subunits. Biochemical studies have established that the activation of G proteins involves the exchange of GTP for GDP on the inactive Gα(GDP)Gβγ heterotrimer, which engages conformational changes leading to the dissociation between Gα(GTP)- and Gβγ-subunits. Both α- and βγ-subunits are then capable of interacting with effectors such as membrane-anchored enzymes or ion channels (45). Based on in vitro experiments using purified G proteins, the concept of subunit dissociation (Gαβγ →Gα + Gβγ) upon receptor activation was initially widely accepted. This concept can explain specificity in Gα-subtype-mediated signaling responses but is insufficient to explain specificity of Gβγ-mediated responses such as those regulated via Gβγ-subunits derived from certain (pertussin toxin-sensitive) G protein subtypes (46). The methods for utilizing FRET to study G protein activation in live cells were initially developed in dictyostelium (47) and later applied to yeast (48), and to mammalian G proteins (49, 50, 51, 52) (see Box 1). For Gi proteins, Bünemann and co-workers (49, 50) showed that G protein activation leads to an increase in FRET between YFPGαi and CFPGβγ (Fig. 5B), which is not compatible with the idea of complete separation of all α- and βγ-subunits during activation. An increase in FRET upon G protein activation was found for Gαi1,2,3- and Gαz-containing G proteins. In contrast, Go proteins exhibited a decrease in FRET upon activation reflecting a subunit dissociation or, alternatively, a distinct conformational rearrangement (Fig. 5B) (50). Sequence comparison and subsequent analysis of chimeric Gα-subunits between Gi and Go further revealed that the αB-αC region of Gαi was required for the observed activation-induced increase in FRET (50). The decrease in FRET upon activation of YFPGαo and CFPGβγ is typically not more than 30% (48, 50) (Fig. 5B), which suggests that either the major fraction of Go proteins is not activated even in the presence of saturating receptor stimulation, or that all α- and βγ-subunits are not separated at steady state. Recent studies by Bouvier and co-workers (53), which used BRET to study G protein activation, similarly demonstrated BRET increases for both Gs and Gi proteins. The strongest experimental evidence for subunit rearrangement was the fact that the direction of the agonist-induced resonance energy transfer (RET) change was dependent on the anchoring points within the Gα-subunit for the BRET sensor (53). These data suggest that in live cells Gαi protein activation may proceed via a subunit rearrangement rather than a complete dissociation, which might explain how Gα-subunits can confer signal specificity for some Gβγ-effector interactions.
However, even if a majority of G protein heterotrimers remain intact after activation, it is difficult to rule out the possibility that some fraction of active heterotrimers physically dissociate using FRET or BRET. Here again, studies using FRAP to measure the mobilities of interacting proteins has provided complementary information (54). In this study, Gα-subunits were fused at their N termini to a transmembrane peptide that contained an extracellular GFP variant. When immobilized by extracellular biotinylation and cross-linking with avidin, these Gα-subunits were strongly able to restrict the mobility of coexpressed fluorescent Gβγ-subunits. Receptor-mediated activation of immobilized Go and Gi3, but not Gs proteins, led to a 30% increase in the fraction of mobile Gβγ-subunits, suggesting that a fraction of active heterotrimeric Gi proteins dissociate in intact cells (54). This study found that active Gαo proteins seem to dissociate more readily than Gαi3, and this difference was even more pronounced for GTPase-deficient mutants of Gα (54). The conclusion that Gβγ dissociates less readily from active Gαi proteins than Gαo proteins, and even less readily from Gs proteins, is consistent with the FRET and BRET data (49, 50, 53). Additional evidence consistent with subunit dissociation comes from studies in which Gβγ-dimers containing farnesylated Gγ-subunits (but not Gα-subunits) dissociate from the plasma membrane after activation (55, 56, 57). These studies also suggest that Go heterotrimers dissociate more readily than Gs-heterotrimers, and that Gi-heterotrimers are intermediate. Together the RET, FRAP, and membrane dissociation experiments make two important points regarding heterotrimer dissociation that were not fully appreciated before studies in live cells. First, at steady state the majority of heterotrimers in a cell may be in a rearranged conformation and not dissociated. Second, the fraction of heterotrimers in these two states is likely to vary depending on the Gα-isoform.
Conclusion
FRET-based approaches applied to GPCRs and heterotrimeric G proteins allow the kinetic analysis of initial steps of receptor-mediated signaling in live cells. With millisecond temporal resolution, we can now record ligand binding, receptor activation, receptor and G protein association, G protein activation, and cAMP propagation (see Box 1). A comparison of receptor and G protein interaction kinetics with the kinetics of G protein activation will reveal whether the ligand-mediated activation of G proteins itself is a rate-limiting step in signaling. In addition, the recording of ligand-induced conformational change in a GPCR now enables the direct analysis of the intrinsic efficacies of ligands. FRET-based visualization of GPCR activation in living cells also opens new avenues to explore spatiotemporal dynamics of GPCR signaling in a large variety of cell types.
Box 1
FRET as a tool to study kinetics of individual steps of the GPCR-signaling cascade in live cells
First described by Jean Perrin in 1930 (58), and later elucidated and developed by Theodor Förster in 1948 (59), FRET is a process by which an excited fluorophore molecule (the donor) transfers nonradiative energy to a neighboring acceptor fluorophore. FRET occurs when donor and acceptor molecules are in close proximity (1–100 Å of each other) and share a spectral overlap between the donor’s emission and acceptor’s absorption spectrums. The efficiency of the energy transfer between donor and acceptor molecules falls off with the sixth power of the distance between the two fluorophores. Thus, FRET is well suited to report both protein-protein interactions (intermolecular FRET) and conformational changes (intramolecular FRET) when the two fluorophores are in two separate proteins or are within a single protein, respectively (60).
The combination of CFP and YFP is the most popular FRET pair for the study of protein interaction between biomolecules (61). These two GFP variants can be easily incorporated into proteins by genetic engineering and can be used to monitor the complex formation between two proteins, quantify molecular dynamics in ligand-receptor interactions, protein conformational changes, and second messenger responses in living cells. Whereas FRET with CFP/YFP or CFP/FlAsH (see below) provides powerful insights into kinetics and mechanisms of protein associations, and protein conformational changes, the calculation of atomic distances is limited by the difficulty of distinguishing with precision changes in dipole orientation and distances between the fluorophores moieties. The CFP/YFP pair has an excellent resolution for recording FRET with both dual emission photometry and imaging systems (16, 17), but a limitation is the requirement for external excitation illumination of the donor to initiate the fluorescence transfer, which leads to slight direct excitation of the acceptor (also called “cross talk”). In addition to the unavoidable direct excitation of the YFP by light at 436 nm, another critical source of background noise is caused by the partial overlap of the donor’s emission into the acceptor’s emission wavelength (called “bleed-through”). These sources of non-FRET signal need to be controlled for any type of quantitative FRET analysis and can be easily corrected (62). These difficulties can be overcome by using BRET, which depends on the bioluminescent enzyme luciferase (typically from Renilla reniformis) rather than CFP to produce an emitted light compatible with YFP excitation (40, 53).
Several genetically encoded FRET sensors have been recently developed to record individually the initial steps of GPCR signaling in live cells. These steps include ligand binding, receptor activation, coupling of activated receptor to G protein, and activation of G proteins.
Kinetics of ligand binding to receptors can be recorded with high temporal resolution when part of the resonance energy from the donor fluorophore (e.g. GFP), inserted or fused to the N-terminal extracellular domain of a receptor, is transferred to the acceptor molecule [such as the small red fluorophore, tetramethyl-rhodamine (TMR)] attached to the ligand (19). If GFP and TMR are not in close proximity, energy is not efficiently transferred, and only the green light emitted by GFP is detected. When GFP and TMR are brought into close proximity by means of the specific binding between ligand and receptors, energy is efficiently transferred from GFP to TMR, resulting in the emission of red light from TMR and simultaneously the decrease in emission of the green light from GFP (Fig. 2A). This decrease in GFP fluorescence allowed the measurement of real-time kinetics of association between peptide hormones such as PTH and neurokinin A and their respective receptors (19, 63).
For monitoring receptor conformational changes, CFP is fused at the carboxyl terminus and YFP inserted in the third intracellular loop of the receptor, or vice versa (16–18) (Figs. 2B and 6). Alternatively, the membrane-permeable dye molecule FlAsH can substitute for the YFP moiety as the acceptor (17). FlAsH is a small molecule that becomes fluorescent when specifically bound to the tetracysteine motif CCPGCC, which can be genetically inserted into different domains of the receptor (17) (e.g. the third intracellular loop). These receptor sensors are well expressed at the cell surface and are functional (Fig. 3B), although G protein coupling is somewhat reduced for the GPCRCFP/YFP constructs. Typically, insertion of the CFP into the third intracellular loop reduced agonist efficacy for receptor signaling by up to 2 orders of magnitude compared with wild-type receptors (16, 17, 64). Experiments are performed under a fluorescence microscope, where light at 436 nm selectively excited a single cell expressing the receptor sensor to induce cyan (CFP), and via FRET yellow (FlAsH or YFP) fluorescence, which is simultaneously recorded over time. When agonist binding induces a conformational twist of the receptor, the distance and/or relative dipole-dipole orientation of the CFP and YFP change, leading to a fast decrease in FRET monitored as the ratio of emission intensities of YFP and CFP fluorescence. The high sensitivity of FRET-based receptor sensors allows the direct visualization of the activation switch of the receptor in response to an agonist in live cells (17), as well as the simultaneous recording of receptor and effector activation/deactivation cycle with the α2aAR and GIRK channel as an example (Fig. 3B).
Fig. 6.

(Box 1). Principle of FRET experiments. A–H, Examples of intermolecular and intramolecular FRET experiments showing direct recordings of norepinephrine (NE)-mediated activation of the α2A-AR and its interaction with the heterotrimeric G protein. Experiments were performed under a fluorescence microscope, where light at 436 nm selectively excited a single cell expressing α2A-ARFlAsH/CFP (A), or coexpressing α2AAR C-terminally tagged with YFP (α2A-ARYFP) together with Gαi1, Gβ1, andGγ2 N-terminally tagged with CFP (Gγ2CFP) (E) to induce donor (CFP) and acceptor (FlAsH or yellow) emission fluorescences simultaneously recorded over time (B and F). FRET was calculated as the ratio of corrected emission intensities FYFP/FCFP (C and G). D and H, Relationship between the time constant of α2A-ARFlAsH/CFP activation (D), or α2A-ARCFP/Gαi1β1γ2YFP interaction (H) after stimulation by NE (100 μm) and receptor or G protein concentrations. Time constant values are obtained from fitting the kinetic data of experiments like those of Fig. 6, C and G. For the intermolecular receptor-G protein interaction, the kinetics depended on expression levels of Gi. I–K, Determination of specific and nonspecific FRET between membrane proteins. The efficiency of FRET, calculated by the recovery of donor emission after acceptor photobleaching (J), of a specific association between receptors C-terminally tagged with CFP or YFP increases as a hyperbolic function of the concentration of the acceptor (K). In contrast, nonspecific interactions between membrane-anchored CFP and YFP molecule, which is caused by random distribution and collision, gave a linear increase in FRET efficiency. s, Seconds; ms, milliseconds. [Adapted with permission from P. Hein et al.: EMBO J 24:4106–4114, 2005 (36 ). ©European Molecular Biology Organization; and J.-P. Vilardaga et al.: Nat Chem Biol 4:126–131, 2008 (72 ). ©Nature Publishing Group.]
For FRET assays involving G proteins (Fig. 2, C and D), GFP variants were attached to the G protein subunits at various positions. For Gαi, CFP or YFP was inserted at position 91, whereas Gβ- and Gγ-subunits were fused to GFP variants at their C or N termini. These constructs preserved dimer and heterotrimer formation and were functional with respect to receptor coupling as well as effector activation (49). However, C-terminal labeling of the γ-subunit resulted in loss of the lipid modification site and, consequently, in reduced membrane targeting (49). Based on the classical model that receptor-mediated activation of G protein results in the dissociation between α- and βγ-subunits, activation of FRET-based G protein sensors (GαYFP, GβγCFP) should presumably drive a loss in FRET. Unexpectedly, an increase in FRET was observed in some cases, thus revealing that activation of G protein in live cells proceeds via a conformational or dissociational event (see text).
Similarly, CFP- or YFP-labeled G protein subunits are used to record receptor-G proteins interactions, when one of the GFP variants is fused to the receptor at its C termini (36). Upon ligand binding, receptors and G proteins interact and thereby increase FRET (Figs. 2C and 6). In the context of a diffusion-controlled process, the kinetics of protein-protein interaction measured by intramolecular FRET between donor- and acceptor-labeled proteins are dependent on the relative expression levels of donor and acceptor proteins. This is usually the case of receptor-G protein interaction (Fig. 6), where the maximum rate constant (Fig. 6 H) after stimulation by a saturation concentration of ligand is obtained at the highest level of YFP-labeled G protein and a constant level of CFP-labeled receptor (Fig. 6H).
Controls to determine specific RET above bystander RET (nonspecific FRET resulting from random collisions between donor and acceptor fluorophores) are critical to conclude a precoupling between receptor and G protein. Unless an unambiguous control for bystander RET is available and the RET efficiency for a 1:1 interaction is known, a measured RET efficiency above background contains little information. Conversely, dynamic changes of RET signals, such as those induced by receptor activation, are less prone to misinterpretation if the level of protein expression and ratio donor/acceptor are carefully controlled. Therefore RET measurements designed to detect dynamics of protein-protein interactions or conformational changes have proven to be a valuable tool to gain new information about organization and function within signaling networks, as highlighted in this review.
The physiological relevance of new information obtained by FRET approaches may be questioned by the use of recombinant fluorescent fusion proteins expressed at high levels in cultured cells. Therefore, a number of controls and conditions should be performed to test the effect of molecular crowding. First, protein expression can be optimized to ensure low to moderate expression levels of G protein constructs based on Western blot analysis of endogenous and expressed CFP-labeled G proteins using antibodies against the Gα-subunit or fluorescent proteins. Second, overexpression of functional G protein at the inner plasma membrane can be prevented by expressing, for example, GαCFP alone. By preventing exogenous Gβγ overexpression, the endogenous Gβγ-subunits would complement the exogenous GαCFP-subunit and thus limit the level of functional CFP-labeled G proteins to the content of endogenous Gβγ-subunits. Third, for experiments involving the coexpression of, for example, GαYFP + Gβ + GγCFP-subunits, expression conditions can be optimized by ensuring a ≈ 1:1 molar expression ratio of CFP and YFP constructs at moderate expression levels. A control can be the use of a CFP-YFP construct in which the ratio is constrained to 1:1. Fourth, random collision between high levels of fluorescent fusion proteins inevitably results in nonspecific FRET. Therefore, it is critical to differentiate nonspecific from specific FRET by control experiments. For example, the efficiency of energy transfer between a specific receptor-receptor interaction is expected to increase as a hyperbolic function of the level of the acceptor-labeled receptor (Fig. 6, I–K), whereas nonspecific FRET between donor and acceptor molecules gives a linear increase in FRET efficiency (Fig. 6, I–K).
Intramolecular FRET assays have been used to monitor receptor-mediated cAMP propagation by using exchange protein directly activated by cAMP (Epac) fused to GFP variants at their N and C termini. After cAMP binding, Epac undergoes a conformational change, modifying the relative distance/orientation of the GFPs, which decreases FRET (65, 66) (Fig. 2E).
Analyzing the formation of a ternary receptor complex by RET is near to impossible due to the challenge of discriminating the third-order fluorescence, with the attendant transfer inefficiency, from an overwhelming background of the second-order acceptor. Recent studies break the barrier that limited FRET/BRET to two interacting molecules. Both of the solutions reported this year bypass the signal-to-noise problem, using BRET (67) in one case and bimolecular fluorescence compensation in the other (68). Until this year it also was not possible to visualize simultaneously two distinct events with FRET pairs in a single cell, in part due to the lack of convenient red FRET pairs and in part because imaging four separate genetically encoded fluorophores is not feasible with a filter-based fluorescence microscope. The group of Robert Campbell (69) recently reported the application of promising new FRET pairs that permit dual FRET imaging in live cells. Another group in London simultaneously visualized CFP/YFP along with a novel red/far-red FRET pair using conventional FRET to visualize CFP and YFP-FRET and fluorescence lifetime imaging microscopy (FLIM) analysis of the red donor (70). It is important to note that combined FRET and FRET-FLIM is a technically challenging approach that may limit its widespread use; by contrast, the advances in spectral imaging may allow directly visualizing the emission spectra of all four fluorophores (71) and permit the detection of simultaneous events along the signaling cascade of a GPCR.
Acknowledgments
J.-P.V. thanks Peter Friedman and Dennis Brown for thoughtful comments.
Footnotes
This work was supported by start up funds from the Department of Medicine, Massachusetts General Hospital, and the Department of Pharmacology and Chemical Biology, University of Pittsburgh (to J.P.V.).
Disclosure Summary: The authors have nothing to declare.
First Published Online February 5, 2009
Abbreviations: AR, Adrenergic receptor; BRET, bioluminescence resonance energy transfer; CFP, cyan fluorescent protein; Epac, exchange protein directly activated by cAMP; FlAsH, fluorescein arsenical hairpin binder; FRAP, fluorescence recovery after photobleaching; FRET, Förster resonance energy transfer; GIRK, G protein-regulated inward rectifier potassium channels; GPCR, G protein-coupled receptor; 5-HT, 5-hydroxytryptamine; PTHR, PTH receptor; RET, resonance energy transfer; TMR, tetramethyl-rhodamine; YFP, yellow fluorescent protein.
References
- 1.Palczewski K, Kumasaka T, Hori T, Behnke CA, Motoshima H, Fox BA, Le Trong I, Teller DC, Okada T, Stenkamp RE, Yamamoto M, Miyano M2000. Crystal structure of rhodopsin: a G protein-coupled receptor. Science 289:739–745 [DOI] [PubMed] [Google Scholar]
- 2.Rosenbaum DM, Cherezov V, Hanson MA, Rasmussen SG, Thian FS, Kobilka TS, Choi HJ, Yao XJ, Weis WI, Stevens RC, Kobilka BK GPCR engineering yields high-resolution structural insights into β2-adrenergic receptor function. Science 318:1266–1273 [DOI] [PubMed] [Google Scholar]
- 3.Bourne HR, Sanders DA, McCormick F1991. The GTPase superfamily: conserved structure and molecular mechanism. Nature 349:117–127 [DOI] [PubMed] [Google Scholar]
- 4.Wettschureck N, Offermanns S2005. Mammalian G proteins and their cell type specific functions. Physiol Rev 85:1159–1204 [DOI] [PubMed] [Google Scholar]
- 5.Tao YX2006. Inactivating mutations of G protein-coupled receptors and diseases: structure-function insights and therapeutic implications. Pharmacol Ther 111:949–973 [DOI] [PubMed] [Google Scholar]
- 6.Seifert R, Wenzel-Seifert K2002. Constitutive activity of G protein-coupled receptors: cause of disease and common property of wild-type receptors. Naunyn Schmiedebergs Arch Pharmacol 366:381–416 [DOI] [PubMed] [Google Scholar]
- 7.Schöneberg T, Schulz A, Biebermann H, Hermsdorf T, Rompler H, Sangkuhl K2004. Mutant G protein-coupled receptors as a cause of human diseases. Pharmacol Ther 104:173-206 [DOI] [PubMed] [Google Scholar]
- 8.Schipani E, Kruse K, Jüppner H1995. A constitutively active mutant PTH-PTHrP receptor in Jansen-type metaphyseal chondrodysplasia. Science 268:98–100 [DOI] [PubMed] [Google Scholar]
- 9.Dorsam RT, Gutkind JS2007. G protein-coupled receptors and cancer. Nat Rev Cancer 7:79–94 [DOI] [PubMed] [Google Scholar]
- 10.Gether U2000. Uncovering molecular mechanism involved in activation of G protein-coupled receptor. Endocr Rev 21:90–113 [DOI] [PubMed] [Google Scholar]
- 11.Farrens DL, Altenbach C, Yang K, Hubbell WL, Khorana HG1996. Requirement of rigid body motion of transmembrane helices for light activation of rhodopsin. Science 274:768–770 [DOI] [PubMed] [Google Scholar]
- 12.Sheik SP, Zvyaga TA, Lichtarge O, Sakmar TO, Bourne HR1996. Rhodopsin activation blocked by metal-ion-binding sites linking transmembrane helices C and F. Nature 383:347–350 [DOI] [PubMed] [Google Scholar]
- 13.Sheikh SP, Vilardarga J-P, Baranski TJ, Lichtarge O, Iiri T, Meng EC, Nissenson RA, Bourne HR1999. Similar structures and shared switch mechanisms of the β2-adrenoceptor and the parathyroid hormone receptor. J Biol Chem 274:17033–17041 [DOI] [PubMed] [Google Scholar]
- 14.Yao K, Parnot C, Deupi X, Ratnala VRP, Swaminath G, Farrens D, Kobilka BK2006. Coupling ligand structure to specific conformational switches in the β2-adrenoceptor. Nat Chem Biol 2:417–422 [DOI] [PubMed] [Google Scholar]
- 15.Hoffmann C, Zürn A, Bünemann M, Lohse MJ2008. Conformational changes in G-protein-coupled receptors- the quest for functionally selective conformations is open. Br J Pharmacol 153:S358–S366 [DOI] [PMC free article] [PubMed]
- 16.Vilardaga J-P, Bünemann M, Krasel C, Castro M, Lohse MJ2003. A millisecond activation switch for G protein-coupled receptors in living cells. Nat Biotechnol 21:807–812 [DOI] [PubMed] [Google Scholar]
- 17.Hoffmann C, Gaietta G, Bunemann M, Adams SR, Oberdorff-Maass S, Behr B, Vilardaga J-P, Tsien RY, Ellisman MH, Lohse MJ2005. A FlAsH-based FRET approach to determine G protein-coupled receptor activation in living cells. Nat Methods 2:171–176 [DOI] [PubMed] [Google Scholar]
- 18.Rochais F, Vilardaga J-P, Nikolaev VO, Bunemann M, Lohse MJ, Engelhardt S2007. Real-time optical recording of β1-adrenergic receptor activation reveals supersensitivity of the Arg389 variant to carvedilol. J Clin Invest 117:229–235 [DOI] [PMC free article] [PubMed] [Google Scholar]
- 19.Castro M, Nikolaev VO, Palm D, Lohse MJ, Vilardaga J-P 2005. Proc Natl Acad Sci USA 102:16084–16089 [DOI] [PMC free article] [PubMed] [Google Scholar]
- 20.Sexton PM, Morfis M, Tilakaratne N, Hay DL, Udawela M, Christopoulos G, Christopoulos A2006. Complexing receptor pharmacology. Modulation of family B G protein-coupled receptor function by RAMPs. Ann NY Acad Sci 1070:90–104 [DOI] [PubMed] [Google Scholar]
- 21.Weinman EJ, Hall RA, Friedman PA, Liu-Chen LY, Shenolikar S2006. The association of NHERF adaptor proteins with G protein-coupled receptors and tyrosine kinases. Annu Rev Physiol 68:491–505 [DOI] [PubMed] [Google Scholar]
- 22.Monod J, Wyman J, Changeux JP1965. On the nature of allosteric transitions: a plausible model. J Mol Biol 12:88–112 [DOI] [PubMed] [Google Scholar]
- 23.Koshland Jr DE, Nemethy G, Filmer D1966. Comparison of experimental binding data and theoretical models in proteins containing subunits. Biochemistry 5:365–385 [DOI] [PubMed] [Google Scholar]
- 24.Swaminath G, Xiang Y, Lee TW, Steenhuis J, Parnot C, Kobilka BK2004. Sequential binding of agonists to the β2-adrenoceptor. Kinetic evidence for intermediate conformational states. J Biol Chem 279:686–691 [DOI] [PubMed] [Google Scholar]
- 25.Swaminath G, Deupi X, Lee TW, Zhu W, Thian FS, Kobilka TS, Kobilka B2005. Probing the β2-adrenoceptor binding site with catechol reveals differences in binding and activation by agonists and partial agonists. J Biol Chem 280:22165–22171 [DOI] [PubMed] [Google Scholar]
- 26.Banères JL, Mesnier D, Martin A, Joubert L, Dumuis A, Bockaert J2005. Molecular charaterization of a purified 5-HT4 receptor. A structural basis for drug efficacy. J Biol Chem 280:20253–20260 [DOI] [PubMed] [Google Scholar]
- 27.Vilardaga J-P, Steinmeyer R, Harms G, Lohse MJ2005. Molecular basis of inverse agonism in a G protein-coupled receptor. Nat Chem Biol 1:25–28 [DOI] [PubMed] [Google Scholar]
- 28.Nikolaev OV, Hoffmann C, Bünemann M, Lohse MJ, Vilardaga J-P2006. Molecular basis of partial agonism at the neurotransmitter α2A-adrenergic receptor and Gi-protein heterotrimer. J Biol Chem 281:24506–24511 [DOI] [PubMed] [Google Scholar]
- 29.β-Blockers Evaluation of Survival Trial Investigators2001. A trial of the β-blocker bucindolol in patients with advanced chronic heart failure. N Engl J Med 344:1659–1667 [DOI] [PubMed] [Google Scholar]
- 30.Bristow MR2000. β-Adrenergic receptor blockade in chronic heart failure. Circulation 101:558–569 [DOI] [PubMed] [Google Scholar]
- 31.Tolkovsky AM, Levitzki A1978. Mode of coupling between the β-adrenergic receptor and adenylate cyclase in turkey erythrocytes. Biochemistry 17:3795. [DOI] [PubMed] [Google Scholar]
- 32.Bünemann M, Bücheler MM, Philipp M, Lohse MJ, Hein L2001. Activation and deactivation kinetics of α 2A- and α 2C-adrenergic receptor-activated G protein-activated inwardly rectifying K+ channel currents. J Biol Chem 276:47512–47517 [DOI] [PubMed] [Google Scholar]
- 33.Tian WN, Duzic E, Lanier SM, Deth RC1994. Determinants of α 2-adrenergic receptor activation of G proteins: evidence for a precoupled receptor/G protein state. Mol Pharmacol 45:524–531 [PubMed] [Google Scholar]
- 34.Roka F, Brydon L, Waldhoer M, Strosberg AD, Freissmuth M, Jockers R, Nanoff C1999. Tight association of the human Mel(1a)-melatonin receptor and G(i): precoupling and constitutive activity. Mol Pharmacol 56:1014–1024 [DOI] [PubMed] [Google Scholar]
- 35.Frances B, Puget A, Moisand C, Meunier JC1990. Apparent precoupling of κ- but not μ-opioid receptors with a G protein in the absence of agonist. Eur J Pharmacol 189:1–9 [DOI] [PubMed] [Google Scholar]
- 36.Hein P, Frank M, Hoffmann C, Lohse MJ, Bünemann M2005. Dynamics of receptor/G protein coupling in living cells. EMBO J 24:4106–4114 [DOI] [PMC free article] [PubMed] [Google Scholar]
- 37.Wellner-Kienitz MC, Bender K, Meyer T, Bünemann M, Pott L2000. Overexpressed A(1) adenosine receptors reduce activation of acetylcholine-sensitive K(+) current by native muscarinic M(2) receptors in rat atrial myocytes. Circ Res 86:643–648 [DOI] [PubMed] [Google Scholar]
- 38.Qin K, Sethi PR, Lambert NA2008. Abundance and stability of complexes containing inactive G protein-coupled receptors and G proteins. FASEB J 22:2920–2927 [DOI] [PMC free article] [PubMed] [Google Scholar]
- 39.Nobles M, Benians A, Tinker A2005. Heterotrimeric G proteins precouple with G protein-coupled receptors in living cells. Proc Natl Acad Sci USA 102:18706–18711 [DOI] [PMC free article] [PubMed] [Google Scholar]
- 40.Gales C, Rebois RV, Hogue M, Trieu P, Breit A, Hebert TE, Bouvier M2005. Real-time monitoring of receptor and G protein interactions in living cells. Nat Methods 2:177–184 [DOI] [PubMed] [Google Scholar]
- 41.Ayoub MA, Maurel C, Binet V, Fink M, Prezeau L, Ansanay H, Pin JP2007. Real-time analysis of agonist-induced activation of protease-activated receptor 1/Gαi1 protein complex measured by BRET in living cells. Mol Pharmacol 71:1329–1340 [DOI] [PubMed] [Google Scholar]
- 42.Dupre DJ, Robitaille M, Ethier N, Villeneuve LR, Mamarbachi AM, Hebert TE2006. Seven transmembrane receptor core signaling complexes are assembled prior to plasma membrane trafficking. J Biol Chem 281:34561–34573 [DOI] [PubMed] [Google Scholar]
- 43.Philip F, Sengupta P, Scarlata S2007. Signaling through a G protein coupled receptor and its corresponding G protein follows a stoichiometrically limited model. J Biol Chem 282:19203–19216 [DOI] [PubMed] [Google Scholar]
- 44.Andressen KW, Norum JH, Levy FO, Krobert KA2006. Activation of adenylyl cyclase by endogenous G(s)-coupled receptors in human embryonic kidney 293 cells is attenuated by 5-HT(7) receptor expression. Mol Pharmacol 269:207–215 [DOI] [PubMed] [Google Scholar]
- 45.Hamm HE1998. The many faces of G protein signaling. J Biol Chem 273:669–672 [DOI] [PubMed] [Google Scholar]
- 46.Sadja R, Alagem N, Reuveny E2003. Gating of GIRK channels: details of an intricate, membrane-delimited signaling complex. Neuron 39:9–12 [DOI] [PubMed] [Google Scholar]
- 47.Janetopoulos C, Jin T, Devreotes P2001. Receptor-mediated activation of heterotrimeric G proteins in living cells. Science 291:2408–2411 [DOI] [PubMed] [Google Scholar]
- 48.Yi TM, Kitano H, Simon MI2003. A quantitative characterization of the yeast heterotrimeric G protein cycle. Proc Natl Acad Sci USA 100:10764–10769 [DOI] [PMC free article] [PubMed] [Google Scholar]
- 49.Bünemann M, Frank M, Lohse MJ2003. Gi protein activation in intact cells involves subunit rearrangement rather than dissociation. Proc Natl Acad Sci USA 100:16077–16082 [DOI] [PMC free article] [PubMed] [Google Scholar]
- 50.Frank M, Thümer L, Lohse MJ, Bünemann M2005. G protein activation without subunit dissociation depends on a Gα(i)-specific region. J Biol Chem 280:24584–24590 [DOI] [PubMed] [Google Scholar]
- 51.Azpiazu I, Gautam N2004. A fluorescence resonance energy transfer-based sensor indicates that receptor access to a G protein is unrestricted in a living mammalian cell. J Biol Chem 279:27709–27718 [DOI] [PubMed] [Google Scholar]
- 52.Gibson SK, Gilman AG2006. Giα and Gβ subunits both define selectivity of G protein activation by α2-adrenergic receptors. Proc Natl Acad Sci USA 103:212–217 [DOI] [PMC free article] [PubMed] [Google Scholar]
- 53.Gales C, Van Durm JJ, Schaak S, Pontier S, Percherancier Y, Audet M, Paris H, Bouvier M2006. Probing the activation-promoted structural rearrangements in preassembled receptor-G protein complexes. Nat Struct Mol Biol 9:778–786 [DOI] [PubMed] [Google Scholar]
- 54.Digby GJ, Lober RM, Sethi PR, Lambert NA2006. Some G protein heterotrimers physically dissociate in living cells. Proc Natl Acad Sci USA 103:17789–17794 [DOI] [PMC free article] [PubMed] [Google Scholar]
- 55.Akgoz M, Kalyanaraman V, Gautam N2004. Receptor-mediated reversible translocation of the G protein βγ complex from the plasma membrane to the Golgi complex. J Biol Chem 279:51541–51544 [DOI] [PubMed] [Google Scholar]
- 56.Azpiazu I, Akgoz M, Kalyanaraman V, Gautam N2006. G protein βγ11 complex translocation is induced by Gi, Gq and Gs coupling receptors and is regulated by the α subunit type. Cell Signal 18:1190–1200 [DOI] [PMC free article] [PubMed] [Google Scholar]
- 57.Digby GJ, Sethi PR, Lambert NA2008. Differential dissociation of G protein heterotrimers. J Physiol 586:3325–3335 [DOI] [PMC free article] [PubMed] [Google Scholar]
- 58.Perrin J1932. Théorie quantique des transferts d'activation entre molécules de même espèce. Cas des solutions fluorescentes. Ann Chim Phys 17:283–313 [Google Scholar]
- 59.Förster T1948. Zwischenmolekulare Energiewanderung und Fluoreszenz. Ann Physik (Leipzig) 2:55–75 [Google Scholar]
- 60.Selvin PR1995. Fluorescence resonance energy transfer. Methods Enzymol 246:300–334 [DOI] [PubMed] [Google Scholar]
- 61.Miyawaki A, Tsien R2000. Monitoring protein conformations and interactions by fluorescence resonance energy transfer between mutants of green fluorescent protein. Methods Enzymol 327:472–501 [DOI] [PubMed] [Google Scholar]
- 62.Takanishi CL, Bykova EA, Cheng W, Zheng J2006. GFP-based FRET analysis in live cells. Brain Res 1091:132–139 [DOI] [PubMed] [Google Scholar]
- 63.Palanche T, Ilien B, Zoffmann S, Reck MP, Bucher B, Edelstein SJ, Galzi JL2001. The neurokinin A receptor activates calcium and cAMP responses through distinct conformational states. J Biol Chem 276:34853–34861 [DOI] [PubMed] [Google Scholar]
- 64.Lisenbee CS, Harikumar KG, Miller LJ2007. Mapping the architecture of secretin receptors with intramolecular FRET using AOTF-based spectral imaging. Mol Endocrinol 21:1997–2008 [DOI] [PubMed] [Google Scholar]
- 65.Nikolaev VO, Bünemann M, Hein L, Hannawacker A, Lohse MJ2004. Novel single chain cAMP sensors for receptor-induced signal propagation. J Biol Chem 279:37215–37218 [DOI] [PubMed] [Google Scholar]
- 66.Nikolaev VO, Lohse MJ2006. Monitoring of cAMP synthesis and degradation in living cells. Physiology 21:86–92 [DOI] [PubMed] [Google Scholar]
- 67.Carriba P, Navarro G, Ciruela F, Ferré S, Casadó V, Agnati L, Cortés A, Mallol J, Fuxe K, Canela EI, Lluís C, Franco R2008. Detection of heteromerization of more than two proteins by sequential BRET-FRET. Nat Methods 5:727–733 [DOI] [PubMed] [Google Scholar]
- 68.Shyu YJ, Suarez CD, Hu CD2008. Visualization of ternary complexes in living cells by using a BiFC-based FRET assay. Nat Protoc 3:1693–1702 [DOI] [PubMed] [Google Scholar]
- 69.Ai H-W, Hazelwood KL, Davidson MW, Campbell RE2008. Fluorescent protein FRET pairs for ratiometric imaging of dual biosensors. Nat Methods 4:401–403 [DOI] [PubMed] [Google Scholar]
- 70.Grant DM, Zhang W, McGhee EJ, Bunney TD, Talbot CB, Kumar S, Munro I, Dunsby C, Neil MA, Katan M, French PM2008. Multiplexed FRET to image multiple signaling events in live cells. Biophys J 95:L69–L71 [DOI] [PMC free article] [PubMed]
- 71.Vermaas WF, Timlin JA, Jones HD, Sinclair MB, Nieman LT, Hamad SW, Melgaard DK, Haaland DM2008. In vivo hyperspectral confocal fluorescence imaging to determine pigment localization and distribution in cyanobacterial cells. Proc Natl Acad Sci USA 105:4050–4055 [DOI] [PMC free article] [PubMed] [Google Scholar]
- 72.Vilardaga J-P, Nikolaev VO, Lorenz K, Ferrandon S, Zhuang Z, Lohse MJ2008. Conformational cross-talk between α2A-adrenergic and m-opioid receptors controls cell signalling. Nat Chem Biol 4:126–131 [DOI] [PubMed] [Google Scholar]