

Abstract
Eukaryotic cells sense extracellular glucose concentrations via diverse mechanisms to regulate the expression of genes involved in metabolic control. One such example is the tight correlation between the expression of thioredoxin-interacting protein (Txnip) and extracellular glucose levels. In this report, we show that the transcription of the Txnip gene is induced by adenosine-containing molecules, of which an intact adenosine moiety is necessary and sufficient. Txnip promoter contains a carbohydrate response element, which mediates the induction of Txnip expression by these molecules in a glucose-dependent manner. Max-like protein X and MondoA are transcription factors previously shown to stimulate glucose-dependent Txnip expression and are shown here to convey stimulatory signals from extracellular adenosine-containing molecules to the Txnip promoter. The regulatory role of these molecules may be exerted via amplifying glucose signaling. Hence, this revelation may pave the way for interventions aimed toward metabolic disorders resulting from abnormal glucose homeostasis.
Adenosine-containing molecules induce Txnip expression via a carbohydrate response element (ChoRE) and the ChoRE-associated transcription factors MondoA and MLX in a glucose dependent manner.
Thioredoxin interacting protein (Txnip, also known as VDUP1 and TBP-2) is known for its ability to bind and inhibit the activity of thioredoxin (1, 2, 3), an important cellular reducing agent (4). This implies a role for Txnip in sustaining a proper cellular redox state. Txnip is multifunctional given that it is involved in cell proliferation and differentiation (5, 6, 7, 8, 9, 10) and is a critical molecule in metabolic homeostasis (11).
Txnip-null mice exhibit reduced hepatic glucose production (12) and a robust increase in myocardial glucose uptake (13). The latter is consistent with the inhibitory role of Txnip on glucose uptake in peripheral tissues (14). Txnip deficiency is also associated with reduced fatty acid utilization (15). The above factors may contribute to hypoglycemia, hyperlipidemia, and other metabolic abnormalities observed in Txnip-null mice or mice with a nonsense Txnip mutation (16, 17, 18, 19). In the pancreas, Txnip induces the apoptosis of β-cells (20, 21), which are master regulators for glucose homeostasis via their production of insulin. In muscles of diabetic or prediabetic patients, Txnip expression is elevated (14). Moreover, Txnip can modulate the activities of peroxisome proliferator-activated receptor, phosphatase and tensin homolog, and protein kinase B (PKB, also known as AKT) (22, 23, 24), which are important in growth and metabolic signaling. These reports suggest that Txnip is important in the metabolic regulation of glucose and lipids.
Txnip expression is tightly correlated with extracellular glucose concentration. Glucose-induced Txnip expression is in turn mediated by a protein complex of MondoA and Max-like protein X (MLX) (20, 25, 26); this complex might sense intracellular glucose-6-phosphate (G6P) levels and migrate between mitochondria and the nucleus. The nuclear MondoA-MLX complex interacts with the carbohydrate response element (ChoRE) on the Txnip promoter, inducing Txnip expression (26).
Txnip expression is downstream of a number of other physiological signals, in that it is inhibited by insulin (14) and stimulated by glucocorticoid (27), vitamin D (1), peroxisome proliferator-activated receptor-γ agonist (28), and certain stress-related molecules (29). Given that the Txnip expression is related to a diverse number of cellular functions, the identification of molecules that can modulate Txnip expression has important clinical relevance.
Here we show that Txnip expression is induced by a class of adenosine-containing molecules, and this induction is achieved by amplifying the glucose signaling pathway. This revelation may form the basis for developing pharmacological interventions or modulations of certain cellular processes in which glucose plays a fundamental role.
Results
Adenosine-containing molecules stimulate Txnip expression
In a screen for small molecules that impact Txnip expression, we identified nicotinamide adenine dinucleotide (reduced) [NAD(H)] and ATP as compounds that could dramatically increase Txnip mRNA levels in HeLa cells (Fig. 1A). As quantified with real-time PCR, cells exhibited greater than 4-fold increase in Txnip mRNA levels when treated with 0.1 mm NAD(H) or ATP for 4 h (Fig. 1B). As expected, increased Txnip protein levels were also observed in cells treated with NAD+ or ATP (data not shown). This induction may be a ubiquitous phenomenon, because similar results were observed in diverse mammalian cell lines such as HeLa, U2OS, WI-38, HepG2, C2C12, 293, Namalwa B, and Jurkat T cells (Fig. 1B).
Fig. 1.

NAD(H) or ATP induces Txnip mRNA expression. A, HeLa cells were treated with 0.1 mm NAD+, NADH, or ATP for 4 h or left untreated, and the Txnip mRNA levels were measured by RT-PCR. B, Txnip expression was induced by 0.1 mm NAD(H) or ATP (4 h) in diverse cell lines, and Txnip mRNA levels were scored by real-time PCR. Treated samples were compared with untreated samples; n = 2. *, P < 0.05.
Given that NAD(H) and ATP share an adenosine group, other adenosine-containing molecules were then evaluated. HeLa cells incubated with NADP(H), ADP, ADP-ribose, flavin adenine dinucleotide (FAD), AMP, and adenosine similarly exhibited enhanced Txnip expression as observed in the NAD(H)- or ATP-treated cells (Table 1).
Table 1.
The effects of different molecules on Txnip mRNA levels (0.1 mm, 4-h treatment)
| Molecule | Fold ± sd |
|---|---|
| Stimulatory | |
| NAD+ | 4.81 ± 0.272 |
| NADH | 4.85 ± 0.212 |
| NADP+ | 4.70 ± 0.282 |
| NADPH | 4.65 ± 0.352 |
| α-NAD | 4.32 ± 0.401 |
| FAD | 4.38 ± 0.322 |
| ATP | 4.55 ± 0.641 |
| ATPγS | 4.20 ± 0.421 |
| ADP | 5.00 ± 0.711 |
| ADP-ribose | 4.53 ± 0.671 |
| AMP | 4.75 ± 0.362 |
| 3′-AMP | 5.05 ± 0.491 |
| 2′-AMP | 4.77 ± 0.661 |
| cAMP | 4.70 ± 0.991 |
| AMPS | 4.65 ± 0.212 |
| Adenosine | 4.38 ± 0.451 |
| Nonstimulatory | |
| Ethano-NAD | 1.05 ± 0.07 |
| NGD | 1.03 ± 0.18 |
| FMN | 0.95 ± 0.21 |
| NMN | 1.14 ± 0.12 |
| CTP | 0.90 ± 0.14 |
| TTP | 0.70 ± 0.28 |
| UTP | 0.70 ± 0.42 |
| Bz-ATP | 1.35 ± 0.35 |
| Tnp-ATP | 1.77 ± 0.37 |
| dATP | 1.85 ± 0.49 |
| dCTP | 1.00 ± 0.14 |
| dTTP | 0.65 ± 0.21 |
| dGTP | 0.76 ± 0.22 |
| dUTP | 0.73 ± 0.25 |
| IDP | 0.90 ± 0.14 |
| Adenine | 1.84 ± 0.34 |
All values in the nonstimulatory group were statistically insignificant. Water, dimethylsulfoxide, or HEPES buffer (20 mm; pH 5.4 or pH 8.4) used as solvent did not show any significant effect on Txnip expression. Bz, Benzoylbenzoyl; Tnp, trinitrophenyl.
P < 0.05.
P < 0.005.
Adenosine is necessary and sufficient for inducing Txnip expression
The above results (Fig. 1 and Table 1) suggest that an adenosine moiety is sufficient for the induction of Txnip expression; we next tested whether the adenosine moiety is necessary for this induction. Ethano-NAD, nicotinamide guanine dinucleotide, flavin mononucleotide, CTP, uridine 5′-triphosphate (UTP), thymidine 5′-triphosphate, GTP, or inosine-5′-diphosphate, did not induce Txnip expression (Table 1). These molecules share structural similarities with NAD(H), FAD, ATP, or ADP; however, their base groups are distinct from adenine, which in turn was not effective by itself (Table 1). This result indicates that the base component of the adenosine group is essential but not sufficient, which led us to examine the ribose component by using AMP and ATP analogs that differ from AMP or ATP at the ribose moiety.
cAMP, 3′-AMP, and 2′-AMP stimulated Txnip expression to a similar degree as 5′-AMP; however, ATP analogs with the ribose modified by bulky groups such as benzoylbenzoyl ATP and trinitrophenyl ATP or with a deoxidized ribose, dATP, showed marginal effects (Table 1). Thus, an adenosine moiety (adenine and ribose) is required and sufficient for inducing Txnip expression, which tolerates phosphate groups but not bulky modifications or deoxidization at the ribose (−OH positions).
The above results in Fig. 1 and Table 1 represent observations in cells treated with 0.1 mm of various compounds (for 4 h). We also examined the effective dosage range of a selective set of adenosine-containing molecules in inducing Txnip expression. As shown in Fig. 2A, 0.025 mm NAD(H) was sufficient for maximal induction, and up to 2.5 mm of NAD(H) remained stimulatory; on the other hand, NADP(H) stimulated Txnip expression at low concentrations, and its effect diminished at 0.625 mm or above. Adenosine, AMP, ADP, and ATP exerted their optimal effects on the Txnip expression at 0.125 mm; AMP, but not adenosine, ADP, or ATP, sustained the induction at higher dosages (Fig. 2B). These results suggest that the negative charges (phosphate group) around the ribose moiety can affect the efficacies of adenosine-containing molecules on inducing Txnip expression.
Fig. 2.
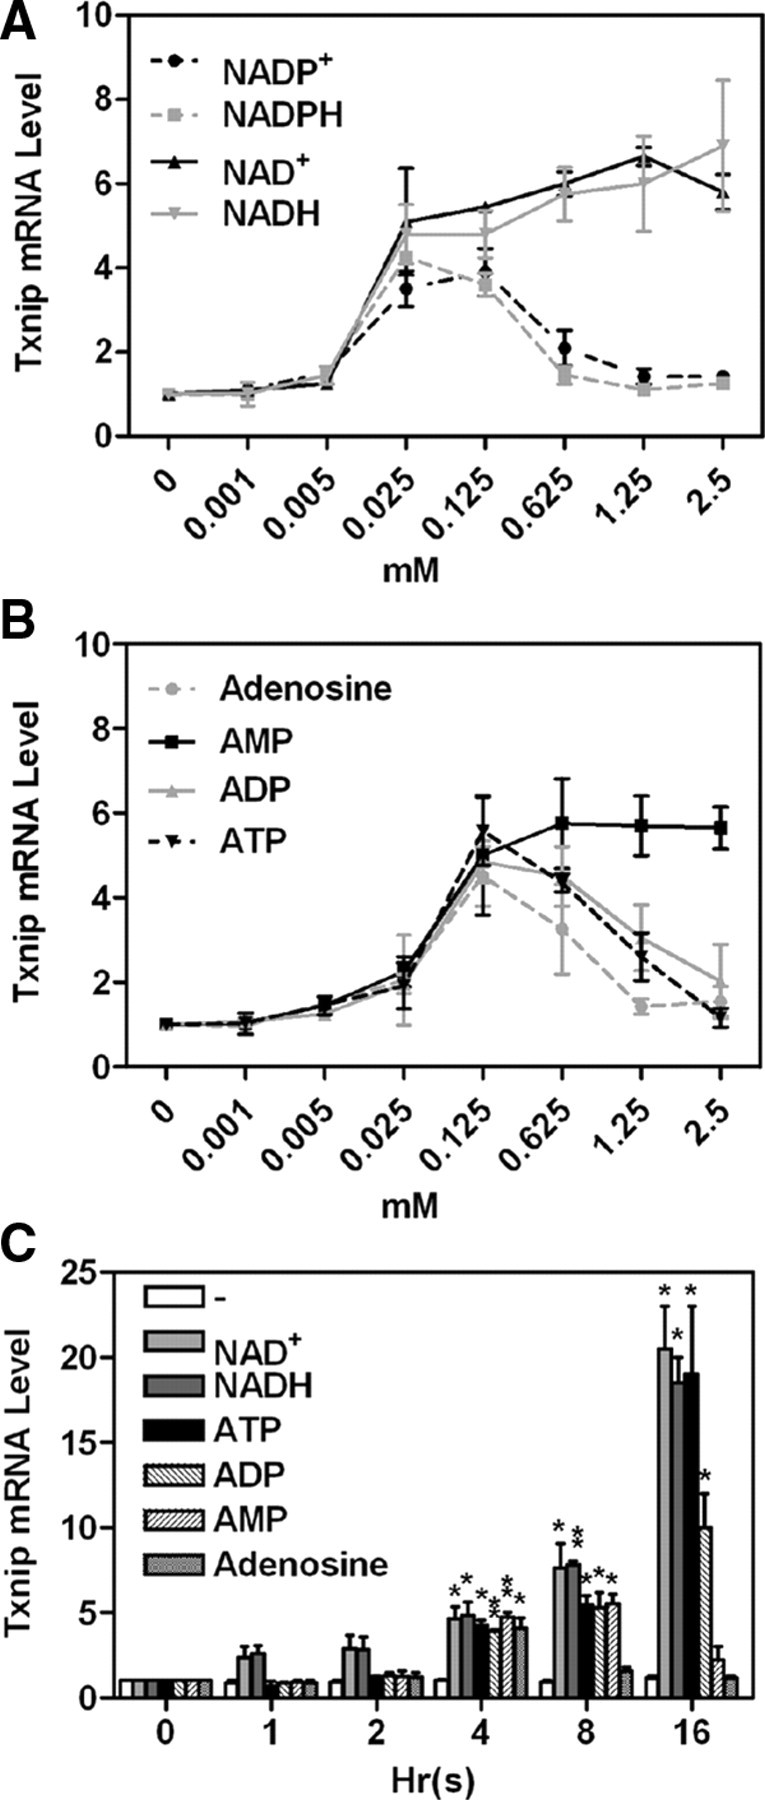
Titrations (A and B; 4 h) and time course (C; 0.1 mm) of adenosine-containing molecules on Txnip mRNA expression. Treated samples were compared with untreated samples; n = 2. *, P < 0.05; **, P < 0.005.
When examining the time course of the induction of Txnip expression, we found that all tested adenosine-containing molecules exhibited about 4-fold stimulatory effects at 4 h, although their long-term effects varied greatly (Fig. 2C). At 8 h, although NAD+, NADH, ATP, ADP, and AMP exhibited an approximately 8-fold induction, the effect of adenosine became insignificant. At 16 h, NAD+, NADH, and ATP dramatically induced Txnip expression (∼20-fold); however, the effect of ADP was moderate, and those of AMP and adenosine were marginal. This indicates that, although all stimulatory, the above adenosine-containing compounds are able to exhibit different kinetics on Txnip expression.
Adenosine-containing molecules stimulate Txnip expression at the transcriptional level
To test whether Txnip up-regulation was at the transcription level, we examined the effects of adenosine-containing molecules on the expression of an ectopic Txnip promoter (fused to a luciferase reporter). All tested adenosine-containing molecules, with the exception of adenosine, induced the reporter activity (Fig. 3). In this reporter assay, 16 h was used to manifest the luciferase activities. Thus, the marginal effect of adenosine on the Txnip promoter activity (Fig. 3) may be explained by the uptake and metabolism of extracellular adenosine by cells over 16 h. Indeed, cells transfected with the reporter and treated with fresh adenosine-containing medium at 4-h intervals exhibited a significant induction of the promoter activity (Fig. 3, white bars). Other molecules lacking an intact adenosine group, e.g. nicotinamide guanine dinucleotide, flavin mononucleotide, thymidine 5′-triphosphate, and adenine, failed to stimulate the transcription from the Txnip promoter (Fig. 3). This observation is in agreement with the earlier specified requirement for an intact adenosine moiety (Table 1).
Fig. 3.

Adenosine-containing molecules induce Txnip promoter activity. After transfection, Txnip promoter activity was measured after 16-h treatments with 0.2 mm of different adenosine-containing molecules (for white bars, medium was changed every 4 h). Treated samples were compared with untreated samples; n = 2 for black bars, and n = 3 for white bars, respectively. *, P < 0.05; **, P < 0.005.
In cells treated with actinomycin D, which inhibits transcription of all cellular genes, the induction of Txnip expression by NAD+, ATP, or adenosine was no longer observed (supplemental Fig. 1, published as supplemental data on The Endocrine Society’s Journals Online web site at http://mend.endojournals. org). This further confirms that adenosine-containing molecules induce the Txnip expression at the transcriptional level.
A ChoRE site mediates the induction of Txnip expression by adenosine-containing molecules
To identify Txnip promoter elements responsible for induction by adenosine-containing molecules, we fused the full-length Txnip promoter (1299 bp upstream of the transcriptional start site) with a luciferase reporter and created a series of deletions (Fig. 4A). When transfected into U2OS cells, the expression of Txnip-luciferase reporter genes with 269 bp or longer promoter sequences exhibited about 4-fold stimulation by NAD+; however, a reporter with 73-bp promoter sequences showed a diminished basal activity (defined here as Txnip promoter activity without adenosine-containing molecules) and failed to respond to NAD+, as did the empty pGL3 vector (Fig. 4B). Given the above, we conclude that the promoter region from −269 to −73 contains the most critical regulatory elements for Txnip transcription and its induction by adenosine-containing molecules.
Fig. 4.

ChoRE mediates Txnip promoter activation by adenosine-containing molecules. A, Serial promoter deletions, ChoRE, and NF-Y and FOXO binding sites are shown. B, Activities of ectopic Txnip promoters or the pGL3 vector in the control or NAD+-treated cells. Numbers on the left refer to promoter lengths (base pairs). Induction folds are indicated on the right. C, Sequences and positions of the wild-type and mutant ChoRE or NF-Y and FOXO binding sites in the Txnip promoter are shown on the left. Stimulatory effects by NAD+ with fold induction are shown on the right. Asterisks indicate comparison between NAD+-treated and untreated samples; n = 2. *, P < 0.05; **, P < 0.005. Diamonds indicate comparison between basal activities of the WT and mutant promoters; n = 2. ♦♦, P < 0.005.
In this region (−269 to −73), we identified binding sites for nuclear factor Y (NF-Y) and forkhead box O (FOXO), and a ChoRE (Fig. 4A). Starting from the construct containing 269 bp of the Txnip promoter sequence (considered wild type and used in Fig. 3), we generated constructs in which the NF-Y or FOXO binding site, or the ChoRE, was mutated (Fig. 4C). The construct with a mutant FOXO binding site demonstrated a similar response as the wild-type promoter (Fig. 4C). The basal activity of the construct with a mutated NF-Y binding site was significantly lower than wild type (similar to an earlier observation) (30), although this test promoter responded to NAD+. In contrast, the ChoRE mutant completely failed to respond to NAD+ (Fig. 4C). Taken together, our results show that the NF-Y binding site is important for maintaining basal transcription levels, whereas the ChoRE mediates the induction of Txnip expression by adenosine-containing molecules.
The induction of Txnip expression by adenosine-containing molecules requires glucose
ChoRE, as the name suggests, is a critical regulatory element that mediates the stimulatory effects of glucose on several genes involved in metabolic control (20, 31). Along with the above results (Fig. 4C), this suggests that glucose may be involved in the induction of Txnip expression by adenosine-containing molecules.
When HeLa cells were cultured in glucose-free medium supplemented with pyruvate as a carbon source, Txnip expression was not stimulated by NAD+ or ATP; however, if cells were freshly fed with glucose, Txnip mRNA levels were dramatically elevated and further induced by NAD+ or ATP (Fig. 5A). A similar induction pattern was also observed when glucose was present throughout (Fig. 5A). The NAD+- or ATP-induced, and ChoRE- and glucose-dependent, Txnip expression was also recapitulated in promoter assays (supplemental Fig. 2).
Fig. 5.
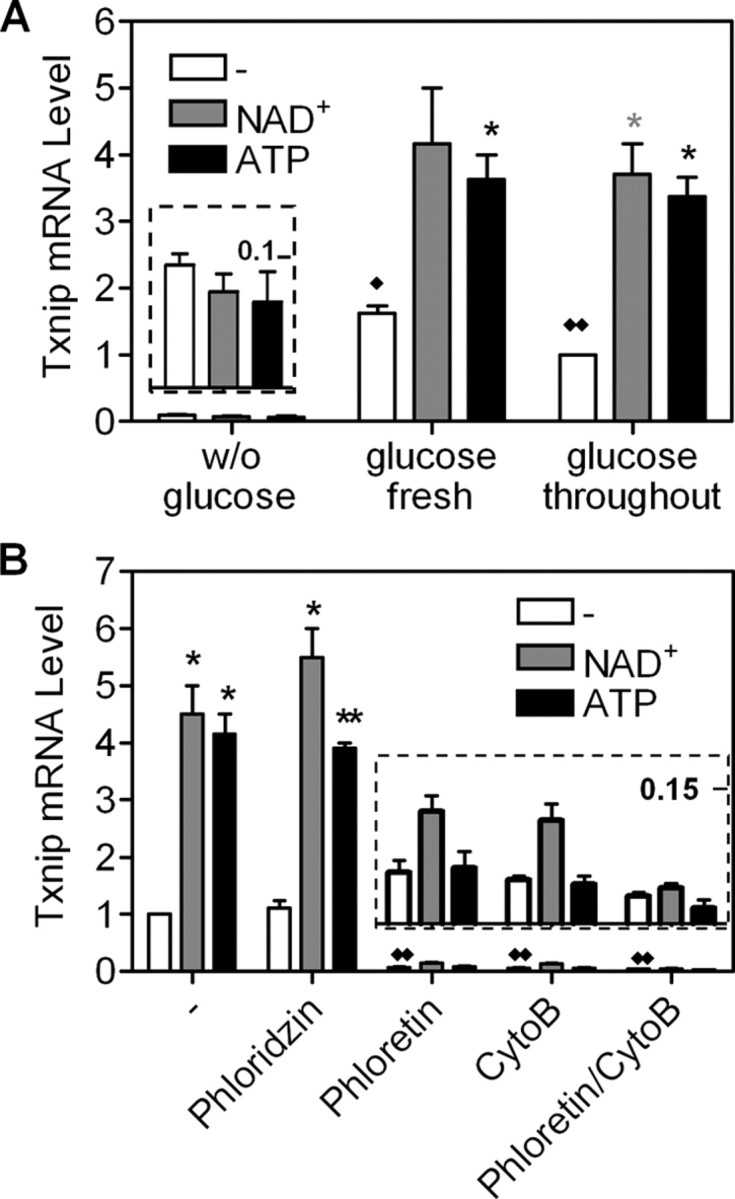
Glucose-dependent induction of Txnip expression by NAD+ or ATP. A, Txnip expression in HeLa cells without or with glucose, NAD+, or ATP. B, Txnip mRNA expression was not induced by NAD+ or ATP in the presence of glucose transporter inhibitors. The insets in A and B are 20- and 15-fold enlargements, respectively, of the images below. Asterisks indicate comparison between NAD+-treated and untreated samples; n = 2. *, P < 0.05; **, P < 0.005. Diamonds indicate comparison between glucose-treated samples and control (without glucose); n = 2. ♦, P < 0.05; ♦♦, P < 0.005.
We also tested whether the cellular glucose uptake system played a role in Txnip expression. Indeed, separately or in combination, phloretin and cytochalasin B, inhibitors of the facilitated glucose transporters (Glut), dramatically repressed the basal and NAD+- or ATP-stimulated Txnip expression; however, phloridzin, an inhibitor of the tissue-restricted Na+/glucose symporters (SGLT), did not exert corresponding effects (Fig. 5B). The presence of glucose and a functional glucose transport system therefore appears to be essential and a prerequisite for the Txnip expression that is inducible by adenosine-containing molecules.
The MLX/MondoA complex mediates the induction of Txnip expression by adenosine-containing molecules
During glucose-induced gene transcription, ChoRE elements can recruit transcription factor complexes, e.g. a tetramer of two molecules each of ChoRE binding protein (ChREBP) and MLX (31, 32, 33, 34, 35, 36). MLX is also able to form a complex with MondoA, a ChREBP homolog (26, 37). Thus, MondoA or ChREBP in association with MLX might be critical in mediating the induction of Txnip expression by adenosine-containing molecules.
To test this out, we first used a dominant-negative MLX mutant, which can block glucose-induced Txnip expression (34). When ectopically expressed in U2OS cells, this mutant diminished the effects of NAD+ or ATP on Txnip promoter activation (supplemental Fig. 3). Thus, the induction of Txnip expression by adenosine-containing molecules requires MLX.
When MLX, ChREBP, or MondoA were ectopically expressed, basal Txnip promoter activity was not significantly induced by MLX or ChREBP, but MondoA induced a more than 10-fold increase (Fig. 6A). When coexpressed with MLX, MondoA and ChREBP increased Txnip promoter activity by more than 30-fold and about 4-fold, respectively; the promoter responded to NAD+ in all cases (Fig. 6A). When coexpressed with the dominant-negative MLX, neither MondoA nor ChREBP supported the basal or NAD+-induced activities of the wild-type Txnip promoter; moreover, the activity of the ChoRE-mutant Txnip promoter (ChoREmut) was not affected by the overexpression of MondoA or coexpression of MLX with MondoA or ChREBP (Fig. 6A).
Fig. 6.
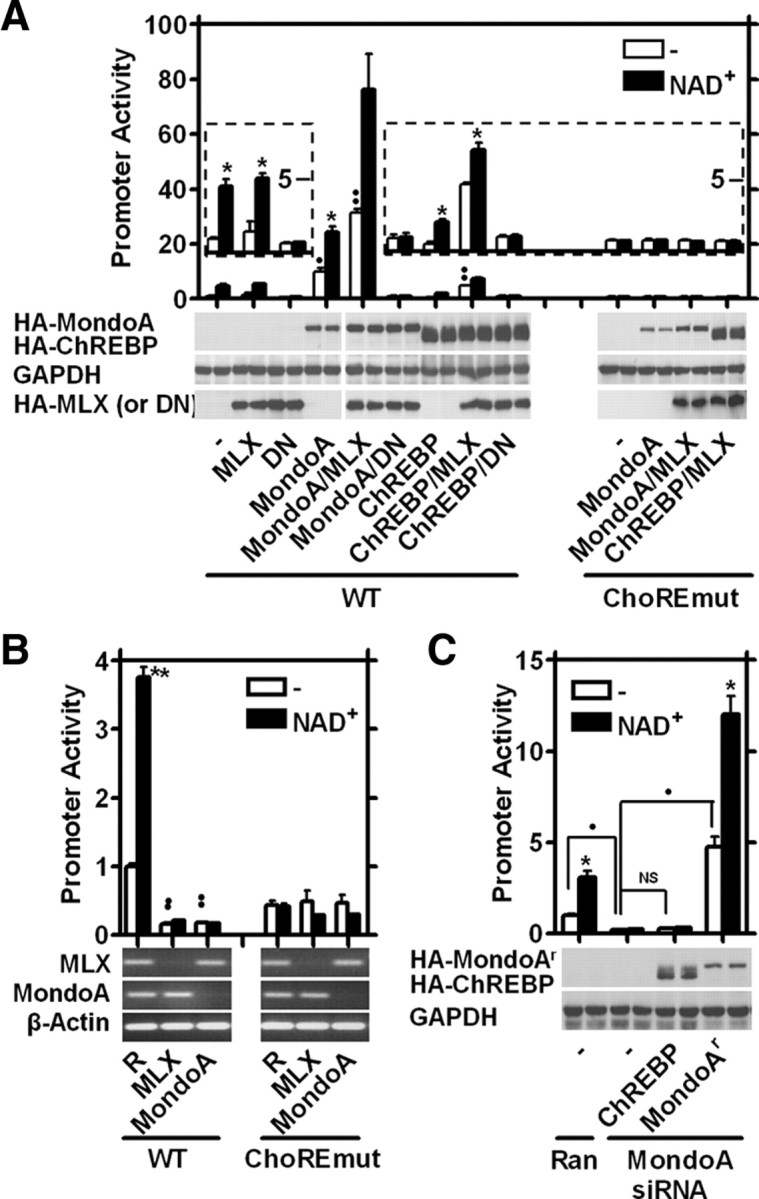
MondoA/MLX is required for the induction of Txnip expression by adenosine-containing molecules. A, Effects of ectopic MLX, dominant-negative MLX (DN), MondoA, or ChREBP on wild-type or ChoRE mutant Txnip promoter activity. The insets are 5-fold augmentation of the images below. B, MLX or MondoA deficiencies (as shown by RT-PCR) down-regulated the wild-type but not the ChoRE mutant Txnip promoter. R, Random (control) siRNA. C, Ectopic MondoAr, but not ChREBP, rescued the Txnip promoter activity in MondoA-deficient cells. Ran, Random siRNA. In A and C, HA-tagged ectopic proteins were detected by anti-HA immunoblots. GAPDH was a loading control. Asterisks indicate comparison between NAD+-treated and untreated samples. *, P < 0.05; **, P < 0.005. Black dots indicate comparison between basal activities (without NAD+); n = 2 (A and C), and n = 4 (B). •, P < 0.05; ••, P < 0.005. NS, Not significant (P ≥ 0.05).
We next employed an RNA interference (RNAi) approach to study the roles of MLX, MondoA, and ChREBP. MLX and MondoA mRNA levels were dramatically repressed in U2OS cells treated with the MLX- or MondoA-specific small interfering RNA (siRNA), respectively. In cells with silenced expression of MLX or MondoA, a strong reduction in the basal and NAD+-induced activities of the wild-type Txnip promoter was observed; however, silencing the MLX or MondoA expression did not impede the ChoRE mutant Txnip promoter activity (Fig. 6B).
Given that ChREBP expression in U2OS cells is extremely low (not shown) and that ectopic ChREBP exhibited a much lower efficacy than did MondoA in a functional assay (Fig. 6A), it is impractical to employ RNAi to study the effects of further reduced ChREBP expression. We generated an RNAi-resistant MondoA (MondoAr) with nucleotide changes at the siRNA target site while retaining a normal peptide sequence and analyzed the functions of ectopic MondoAr and ChREBP in U2OS cells in which the expression of endogenous MondoA was silenced by RNAi. As seen in Fig. 6C, the ectopic MondoAr rescued, boosted, and supported NAD+ in stimulating Txnip promoter activation. In contrast, even with a higher ectopic expression than MondoAr, ChREBP failed to rescue the Txnip promoter activity (Fig. 6C). The above results suggest that the MondoA/MLX complex plays a major role for the ChoRE-dependent induction of Txnip expression by adenosine-containing molecules.
Adenosine-containing molecules facilitate MondoA nuclear translocation and amplify glucose signaling
MondoA and MLX are largely cytoplasmic and likely associated with the outer mitochondrial matrix (26, 37); however, as transcription factors, they need to enter the nucleus to exert stimulatory effects on Txnip expression. This process may be dependent upon cellular G6P (26).
We documented that MLX and MondoA were essential for Txnip induction by adenosine-containing molecules (Fig. 6). As a first step toward obtaining a mechanistic description of the function of these molecules, we asked whether they could exert impact on the subcellular distribution of MondoA. As shown in Fig. 7A, when hemagglutinin (HA)-tagged MondoA was coexpressed with Myc-tagged MLX in L6 cells, NAD+ or glucose alone exerted a marginal effect on the nuclear redistribution of HA-MondoA; however, in the presence of both glucose and NAD+, significantly more cells exhibited nuclear staining of HA-MondoA.
Fig. 7.
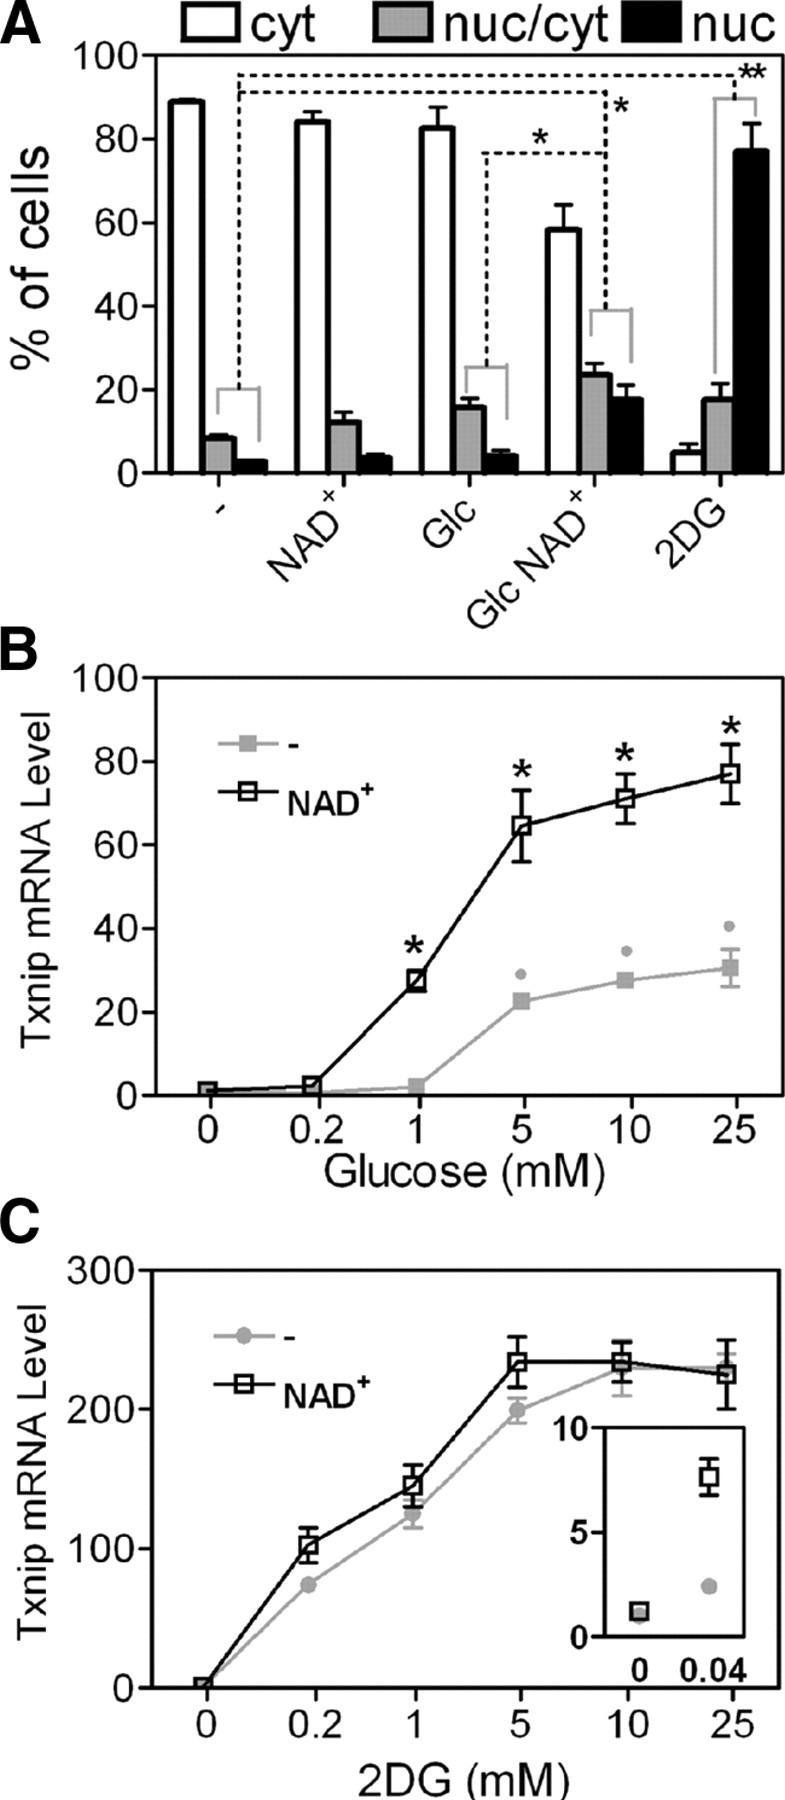
Adenosine-containing molecules facilitate MondoA nuclear translocation and amplify glucose signaling. A, Localization [cytoplasmic (cyt), nuclear (nuc), or heterogeneous (cyt/nuc)] of HA-MondoA in control cells or cells treated with glucose (Glc), 2DG, or NAD+ as indicated. The concentrations of the compounds when used were 10 mm glucose and 2DG and 0.1 mm NAD+ (4-h treatments). B, Txnip mRNA levels in HeLa cells treated with a glucose titration with or without NAD+. Asterisks indicate comparison between NAD+-treated and untreated samples. *, P < 0.05; **, P < 0.005. Gray dots indicate comparisons between glucose-treated and control (without glucose) samples; n = 2; P < 0.05. C, Txnip mRNA levels in HeLa cells treated with a 2DG titration with or without NAD+. The inset is a 15-fold enlargement, which emphasizes the induction effect by NAD+ in the presence of 0.04 mm 2DG.
The requirement of glucose and glucose-mobilized transcription factors suggests that the adenosine-containing molecules enhance Txnip expression by amplifying the glucose signaling pathway. Indeed, over a wide glucose titration, Txnip mRNA level was further stimulated by treating cells with NAD+ (Fig. 7B). Therefore, enhanced nuclear accumulation of HA-MondoA by NAD+ (Fig. 7A) might explain the general functionality of adenosine-containing molecules in inducing the Txnip expression in a glucose-dependent manner.
Confirming a previous study (26), 2-deoxyglucose (2DG) that can be phophorylated to 2DG6P, which accumulates in cells, dramatically induced nuclear accumulation of HA-MondoA (Fig. 7A). This agrees with the extremely high levels of Txnip expression in cells treated with 2DG (Fig. 7C). Only at very low 2DG levels (0.04 mm), Txnip expression was further boosted by NAD+ (Fig. 7C, inset); in these cells, 2DG6P levels may mimic physiological G6P levels in glucose-fed cells, rendering these 2DG-fed cells responsive to NAD+ (Fig. 7C, inset).
Signaling pathways affected by adenosine-containing molecules in regulating Txnip expression
The induction of Txnip expression by adenosine-containing molecules, especially in the long term, requires these molecules to remain extracellular (Figs. 2C and 3). Thus, adenosine transport/internalization may not be critical in inducing Txnip expression; however, it is possible that the engagement of adenosine-containing molecules with their plasma membrane targets can trigger certain signaling pathways that ultimately lead to redistribution of MondoA/MLX and enhanced Txnip expression.
An adenosine transporter inhibitor, nitrobenzylthioinosine (NBTI), repressed basal Txnip mRNA expression and abolished the stimulatory effect of adenosine-containing molecules in a dose-dependent manner (Fig. 8A). This inhibitor is an adenosine analog (supplemental Fig. 4) and might be able to, with high potency, compete with adenosine-containing molecules for adenosine transporters or other yet unidentified plasma membrane targets, hence acting as an antagonist.
Fig. 8.
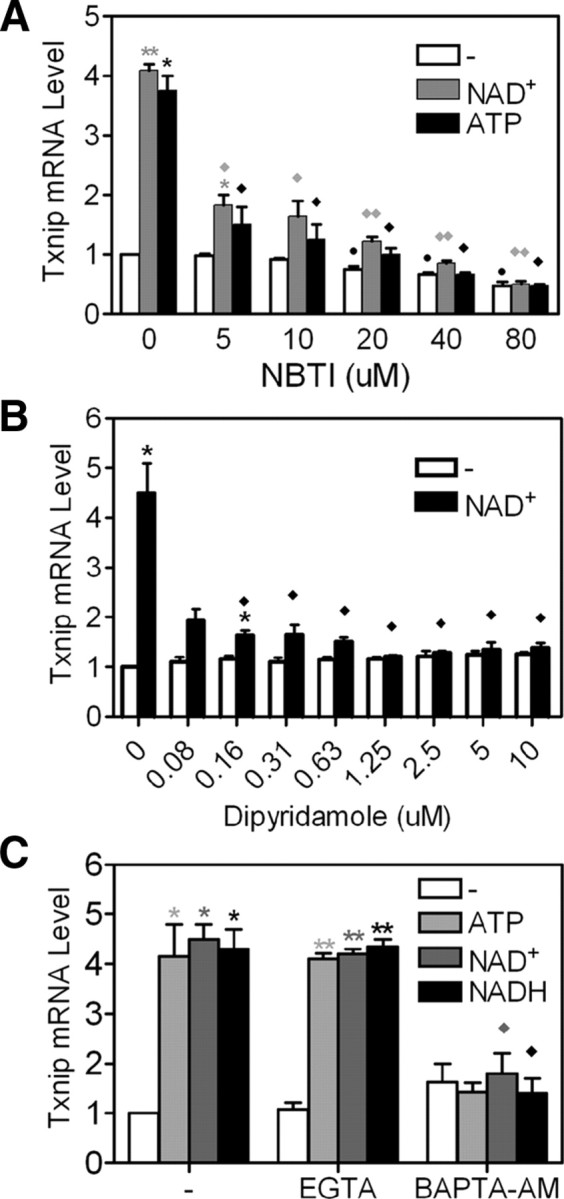
Signaling pathways affected by adenosine-containing molecules to regulate Txnip expression. A and B, Adenosine transporter inhibitor NBTI (A) or dipyridamole (B) showed dose-dependent repression of the induction of Txnip expression by NAD+ or ATP. C, Effects of Ca2+ chelators (BAPTA-AM, 10 μm; EGTA, 500 μm) on the induction of Txnip expression by NAD(H) or ATP. Asterisks indicate comparison between NAD(H)- or ATP-treated and untreated samples; n = 2. *, P < 0.05; **, P < 0.005. Diamonds indicate comparison between NBTI (A), dipyridamole (B), or BAMPTA-AM (C) treated samples with control samples in the presence of NAD(H) or ATP; n = 2. ♦, P < 0.05; ♦♦, P < 0.005.
Dipyridamole, an adenosine transporter inhibitor structurally unrelated to adenosine (supplemental Fig. 4), did not affect basal Txnip mRNA levels but impeded the induction by adenosine-containing molecules (Fig. 8B). These results (Fig. 8, A and B) suggest that the adenosine transporter could be the primary target of the adenosine-containing molecules in inducing the Txnip expression, although other possibilities may exist.
Extracellular nucleotides and nucleosides are known to affect intracellular Ca2+ levels (38, 39), prompting us to explore whether cellular Ca2+ homeostasis is critical for the induction of Txnip expression by adenosine-containing molecules. To this end, we found that in the presence of BAPTA-AM, a cell-permeable calcium chelator, the induction of Txnip expression by NAD(H) or ATP was abolished; however, an extracellular calcium chelator, EGTA, did not show any effect (Fig. 8C). The induction of Txnip expression by adenosine-containing molecules therefore requires intracellular Ca2+ signaling/homeostasis.
Adenosine-containing molecules repress thioredoxin activity and glucose transport
Txnip can inhibit thioredoxin activity. We tested whether cellular thioredoxin activity is affected in cells treated with adenosine-containing molecules. As shown in Fig. 9A, NAD+ can effectively inhibit the activity of thioredoxin after 8 h treatment.
Fig. 9.

Long-term treatment of NAD+ led to inhibition of cellular thioredoxin activity (A) and glucose uptake (B). Asterisks indicate comparison with untreated sample; n = 3 (A), and n = 4 (B). *, P < 0.05; **, P < 0.005.
Txnip has a critical role in regulating energy homeostasis and can inhibit the glucose uptake system (13, 14). We therefore sought to examine the effect of adenosine-containing molecules on the glucose uptake. As seen in Fig. 9B, 8- or 16-h treatments with NAD+ significantly repressed glucose uptake. Shorter treatments failed to inhibit thioredoxin activity (Fig. 9A) and glucose uptake (Fig. 9B). Thus, to be efficacious, Txnip protein levels may need to reach a certain threshold.
The role of NAD+ or ATP on thioredoxin activity or glucose uptake is most likely mediated by up-regulated Txnip protein level as a result of Txnip mRNA expression that is induced by adenosine-containing molecules and suggests that the glucose-dependent induction of Txnip expression by these molecules has important physiological functions.
Discussion
Adenosine-containing molecules may remain extracellular to induce Txnip expression
The majority of tested adenosine-containing molecules are charged and generally not cell permeable. On the other hand, adenosine is permeable (via adenosine transporters) and, once inside the cells, metabolized. For molecules that remain extracellular, e.g. ATP or ADP, stimulatory effects were sustainable; however, the effect of adenosine was not (Fig. 2C). Extracellular ATPase or nucleotidase (40) might gradually remove phosphate groups from adenine nucleotides, forming adenosine that can then be taken up by cells. This would deplete extracellular adenosine or adenine nucleotides with fewer phosphate groups (e.g. AMP), thus the diminishing efficacies of these molecules in long-term assays (Fig. 2C; ≥8 h). NAD(H) can be degraded, by extracellular NADase (40), to ADP-ribose, which contains an intact adenosine moiety and induces Txnip expression (Table 1). This explains the long-term sustainable effects of NAD(H) (Figs. 2C and 3).
Adenosine-containing molecules might not need to be converted to adenosine to induce the Txnip expression because ATPγS, which resists ATPase (41), is also stimulatory (Table 1). Supporting this notion, adenosine and adenine nucleotides show similar kinetics in a time course (Fig. 2C; short-term 0–4 h). We also found that the effect of ATP or ADP on Txnip expression was not affected by an ATPase inhibitor, ARL 67156 (not shown). The fact that α-NAD, a β-NAD analog that cannot function as a coenzyme, and nonhydrolyzable ATPγS induce Txnip expression (Table 1) suggests that cellular redox state or metabolic pathways using adenine nucleotides- or NAD(H)-consuming enzymes are also unlikely directly involved in mediating the induction of Txnip expression by adenosine-containing molecules. Finally, AMPS (AMPαS), an AMP analog that is resistant to degradation at the α-position, remains competent in inducing Txnip expression (Table 1). Taken together, internalization of adenosine-containing molecules, and processing of adenosine phosphates into adenosine, might not be required for inducing Txnip expression.
Potential membrane targets for adenosine-containing molecules
Known membrane targets that have potential affinity for adenosine-containing molecules include the purinergic receptors (P1, P2X, or P2Y) (42) and adenosine transporters (43), of which purinergic receptors are unlikely to be involved in the induction of Txnip expression. First, most of these receptors do not discriminate against the non-adenine nucleotides such as UTP, CTP, GTP, and inosine-5′-diphosphate; however, these molecules did not stimulate Txnip expression (Table 1). Second, an inhibitor of the P1 receptor (caffeine) and inhibitors of the P2 receptor (RB-2 or suramin) failed to impede the induction of Txnip expression by NAD+ or ATP (supplemental Fig. 5).
On the other hand, adenosine transporter inhibitors abolished stimulatory effect of NAD+ on Txnip expression (Fig. 8, A and B), suggesting that adenosine transporters or other membrane targets, which share functional domains that are similarly inhibited by NBTI and dipyridamole, play a critical role in the induction of Txnip expression by adenosine-containing molecules. Adenosine transporters contain a small pore that facilitates cellular adenosine uptake. Adenine nucleotides or other adenosine derivatives are larger, often contain charged groups, and may not be taken up via adenosine transporters. As discussed earlier, adenosine-containing molecules are most likely required to remain extracellular to induce Txnip expression, and the uptake of adenosine via adenosine transporters can actually diminish the effect of adenosine in the long term. Therefore, the transporter activity of adenosine transporters itself may not participate in inducing Txnip expression by adenosine-containing molecules, but these transporters or other structurally similar membrane targets may serve as anchors for these molecules. Their engagement with the membrane targets does not necessarily facilitate cellular transport but likely transmits extracellular signals into cells. Because adenosine transporter inhibitors can effectively block the induction of Txnip expression (Fig. 8, A and B), at this stage we do not absolutely rule out the possibility that the adenosine taken up, be it native or derived extracellularly from adenosine-containing molecules, may exert an effect in inducing Txnip expression. Further studies will be carried out to clarify this issue.
Interestingly, the negative charges around the ribose moiety of these molecules affected their efficacies in a dose-dependent manner. NAD(H) and AMP contain fewer formal charges around the ribose than NADP(H), ADP, and ATP, and the former, but not the latter and uncharged adenosine, sustained the stimulatory effects over a wide titration (Fig. 2, A and B). Thus, adenosine-containing molecules with intermediate levels of negative charges might be optimally configured to bind to plasma membrane targets and induce Txnip expression over a wide range of doses; the rest of the molecules at high dosages might overwhelm the signaling system involving the membrane targets. Hence, the homeostasis of various adenosine-containing molecules might be critical for regulating and fine-tuning Txnip expression.
Signaling pathways involved in the induction of Txnip expression by adenosine-containing molecules
It was reported that adenosine, ATP, ADP, AMP, and ATPγS, but not dATP, UTP, and GTP, could up-regulate the cellular cAMP levels (44). The effects of these molecules on cellular cAMP levels correlated with their effects on Txnip expression (Table 1). Thus, the cellular cAMP levels and related downstream pathways might be involved in the induction of Txnip expression. However, a cell-permeable cAMP analog failed to induce Txnip expression (data not shown). Moreover, cells in which the activity of adenylyl cyclase (for production of cAMP) or protein kinase A (cAMP-activated kinase) was inhibited exhibited a normal Txnip expression pattern (data not shown). These results exclude an involvement of cellular cAMP levels and related downstream pathways in the induction of Txnip expression.
In the presence of a cell-permeable Ca2+ chelator, adenosine-containing molecules failed to induce the expression of Txnip (Fig. 8C), indicating that the intracellular Ca2+ signaling (or homeostasis) is critical for this induction. At this stage, how the cross-plasma membrane signaling evoked by extracellular adenosine-containing molecules is transmitted to Ca2+ and then to the MondoA/MLX complex to activate the Txnip transcription is unclear; the involved signaling steps deserve further investigation.
The MondoA/MLX complex mediates Txnip expression
MondoA or ChREBP in association with MLX was implicated in enhancing the expression of many glucose-responsive genes, including those encoding l-pyruvate kinase, fatty acid synthase, and lactate dehydrogenase-A (31, 32, 33, 34, 36, 37, 45). Although MLX is essential for mediating the induction of Txnip expression by adenosine-containing molecules (Fig. 6), determining which factor (MondoA or ChREBP) is the genuine partner requires further resolution.
The ChREBP expression is restricted to tissues such as liver, kidney, and intestine (46, 47) and is extremely low in other cell types, as opposed to the MondoA expression that maintains measurable levels in a variety of cell types (data not shown). Ectopically expressed MondoA (Fig. 7A) or ChREBP (data not shown) exhibited massive nuclear localization in 2DG-treated cells. This indicates that both overexpressed factors are potent in receiving glucose-mediated signals. In our assay system, MondoA, despite a less efficient ectopic expression than ChREBP, functioned much more potently than ChREBP; in MondoA-deficient cells, the ectopic RNAi-resistant MondoAr, but not ectopic ChREBP, restored the basal Txnip expression and its induction by adenosine-containing molecules (Fig. 6). In addition, the transcription capability of ChREBP is activated by glucose through the pentose pathway in conjunction with protein phosphatase 2A (48), and we found that okadaic acid, a potent protein phosphatase 2A inhibitor, did not affect the induction of Txnip expression by adenosine-containing molecules (not shown). Finally, MondoA occupies the native Txnip promoter (26). Taken together, the MondoA/MLX complex is a major player that supports the ChoRE-dependent Txnip expression and its induction by adenosine-containing molecules.
Adenosine-containing molecules might elevate G6P levels by modulating the activities of enzymes that produce or utilize G6P; this in turn may enhance an accumulation of MondoA/MLX in the nuclei and stimulate Txnip expression. It is equally plausible that these molecules modulate Txnip expression at other levels. For instance, in a G6P-dependent manner, the signaling evoked by adenosine-containing-molecules may accelerate the release of MondoA/MLX from mitochondria or nuclear transport of this complex. In this scenario, the glucose signaling alone might trigger the MondoA/MLX release and nuclear translocation with a limited scale, and this process can be amplified by adenosine-containing molecules to a larger scale to enhance Txnip expression (supplemental Fig. 6).
Physiological significance and perspectives
Many adenosine-containing molecules are readily derivable from foods and might be natural metabolites used by our body to regulate Txnip expression. Some adenosine-containing molecules can also be released by certain tissues under physiological or pathological conditions (49, 50), hence implying local functions. The expression of Txnip is induced by glucose, and Txnip can inhibit glucose uptake, thus forming a negative feedback loop for the regulation of glucose utilization (13, 14, 20, 25). The induction of Txnip expression by adenosine-containing molecules is glucose dependent, suggesting an impact on the kinetics of this negative feedback loop (supplemental Fig. 6).
Glucose uptake and utilization are highly regulated to maintain normal physiology; eukaryotic cells employ diverse mechanisms to sense glucose and regulate the expression of genes involved in metabolic control. Organisms often develop metabolic diseases, e.g. diabetes mellitus and hyperlipidemia, attributed to abnormal glucose homeostasis and/or metabolism. The revelation that adenosine-containing molecules stimulate Txnip expression, most likely by amplifying glucose signaling, may set the stage for chemical mimicries or antagonisms for intervention of metabolic disorders resulting from abnormal glucose homeostasis.
Materials and Methods
Cell culture
Cells were maintained at 37 C with 5% CO2. Jurkat T and Namalwa B cells were grown in RPMI-1640 (Sigma Chemical Co., St. Louis, MO), and all other cells in DMEM (Sigma; with 1 g/liter glucose), supplemented with antibiotics (Invitrogen, Carlsbad, CA), l-glutamine (Invitrogen), and 10% fetal bovine serum (HyClone, Logan, UT). The glucose-free DMEM was supplemented with (additional) 2 mm sodium pyruvate.
Chemicals
All chemicals were purchased from Sigma unless otherwise indicated.
Immunoblots
The expression of HA-tagged proteins was detected with mouse monoclonal anti-HA antibodies (1:1000; Millipore, Bedford, MA), and the control GAPDH level was detected by polyclonal anti-GAPDH antibodies (1:5000; raised with in-house rabbits).
RNA extraction, RT-PCR, and real-time PCR
RNA was extracted using RNeasy Mini Kit (QIAGEN, Valencia, CA), and cDNA was synthesized from RNA samples using reverse transcription with the SuperScript III reverse transcriptase and random hexamers (Invitrogen), in the presence of RNaseOUT (Invitrogen) to maximize RNA stability. PCR was carried out using the Taq DNA polymerase (NEB, Ipswich, MA) with gene-specific primers synthesized by Proligo. Real-time PCR employed the Sybr Green Core Reagents and the 7300 Real-Time PCR system (Applied Biosystems, Foster City, CA) using the same primers as RT-PCR, the sequences of which are shown in supplemental Table 1.
Plasmid constructs
High-fidelity DNA polymerase, Phusion (Finnzymes, Espoo, Finland), was used to amplify DNA fragments used in constructing all plasmids. From a long Txnip promoter DNA fragment obtained by PCR of genomic DNA, various promoter fragments were generated by subsequent PCR, covering 1299-, 760-, 653-, 633-, 441-, 269- (29), and 73-bp Txnip promoter sequences (to the transcription start site), and inserted into the pGL3 vector using the Xho1 and Nhe1 sites. Mutations at ChoRE or NF-Y and FOXO binding sites were introduced into the wild-type Txnip prompter (−269) by PCR. MondoA, ChREBP, and MLX cDNAs were amplified using RT-PCR, dominant-negative MLX created as described (36), and the RNAi-resistant MondoA made by PCR. The above cDNAs were cloned into the expression vector pCI-neo with HA tags. Supplemental Table 1 provides relevant primer information.
siRNAs
Duplexes of siRNAs targeting MondoA and MLX and a control (random) siRNA, were synthesized by Proligo (Singapore). The sequences are GAGUAUGCCUACAGCGACA dTdT (MLX), GAACAACUGCUCAGGGAAA dTdT (MondoA) and UCAGUGUCAUACGUA CGACdTdT (random).
Transfection
Lipofactamine 2000 (Invitrogen) was used in all transfection experiments. Cells were cultured in six-well plates to about 80% confluency with antibiotic-free medium. During transfection, 4 μl Lipofactamine 2000, 1 μg Txnip promoter plasmid, and 10 ng simian virus 40-renilla luciferase plasmid, with or without 0.5 μg expression plasmids, were mixed with 100 μl OPTI-MEM (Invitrogen) for 20 min, and the mixture was then added drop-wise into the well with cells incubated in 0.9 ml OPTI-MEM. At 5 h, the medium was changed to complete medium. For plasmids and siRNA cotransfection experiment, 5 μl Lipofactamine 2000, 1 μg Txnip promoter plasmid, 100 pm siRNA, and 10 ng renilla luciferase plasmid, with or without 50 ng of expression plasmid, were used.
Promoter activity (reporter) assays
The Promega (Madison, WI) Dual-Luciferase Reporter (DLR) Assay System was used to determine the activities of Txnip promoters. Unless otherwise indicated, cells were treated with 0.2 mm NAD(H) or ATP for 16 h after transfection, and cell lysates were prepared to measure the firefly or renilla luciferase activities.
Immunocytometry
HA-MondoA and Myc-MLX were cotransfected into L6 cells grown on glass slips, and the cells were cultured in glucose-free DMEM with 2% FBS. After different treatments, cells were fixed with paraformaldehyde and subjected to indirect immunostaining. Anti-HA antibody (1:500; Millipore) and Alexa Fluor 488 antimouse IgG (1:500; Invitrogen) were used to label HA-tagged MondoA; 4′,6-diamidino-2-phenylindole, included in mounting media (Vector Shield), was used to locate the nuclei. The HA-MondoA subcellular localizations [cytoplasmic, nuclear, or heterogeneous (cytoplasmic/nuclear)] in 100 randomly selected cells were determined using confocal microscopy (Olympus, Tokyo, Japan). Results from three experiments were used for the data analyses.
Thioredoxin activity assays
After NAD+ or ATP treatment, cellular thioredoxin activity was measured as described (51).
Glucose transport assay
U2OS cells were treated with 0.1 mm NAD+ for 0, 2, 4, 8, or 16 h, and the cellular uptake of [3H]2DG was measured according to an online protocol at http://www.ihcworld.com/_protocols/lab_protocols/white-lab-protocols.htm (Dr. M. F. White’s lab).
Statistical analyses
Data were analyzed by unpaired homoscedastic t test; and two-tailed P value < 0.05 was considered statistically significant.
Acknowledgments
We are grateful to L. Zheng, T. Hagen, J.-S. Hee, E. Cheung, and J. Mocanu for critical reading of the manuscript.
Footnotes
Present address for R.-P.D.: Department of Anesthesia, Xiang-Ya Second Hospital, Central South University, Ren-Min Road 86, ChangSha, Hunan 410011, China.
This work has been supported by the Agency for Science, Technology and Research (A*STAR), Singapore.
Disclosure Summary: The authors have nothing to disclose.
First Published Online February 26, 2009
Abbreviations: ChoRE, Carbohydrate response element; ChREBP, ChoRE binding protein; 2DG, 2-deoxyglucose; FAD, flavin adenine dinucleotide; FOXO, forkhead box O; G6P, glucose-6-phosphate; MLX, Max-like protein X; NAD(H), nicotinamide adenine dinucleotide (reduced); NBTI, nitrobenzylthioinosine; NF-Y, nuclear factor Y; RNAi, RNA interference; siRNA, small interfering RNA; Txnip, thioredoxin-interacting protein; UTP, uridine 5′-triphosphate.
References
- 1.Chen KS, DeLuca HF1994. Isolation and characterization of a novel cDNA from HL-60 cells treated with 1,25-dihydroxyvitamin D-3. Biochim Biophys Acta 1219:26–32 [DOI] [PubMed] [Google Scholar]
- 2.Nishiyama A, Matsui M, Iwata S, Hirota K, Masutani H, Nakamura H, Takagi Y, Sono H, Gon Y, Yodoi J1999. Identification of thioredoxin-binding protein-2/vitamin D3 up-regulated protein 1 as a negative regulator of thioredoxin function and expression. J Biol Chem 274:21645–21650 [DOI] [PubMed] [Google Scholar]
- 3.Patwari P, Higgins LJ, Chutkow WA, Yoshioka J, Lee RT2006. The interaction of thioredoxin with Txnip. Evidence for formation of a mixed disulfide by disulfide exchange. J Biol Chem 281:21884–21891 [DOI] [PMC free article] [PubMed] [Google Scholar]
- 4.Powis G, Montfort WR2001. Properties and biological activities of thioredoxins. Annu Rev Biophys Biomol Struct 30:421–455 [DOI] [PubMed] [Google Scholar]
- 5.Chen CL, Lin CF, Chang WT, Huang WC, Teng CF, Lin YS2008. Ceramide induces p38 MAPK and JNK activation through a mechanism involving a thioredoxin-interacting protein-mediated pathway. Blood 111:4365–4374 [DOI] [PubMed] [Google Scholar]
- 6.Kim SY, Suh HW, Chung JW, Yoon SR, Choi I2007. Diverse functions of VDUP1 in cell proliferation, differentiation, and diseases. Cell Mol Immunol 4:345–351 [PubMed] [Google Scholar]
- 7.Xiang G, Seki T, Schuster MD, Witkowski P, Boyle AJ, See F, Martens TP, Kocher A, Sondermeijer H, Krum H, Itescu S2005. Catalytic degradation of vitamin D up-regulated protein 1 mRNA enhances cardiomyocyte survival and prevents left ventricular remodeling after myocardial ischemia. J Biol Chem 280:39394–39402 [DOI] [PubMed] [Google Scholar]
- 8.Lee KN, Kang HS, Jeon JH, Kim EM, Yoon SR, Song H, Lyu CY, Piao ZH, Kim SU, Han YH, Song SS, Lee YH, Song KS, Kim YM, Yu DY, Choi I2005. VDUP1 is required for the development of natural killer cells. Immunity 22:195–208 [DOI] [PubMed] [Google Scholar]
- 9.Sheth SS, Bodnar JS, Ghazalpour A, Thipphavong CK, Tsutsumi S, Tward AD, Demant P, Kodama T, Aburatani H, Lusis AJ2006. Hepatocellular carcinoma in Txnip-deficient mice. Oncogene 25:3528–3536 [DOI] [PubMed] [Google Scholar]
- 10.Han SH, Jeon JH, Ju HR, Jung U, Kim KY, Yoo HS, Lee YH, Song KS, Hwang HM, Na YS, Yang Y, Lee KN, Choi I2003. VDUP1 upregulated by TGF-β1 and 1,25-dihydroxyvitamin D3 inhibits tumor cell growth by blocking cell-cycle progression. Oncogene 22:4035–4046 [DOI] [PubMed] [Google Scholar]
- 11.Muoio DM2007. TXNIP links redox circuitry to glucose control. Cell Metab 5:412–414 [DOI] [PubMed] [Google Scholar]
- 12.Chutkow WA, Patwari P, Yoshioka J, Lee RT2008. Thioredoxin-interacting protein (Txnip) is a critical regulator of hepatic glucose production. J Biol Chem 283:2397–2406 [DOI] [PubMed] [Google Scholar]
- 13.Yoshioka J, Imahashi K, Gabel SA, Chutkow WA, Burds AA, Gannon J, Schulze PC, MacGillivray C, London RE, Murphy E, Lee RT2007. Targeted deletion of thioredoxin-interacting protein regulates cardiac dysfunction in response to pressure overload. Circ Res 101:1328–1338 [DOI] [PubMed] [Google Scholar]
- 14.Parikh H, Carlsson E, Chutkow WA, Johansson LE, Storgaard H, Poulsen P, Saxena R, Ladd C, Schulze PC, Mazzini MJ, Jensen CB, Krook A, Björnholm M, Tornqvist H, Zierath JR, Ridderstråle M, Altshuler D, Lee RT, Vaag A, Groop LC, Mootha VK2007. TXNIP regulates peripheral glucose metabolism in humans. PLoS Med 4:e158 [DOI] [PMC free article] [PubMed]
- 15.Oka S, Liu W, Masutani H, Hirata H, Shinkai Y, Yamada S, Yoshida T, Nakamura H, Yodoi J2006. Impaired fatty acid utilization in thioredoxin binding protein-2 (TBP-2)-deficient mice: a unique animal model of Reye syndrome. FASEB J 20:121–123 [DOI] [PubMed] [Google Scholar]
- 16.Donnelly KL, Margosian MR, Sheth SS, Lusis AJ, Parks EJ2004. Increased lipogenesis and fatty acid reesterification contribute to hepatic triacylglycerol stores in hyperlipidemic Txnip−/− mice. J Nutr 134:1475–1480 [DOI] [PubMed] [Google Scholar]
- 17.Hui TY, Sheth SS, Diffley JM, Potter DW, Lusis AJ, Attie AD, Davis RA2004. Mice lacking thioredoxin-interacting protein provide evidence linking cellular redox state to appropriate response to nutritional signals. J Biol Chem 279:24387–24393 [DOI] [PubMed] [Google Scholar]
- 18.Sheth SS, Castellani LW, Chari S, Wagg C, Thipphavong CK, Bodnar JS, Tontonoz P, Attie AD, Lopaschuk GD, Lusis AJ2005. Thioredoxin-interacting protein deficiency disrupts the fasting-feeding metabolic transition. J Lipid Res 46:123–134 [DOI] [PubMed] [Google Scholar]
- 19.van Greevenbroek MM, Vermeulen VM, Feskens EJ, Evelo CT, Kruijshoop M, Hoebee B, van der Kallen CJ, de Bruin TW2007. Genetic variation in thioredoxin interacting protein (TXNIP) is associated with hypertriglyceridaemia and blood pressure in diabetes mellitus. Diabetes Med 24:498–504 [DOI] [PubMed] [Google Scholar]
- 20.Minn AH, Hafele C, Shalev A2005. Thioredoxin-interacting protein is stimulated by glucose through a carbohydrate response element and induces β-cell apoptosis. Endocrinology 146:2397–2405 [DOI] [PubMed] [Google Scholar]
- 21.Chen J, Saxena G, Mungrue IN, Lusis AJ, Shalev A2008. Thioredoxin-interacting protein: a critical link between glucose toxicity and β-cell apoptosis. Diabetes 57:938–944 [DOI] [PMC free article] [PubMed] [Google Scholar]
- 22.Chen J, Hui ST, Couto FM, Mungrue IN, Davis DB, Attie AD, Lusis AJ, Davis RA, Shalev A2008. Thioredoxin-interacting protein deficiency induces Akt/Bcl-xL signaling and pancreatic β-cell mass and protects against diabetes. FASEB J 22:358–394 [DOI] [PMC free article] [PubMed] [Google Scholar]
- 23.Hui ST, Andres AM, Miller AK, Spann NJ, Potter DW, Post NM, Chen AZ, Sachithanantham S, Jung DY, Kim JK, Davis RA2008. Txnip balances metabolic and growth signaling via PTEN disulfide reduction. Proc Natl Acad Sci USA 105:3921–3926 [DOI] [PMC free article] [PubMed] [Google Scholar]
- 24.Oka S, Yoshihara E, Bizen-Abe A, Liu W, Watanabe M, Yodoi J, Masutani H2009. Thioredoxin binding protein-2 (TBP-2)/Txnip is a critical regulator of insulin secretion and peroxisome proliferator-activated receptor function. Endocrinology 150:1225–1234 [DOI] [PubMed] [Google Scholar]
- 25.Schulze PC, Yoshioka J, Takahashi T, He Z, King GL, Lee RT2004. Hyperglycemia promotes oxidative stress through inhibition of thioredoxin function by thioredoxin-interacting protein. J Biol Chem 279:30369–30374 [DOI] [PubMed] [Google Scholar]
- 26.Stoltzman CA, Peterson CW, Breen KT, Muoio DM, Billin AN, Ayer DE2008. Glucose sensing by MondoA:Mlx complexes: a role for hexokinases and direct regulation of thioredoxin-interacting protein expression. Proc Natl Acad Sci USA 105:6912–6917 [DOI] [PMC free article] [PubMed] [Google Scholar]
- 27.Wang Z, Rong YP, Malone MH, Davis MC, Zhong F, Distelhorst CW2006. Thioredoxin-interacting protein (txnip) is a glucocorticoid-regulated primary response gene involved in mediating glucocorticoid-induced apoptosis. Oncogene 25:1903–1913 [DOI] [PubMed] [Google Scholar]
- 28.Billiet L, Furman C, Larigauderie G, Copin C, Page S, Fruchart JC, Brand K, Rouis M2008. Enhanced VDUP-1 gene expression by PPARγ agonist induces apoptosis in human macrophage. J Cell Physiol 214:183–191 [DOI] [PubMed] [Google Scholar]
- 29.Kim KY, Shin SM, Kim JK, Paik SG, Yang Y, Choi I2004. Heat shock factor regulates VDUP1 gene expression. Biochem Biophys Res Commun 315:369–375 [DOI] [PubMed] [Google Scholar]
- 30.Butler LM, Zhou X, Xu WS, Scher HI, Rifkind RA, Marks PA, Richon VM2002. The histone deacetylase inhibitor SAHA arrests cancer cell growth, up-regulates thioredoxin-binding protein-2, and down-regulates thioredoxin. Proc Natl Acad Sci USA 99:11700–11705 [DOI] [PMC free article] [PubMed] [Google Scholar]
- 31.Ishii S, Iizuka K, Miller BC, Uyeda K2004. Carbohydrate response element binding protein directly promotes lipogenic enzyme gene transcription. Proc Natl Acad Sci USA 101:15597–15602 [DOI] [PMC free article] [PubMed] [Google Scholar]
- 32.Yamashita H, Takenoshita M, Sakurai M, Bruick RK, Henzel WJ, Shillinglaw W, Arnot D, Uyeda K2001. A glucose-responsive transcription factor that regulates carbohydrate metabolism in the liver. Proc Natl Acad Sci USA 98:9116–9121 [DOI] [PMC free article] [PubMed] [Google Scholar]
- 33.Stoeckman AK, Ma L, Towle HC2004. Mlx is the functional heteromeric partner of the carbohydrate response element-binding protein in glucose regulation of lipogenic enzyme genes. J Biol Chem 279:15662–15669 [DOI] [PubMed] [Google Scholar]
- 34.Ma L, Tsatsos NG, Towle HC2005. Direct role of ChREBP.Mlx in regulating hepatic glucose-responsive genes. J Biol Chem 280:12019–12027 [DOI] [PubMed] [Google Scholar]
- 35.Billin AN, Ayer DE2006. The Mlx network: evidence for a parallel Max-like transcriptional network that regulates energy metabolism. Curr Top Microbiol Immunol 302:255–278 [DOI] [PubMed] [Google Scholar]
- 36.Ma L, Robinson LN, Towle HC2006. ChREBP*Mlx is the principal mediator of glucose-induced gene expression in the liver. J Biol Chem 281:28721–28730 [DOI] [PubMed] [Google Scholar]
- 37.Sans CL, Satterwhite DJ, Stoltzman CA, Breen KT, Ayer DE2006. MondoA-Mlx heterodimers are candidate sensors of cellular energy status: mitochondrial localization and direct regulation of glycolysis. Mol Cell Biol 26:4863–4871 [DOI] [PMC free article] [PubMed] [Google Scholar]
- 38.Bruzzone S, Moreschi I, Guida L, Usai C, Zocchi E, De Flora A2006. Extracellular NAD+ regulates intracellular calcium levels and induces activation of human granulocytes. Biochem J 393:697–704 [DOI] [PMC free article] [PubMed] [Google Scholar]
- 39.Hanley PJ, Musset B, Renigunta V, Limberg SH, Dalpke AH, Sus R, Heeg KM, Preisig-Müller R, Daut J2004. Extracellular ATP induces oscillations of intracellular Ca2+ and membrane potential and promotes transcription of IL-6 in macrophages. Proc Natl Acad Sci USA 101:9479–9484 [DOI] [PMC free article] [PubMed] [Google Scholar]
- 40.Haag F, Adriouch S, Brass A, Jung C, Moller S, Scheuplein F, Bannas P, Seman M, Koch-Nolte F2007. Extracellular NAD and ATP: partners in immune cell modulation. Purinergic Signal 3:71–81 [DOI] [PMC free article] [PubMed] [Google Scholar]
- 41.Beukers MW, Kerkhof CJ, van Rhee MA, Ardanuy U, Gurgel C, Widjaja H, Nickel P, IJzerman AP, Soudijn W1995. Suramin analogs, divalent cations and ATP γS as inhibitors of ecto-ATPase. Naunyn Schmiedebergs Arch Pharmacol 351:523–528 [DOI] [PubMed] [Google Scholar]
- 42.Burnstock G2008. Purinergic signalling and disorders of the central nervous system. Nat Rev Drug Discov 7:575–590 [DOI] [PubMed] [Google Scholar]
- 43.Thorn JA, Jarvis SM1996. Adenosine transporters. Gen Pharmacol 27:613–620 [DOI] [PubMed] [Google Scholar]
- 44.Matsuoka I, Zhou Q, Ishimoto H, Nakanishi H1995. Extracellular ATP stimulates adenylyl cyclase and phospholipase C through distinct purinoceptors in NG108-15 cells. Mol Pharmacol 47:855–862 [PubMed] [Google Scholar]
- 45.Dentin R, Pégorier JP, Benhamed F, Foufelle F, Ferre P, Fauveau V, Magnuson MA, Girard J, Postic C2004. Hepatic glucokinase is required for the synergistic action of ChREBP and SREBP-1c on glycolytic and lipogenic gene expression. J Biol Chem 279:20314–20326 [DOI] [PubMed] [Google Scholar]
- 46.de Luis O, Valero MC, Jurado LA2000. WBSCR14, a putative transcription factor gene deleted in Williams-Beuren syndrome: complete characterisation of the human gene and the mouse ortholog. Eur J Hum Genet 8:215–222 [DOI] [PubMed] [Google Scholar]
- 47.Cairo S, Merla G, Urbinati F, Ballabio A, Reymond A2001. WBSCR14, a gene mapping to the Williams-Beuren syndrome deleted region, is a new member of the Mlx transcription factor network. Hum Mol Genet 10:617–627 [DOI] [PubMed] [Google Scholar]
- 48.Kabashima T, Kawaguchi T, Wadzinski BE, Uyeda K2003. Xylulose 5-phosphate mediates glucose-induced lipogenesis by xylulose 5-phosphate-activated protein phosphatase in rat liver. Proc Natl Acad Sci USA 100:5107–5112 [DOI] [PMC free article] [PubMed] [Google Scholar]
- 49.Han DH, Hansen PA, Nolte LA, Holloszy JO1998. Removal of adenosine decreases the responsiveness of muscle glucose transport to insulin and contractions. Diabetes 47:1671–1675 [DOI] [PubMed] [Google Scholar]
- 50.Yin J, Xu K, Zhang J, Kumar A, Yu FS2007. Wound-induced ATP release and EGF receptor activation in epithelial cells. J Cell Sci 120:815–825 [DOI] [PMC free article] [PubMed] [Google Scholar]
- 51.Elias S.JArnér, Arne Holmgren2000. Measurement of thioredoxin and thioredoxin reductase. In: Morgan K, ed. Current protocols in toxicology. New York: Wiley, Sons; 7.4.1–7.4.14 [DOI] [PubMed]