

Abstract
The liver X receptors (LXR-α and -β) are nuclear oxysterol receptors that play pivotal roles in regulating the expression of genes involved in cholesterol transport and metabolism. Recently, several groups have reported that the LXRs also regulate adrenal steroidogenesis. However, the roles of LXRs in the hypothalami-pituitary-adrenal axis, especially whether they regulate proopiomelanocortin (POMC) gene expression in the pituitary, remain to be elucidated. In this report, we demonstrate that LXR mRNA is expressed in the pituitary and that at the protein level, LXR-α is dominantly expressed. Next, we show that the LXR agonist TO901317 (TO) increased POMC mRNA levels and the number of cells immunostained with anti-ACTH antibody in the mouse pituitary. We also confirmed that TO elevated plasma ACTH and serum corticosterone levels in vivo and increased the total tissue content of immunoreactive ACTH in the pituitary. TO activated the rat POMC gene promoter (−706/+64 bp) in GH3 and AtT-20 cells. Silencing of LXR-α mRNA expression in GH3 cells with small interfering RNA specific to LXR-α caused a loss of promoter activity induced by the LXR ligand, suggesting that LXR-α directly regulates the POMC gene promoter. EMSAs also demonstrated that the retinoid X receptor-α/LXR-α heterodimer bound to the region between −73 and −52 bp in the rat POMC gene promoter, and this site was responsible for the induction by TO, as confirmed by chromatin immunoprecipitation assays using AtT-20 cells. Our findings provide the first evidence that LXR-α positively regulates the POMC gene promoter at the transcriptional level and suggest LXR-α to be a coordinator for cross talk between lipid metabolism and neuroendocrinology.
LXR-α is expressed in the ACTH-immunoreactive cells in the pituitary and positively regulates proopiomelanocortin (POMC) gene expression in the anterior pituitary lobe at the transcriptional level.
Liver X receptors (LXRs) are nuclear receptors that play pivotal roles in the transcriptional control of genes involved in lipid and carbohydrate metabolism (1, 2, 3). LXRs exist in two isoforms, LXR-α (NR1H3) and -β (NR1H2) (4, 5). LXR-α is highly expressed in the liver and expressed at lower levels in the adrenal gland, intestine, adipose tissue, macrophages, lung, and kidney, whereas LXR-β is expressed ubiquitously and at especially high levels in the central nervous system (6). The LXRs are ligand-dependent transcription factors that form heterodimers with the retinoid X receptor (RXR). The RXR/LXR heterodimers bind to LXR-response elements (LXREs) consisting of direct repeats (DRs) of the core sequence AGGTCA separated by four nucleotides (DR4) (4, 5, 7, 8). The LXRs are nuclear receptors the ligand of which is oxysterol, a derivative of cholesterol (9). Recently, several groups have reported that LXRs also regulate adrenal steroidogenesis (10, 11, 12). However, the possible roles of LXRs in the hypothalami-pituitary-adrenal gland (HPA) axis, especially whether LXRs regulate proopiomelanocortin (POMC) gene expression in the pituitary gland, remain to be elucidated. In the current study, we demonstrated that a high-cholesterol diet and the synthetic LXR ligand TO901317 induced POMC gene expression in the pituitary gland via LXR-α in mice. Furthermore, we showed that LXR-α directly regulates the POMC gene promoter, indicating that POMC gene expression is positively regulated by LXR-α at the transcriptional level.
Results
TO901317 administration increased serum total cholesterol levels in mice
Male C57/B6 mice (4 wk of age) were assigned one of four different treatments: fed a normal diet (group ND), fed a 2% cholesterol diet (group CD), ip injected with dimethylsulfoxide (DMSO) (group Sham), or administered TO901317 (group TO). As shown in Tables 1 and 2, there were no significant changes in body weight with any of the four treatments. We also measured serum total cholesterol levels and found that TO901317 (TO) as well as a high-cholesterol diet significantly increased total cholesterol levels, as reported (12, 13). There were significant differences in total cholesterol levels between the CD and TO groups, suggesting that TO increased serum cholesterol levels more efficiently than CD.
Table 1.
Mouse body weight (g) of the four groups
| Body weight1 | Day 1 | Day 14 |
|---|---|---|
| ND | 17.1 ± 0.7 (18) | 23.2 ± 0.3 (18) |
| CD | 16.9 ± 0.7 (18) | 23.4 ± 0.3 (16) |
| Sham | 16.4 ± 0.9 (6) | 23.8 ± 0.9 (5) |
| TO | 17.0 ± 0.6 (18) | 22.7 ± 0.3 (16) |
ND, The group fed a normal diet; CD, the group fed a 2% cholesterol diet; Sham, the group injected ip with DMSO; TO, the group administered TO ip. Values in parentheses are the number of animals in each group. Data represent the mean ± sem.
Body weight showed no significant differences among the four treatments.
Table 2.
Mouse total cholesterol levels (mg/dl) of the four groups
| Total cholesterol (mg/dl)1 | Day 14 |
|---|---|
| ND | 82.5 ± 3.8 (12) |
| CD | 112.5 ± 4.1 (14)2 |
| Sham | 73.1 ± 2.0 (3) |
| TO | 154.5 ± 6.5 (11)3 |
ND, The group fed a normal diet; CD, the group fed a 2% cholesterol diet; Sham, the group injected ip with DMSO; TO, the group administered TO ip. Values in parentheses are the number of animals in each group. Data represent the mean ± sem.
Serum total cholesterol levels were significantly increased by both the CD and TO treatments.
P < 0.01, significantly different from ND for CD.
P < 0.01, significantly different from Sham for TO.
Both LXR-α and LXR-β are expressed in the mouse pituitary
To test whether LXRs are expressed in the pituitary or not, we performed real-time RT-PCR for both LXR-α and LXR-β using mouse pituitary total RNA. We also evaluated LXR gene expression in the hypothalamus, cerebrum, and cerebellum. As shown in Fig. 1B, the LXR-β gene was expressed throughout the brain at similar levels as in the liver, whereas LXR-α mRNA levels in the central nervous system were clearly decreased compared with those in the liver (Fig. 1A). However, the LXR-α gene was significantly and specifically expressed in the pituitary (Fig. 1A).
Fig. 1.

Distribution of LXR gene expression in the brain. Total RNA of wild-type C57/B6 mice was prepared from individual parts of the brain and subjected to a real-time RT-PCR analysis. mRNA levels were normalized to GAPDH. Representative RT-PCR bands are shown in the figure. Values in parentheses are the number (n) of animals in each group. Data represent the mean ± sem. **, P < 0.01, significantly different from liver. #, P < 0.05; ##, P < 0.01; significantly different from pituitary. The number above the black bar indicates the location (1, liver; 2, pituitary; 3, hypothalamus; 4, cerebrum; 5, cerebellum).
Levels of LXR-α protein in the pituitary are higher than those of LXR-β
We next studied LXR protein expression in the pituitary with immunohistochemistry. We confirmed that the antibody specific for LXR-α or -β detected each protein in GH3 cells (see Fig. 6A) and in mouse liver (data not shown) by Western blotting. Unexpectedly, immunohistological analysis of the mouse anterior pituitary lobe demonstrated that the number of LXR-α immunoreactive cells was larger than that of LXR-β-reactive cells (Fig. 2). On the other hand, we did not detect any LXR-α or LXR-β-immunoreactive cells in the intermediate lobe (data not shown). The data indicated that LXR-α protein was expressed at a higher level than LXR-β protein in the anterior lobe of the pituitary.
Fig. 6.
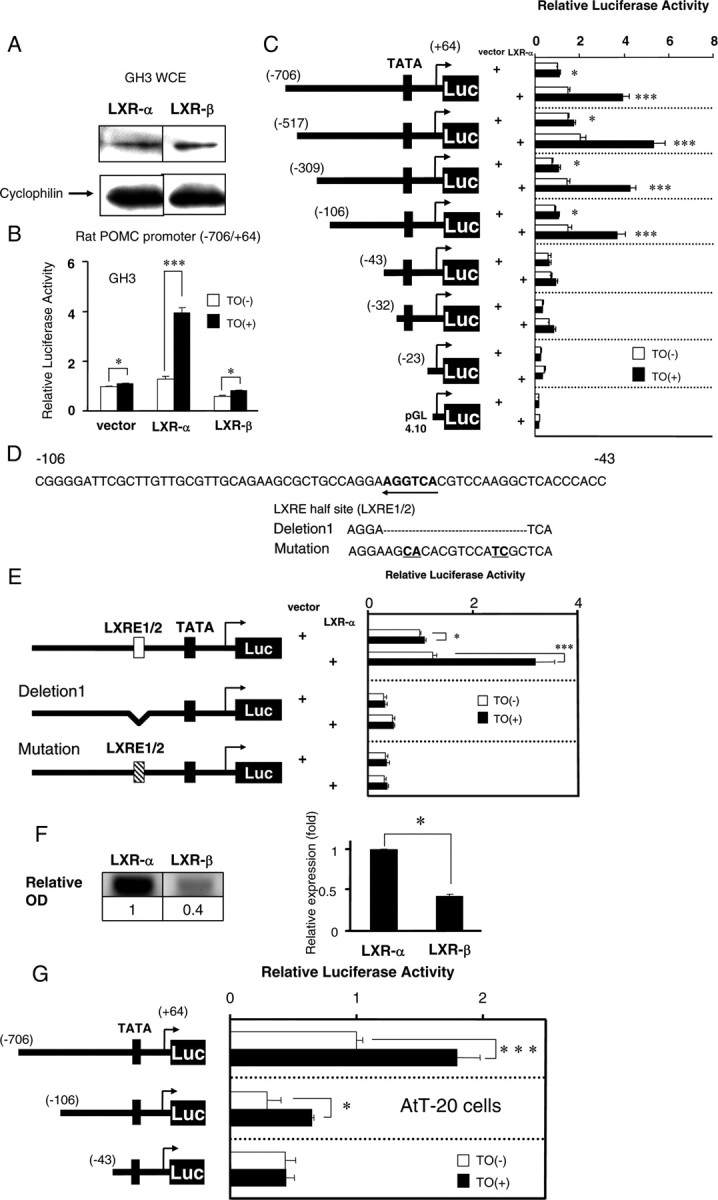
A, Anti-LXR-α and anti-LXR-β antibodies recognized intrinsic LXR-α and LXR-β protein, respectively, in GH3 cells. Whole-cell extracts (WCE) from GH3 cells were analyzed by Western blotting using anti-LXR-α or LXR-β antibodies. Cyclophilin was employed as an internal control. B, LXR-α, but not LXR-β, induced POMC gene promoter activity. The rat POMC promoter (−706/+64 bp) coupled to the luciferase reporter construct (pGL4) (2 μg per well in a six-well format) was cotransfected into GH3 cells with an expression vector (pSG5) for LXR-α or LXR-β together with RXR-α in pSG5 (0.2 μg per well in a six-well format). Relative luciferase activity (mean ± sem, n = 3) represents the luciferase activity of the reporter construct (−706/+64 pGL4) with vector (pSG5) alone in the absence of 1 μm TO901317 (TO). The vehicle for TO was DMSO [TO(−)]. An asterisk indicates that the difference between the denoted pairs is significant at a confidence level of P < 0.05 (*) or P < 0.001 (***) by Student’s t test. C, The −706/+64 reporter or the deletion mutant reporters were cotransfected into GH3 cells with an expression vector for LXR-α together with RXR-α in pSG5 (0.2 μg per well in a six-well format). A schematic representation of the deletion mutants of the LXR-α promoter is shown in the left panel. The black box indicates the TATA box. Relative luciferase activity (mean ± sem; n = 3) represents the luciferase activity of each reporter construct in the absence of TO (1 μm). An asterisk indicates that the difference between the denoted pairs is significant at a confidence level of P < 0.05 (*) or P < 0.001 (***) by Student’s t test. D, Rat POMC gene promoter sequences around the −106 to −43-bp region. Bold letters with an arrow indicate the LXRE half-site (LXRE1/2). The dotted line indicates the location of the deletion, and underlined bold letters indicate the mutation. E, Both deletion and mutation of the LXRE half-site lead to a complete loss of ligand-dependent activation, suggesting that the half-site is responsible for the induction. Transfection followed by luciferase assays was performed as described in panel B. Relative luciferase activity (mean ± sem; n = 3) represents the luciferase activity of the reporter construct (−706/+64 pGL4) with vector (pSG5) alone in the absence of 1 μm of TO. An asterisk indicates that the difference between the denoted pairs is significant at a confidence level of P < 0.05 (*) or P < 0.001 (***) by Student’s t test. F, LXR-α gene expression in AtT-20 cells was more robust than LXR-β expression. Total RNA of AtT-20 cells was subjected to a real-time RT-PCR analysis. mRNA levels were normalized to GAPDH, and relative OD is shown compared with the mRNA level of LXR-α. Representative RT-PCR bands are shown in the figure. Data represent the mean ± sem (n = 3). An asterisk indicates that the difference between LXR-α and LXR-β is significant at a confidence level of P < 0.05 (*) by Student’s t test. G, The −706/+64 reporter or the deletion mutant reporters were cotransfected into AtT-20 cells (2 μg per well in a six-well format). A schematic representation of the deletion mutants of the rat POMC gene promoter is shown in the left panel. The black box indicates the TATA box. Relative luciferase activity (mean ± sem; n = 3) represents the luciferase activity of each reporter construct in the absence of TO (10−8 m). An asterisk indicates that the difference between the denoted pairs is significant at a confidence level of P < 0.05 (*) or P < 0.001 (***) by Student’s t test.
Fig. 2.

Immunohistological analysis of the anterior pituitary lobe stained with anti-LXR-α and -β antibodies. Dark brown staining was clearly detected in the nuclei of the cells with anti-LXR-α antibody (left panel), whereas few nuclei were positive with anti-LXR-β antibody (right panel). The number of cells immunoreactive (IR) for anti-LXR-α or -β antibody was normalized by the total number of cells. Data represent the mean ± sem (n = 5). **, P < 0.01, significantly different from the number of LXR-α-positive cells for those positive by LXR-β by Student’s t test. Bar, 10 μm.
Both cholesterol diet and administration of TO increased plasma ACTH and serum corticosterone levels in vivo
We measured plasma ACTH and serum corticosterone levels in four differently treated animals. As shown in Fig. 3, A and B, plasma ACTH and serum corticosterone levels were significantly increased in the CD and TO groups compared with the ND and Sham groups, respectively.
Fig. 3.

Plasma ACTH and serum corticosterone levels in four differently treated groups. Plasma ACTH (A) and serum corticosterone (B) levels were evaluated using the blood collected from mice in the four different treatment groups, who received sufficient handling before decapitation. Data represent the mean ± sem, and values in parentheses are the number (n) of animals in each group. An asterisk indicates that the difference between the denoted pairs is significant at a confidence level of *, P < 0.05 by Student’s t test. ND, The group fed a normal diet; CD, the group fed a 2% cholesterol diet; Sham, the group injected ip with DMSO; TO, the group administered TO ip.
TO significantly increased ACTH production in the pituitary
We next performed an immunohistological analysis of the mouse pituitary in the Sham and TO groups. Anterior pituitary lobe sections were stained with antihuman ACTH antibody. As shown in Fig. 4A, the number of ACTH-immunoreactive cells was significantly increased, 1.3-fold in the TO group, compared with the Sham treatment group. We also measured the total amount of ACTH in the pituitary. As shown in Fig. 4B, the amount of ACTH in the pituitary was significantly increased by TO treatment to 1.3-fold that in the Sham treatment group. These results indicate that TO induces ACTH production in the mouse pituitary. Furthermore, double immunostaining utilizing anti-LXR-α and anti-ACTH antibodies revealed that LXR-α was expressed in almost all (92%) of the ACTH-immunoreactive cells (i.e. corticotroph cells) indicating the colocalization of LXR-α and ACTH.
Fig. 4.

Immunohistological analysis of the pituitary (A and C) and total tissue content of immunoreactive ACTH (B) in the sham and TO groups. A, Sections of anterior pituitary lobe were stained with anti-ACTH antibody. Representative immunohistological images of anterior pituitary lobe are shown in the figure. The number of cells immunoreactive (IR) for ACTH was normalized by the total number of cells. Data represent the mean ± sem (n = 9). *, P < 0.05, significantly different from the number of IR ACTH cells in the TO group for those with Sham treatment by Student’s t test. Bar, 100 μm. B, Total pituitary content of immunoreactive ACTH. Results were normalized to tissue protein levels. Data represent the mean ± sem (n: as indicated in the figure). *, P < 0.05; significantly different from immunoreactive ACTH levels in the TO group for those with Sham treatment by Student’s t test. C, Double immunostaining of anterior pituitary lobe with anti-LXR-α and anti-ACTH antibodies. The LXR-α reaction was colored by 3,3′-diaminobenzidine (brown) and thereafter, the same section was immunostained with ACTH with 4-chloro-1-naphtol (dark blue). Bar, 10 μm. LXR-α expression was observed in 92% of ACTH-positive stained cells.
Both the cholesterol diet and TO induced POMC gene expression in the pituitary in vivo and TO increased POMC mRNA levels in AtT-20 cells
Based on our finding that TO significantly increased ACTH production in the pituitary, we next examined whether the cholesterol diet or administration of TO induced POMC gene expression in the mouse pituitary. As shown in Fig. 5A, POMC mRNA levels in the pituitary were significantly increased in the mice fed the 2% cholesterol diet (1.2-fold that in the ND group) and administered TO (1.4-fold that in the Sham group). Because the POMC gene is also expressed in the intermediate lobe (14), we examined its expression in both lobes. As shown in Fig. 5B, POMC mRNA levels in the anterior lobe were significantly increased 1.7-fold in the TO group compared with the Sham group, whereas no significant differences were observed in the intermediate lobe (Fig. 5C). This result suggests that TO treatment significantly increased POMC mRNA levels in the anterior pituitary lobe. To confirm this finding, we employed AtT-20 cells, which were initially derived from the mouse pituitary gland and are known to express the POMC gene (Fig. 5D). The POMC mRNA level in AtT-20 cells was increased by TO in a dose-dependent manner. These two results indicated that both the cholesterol diet and administration of TO induced POMC gene expression in the pituitary in vivo, and TO increased POMC mRNA levels in AtT-20 cells. Recently, it was reported that the administration of an LXR agonist, GW3965, reduced the gene expression of 11β-hydroxysteroid dehydrogenase type 1 (11β-HSD1) in the pituitary gland (11); however, neither dietary cholesterol nor TO affected the 11β-HSD1 gene expression (Fig. 5E).
Fig. 5.

A and E, The LXR agonist and cholesterol diet significantly induced POMC gene expression but not 11β-HSD1 gene expression in the mouse pituitary gland. ND, The group fed a normal diet; CD, the group fed a 2% cholesterol diet; Sham, the group ip injected with DMSO; TO, the group ip administered TO. Total RNA (1 μg) isolated from the whole pituitary (A), anterior pituitary lobe (B), or intermediate lobe (C) was subjected to reverse transcription (RT). Real-time RT-PCR analysis for mouse POMC (A, B, and C) or mouse 11β-HSD1 (E) gene expression was performed using mouse pituitary cDNA. Relative values (mean ± sem; n = 8) normalized to GAPDH mRNA levels compared with ND are shown as Relative Expression (fold) (A and E). Relative values (mean ± sem) normalized to GAPDH mRNA levels compared with Sham are shown as Relative Expression (fold), and values in parentheses are the number (n) of animals in each group (B and C). The difference between the denoted pairs is significant at a confidence level of P < 0.05 (*) or P < 0.05 (#) by Student’s t test. D, AtT-20 cells were cultured with TO as indicated, and total RNA was extracted and subjected to real-time PCR analysis as described above. Relative values (mean ± sem, n = 3) normalized to GAPDH mRNA levels compared with 0 m TO are shown as Relative Expression (fold). An asterisk indicates that the difference between the denoted pairs is significant at a confidence level of *, P < 0.01; **, P < 0.001 by Student’s t test. F, AtT-20 cells were treated with either DMSO or 50 μm CHX and simultaneously treated for 0–24 h with either DMSO or 10−7 m TO before harvesting. Total RNA of AtT-20 cells was subjected to a real-time RT-PCR analysis for mouse POMC gene expression as described above. Relative values (mean ± sem; n = 3) normalized to GAPDH mRNA levels compared with 0 h of each treatment (in the presence or absence of TO) are shown as Relative Expression (fold). An asterisk indicates that the difference between the denoted pairs is significant at a confidence level of *, P < 0.05 by Student’s t test.
Activated LXRs induced POMC gene expression possibly at the transcriptional level
To determine whether TO induced POMC gene expression via another protein, we employed the protein synthesis inhibitor cycloheximide (CHX). CHX did not interfere with the TO-mediated induction of POMC gene expression (Fig. 5F). This result suggested that the increase in POMC mRNA levels did not depend on increased production of another protein induced by TO via LXRs and that LXRs activated by TO could directly induce POMC gene expression possibly at the transcriptional level.
LXR-α, but not LXR-β, positively regulated the POMC gene promoter via a LXRE half-site
We employed the rat POMC gene promoter (−706 to +64 bp) ligated to the pGL4 luciferase reporter plasmid to examine whether LXRs directly regulate gene expression at the transcriptional level. We cotransfected the POMC gene promoter construct and/or LXR-α or LXR-β into GH3 cells. First, we confirmed that both LXR-α and LXR-β were expressed in GH3 cells by Western blotting (Fig. 6A). The POMC gene promoter was activated upon TO treatment without overexpression of LXRs, possibly due to intrinsic LXRs in GH3 cells (Fig. 6B, left graph). The overexpression of LXR-β did not affect the ligand-dependent activation of the POMC gene promoter (Fig. 6B, right graph), which was almost the same level as in the pSG5 vector-transfected cells, whereas the TO-induced activation of the reporter was augmented by the cotransfection of LXR-α (Fig. 6B, middle graph). These findings indicate that LXR-α specifically regulates the POMC gene promoter. Next, we prepared a series of mutants with deletions of the rat POMC gene promoter to identify the region responsible for the activation by LXR-α. We cotransfected these mutants and/or LXR-α into GH3 cells. As shown in Fig. 6C, the −43/+64 bp construct reduced the activation by LXR-α, indicating the response elements to be located between −106 and −43 bp in the POMC promoter. We then precisely examined the sequence from −106 to −43 bp and found an LXRE half-site (AGGTCA) (Fig. 6D). To test whether the element is important to the promoter’s activation by LXR-α, we deleted or mutated it in the reporter plasmid (−706 to +64 bp). As shown in Fig. 6E, these mutant reporter plasmids were not induced by LXR-α and TO, indicating that the LXRE half-site (LXRE1/2) is essential for the activation by LXR-α. Because GH3 cells are derived from the rat somatotroph, we performed these experiments in AtT-20 cells, which are derived from the mouse corticotroph. We examined LXR gene expression in AtT-20 cells with real-time RT-PCR. As shown in Fig. 6F, LXR-α mRNA levels were significantly higher than LXR-β mRNA levels. Therefore, we did not overexpress LXR-α in AtT-20 cells for a luciferase assay. As shown in Fig. 6G, TO significantly induced expression of the rat POMC gene promoter in AtT-20 cells as well as in GH3 cells, and the response elements should be located between −106 and −43 bp in the promoter. These results are consistent with those obtained in GH3 cells.
The RXR-α/LXR-α heterodimer bound between −73 and −52 bp (LXRE1) in the rat POMC gene promoter
We employed an oligonucleotide encompassing −73 to −52 bp in the POMC promoter, including the LXRE half-site, and referred to it as LXRE1 (Fig. 7A). We performed EMSAs with the radiolabeled LXRE1 probe. We also employed nonradiolabeled LXRE1 and its mutant (mLXRE1 as indicated in Fig. 7A) oligonucleotides as competitors. In EMSAs, we employed a GAL4-LXR-α fusion protein by in vitro translation from pCMX-GAL4-N-LXR-α to demonstrate a super shifted band of the RXR-α/GAL4-LXR-α heterodimer using an anti-GAL4 antibody. We confirmed that GAL4-LXR-α (pCMX-GAL4-N-LXR-α) activated the rat POMC promoter in both GH3 and AtT-20 cells as did the LXR-α (pSG5-LXR-α) (data not shown). We used LXRE (DR4) in the rat CYP7A1 gene promoter as a positive control probe as we previously reported (15, 16). GAL4-LXR-α formed a heterodimer with RXR-α on both the DR4 and LXRE1 probes (Fig. 7B, lane 5; Fig. 7C, lane 5), and an anti-RXR-α antibody clearly pulled out the heterodimer band on both the DR4 and LXRE1 probes (Fig. 7B, lane 7; Fig. 7C, lane 7). In contrast, mouse normal IgG did not affect the RXR-α/GAL4-LXR-α heterodimerization (Fig. 7B, lane 6; Fig. 7C, lane 6). The anti-GAL4 antibody demonstrated a super shifted band with a smear of the RXR-α/GAL4-LXR-α heterodimer on both the DR4 and LXRE1 probes (Fig. 7B, lane 8; Fig. 7C, lane 8). Furthermore, cold competitors abolished the heterodimerization in a dose-dependent manner (Fig. 7C, lanes 12 and 13), whereas a mutant cold competitor did not (Fig. 7C, lane 14), indicating that the RXR-α/GAL4-LXR-α heterodimer specifically binds to LXRE1. We also performed EMSAs with a radiolabeled mLXRE probe and found that RXR-α/GAL4-LXR-α heterodimer did not bind to the mutant probe (data not shown). As negative controls, we performed experiments using only radiolabeled probe and each antibody on its own and found no shifted bands (Fig. 7B, lanes 9–11; Fig. 7C, lanes 9–11). We found that neither the GAL4-LXR-β homodimer nor RXR-α/GAL4-LXR-β heterodimer bound to the LXRE1 probe (data not shown). These lines of data lead us to conclude that the RXR-α/LXR-α heterodimer specifically bound to the LXRE1 site.
Fig. 7.

EMSAs demonstrated that the RXR-α/LXR-α heterodimer bound to a site between −73 and −52 bp in the rat POMC gene promoter. We employed a GAL4-LXR-α construct to demonstrate a supershifted band of the RXR-α/GAL-4-LXR-α heterodimer. Rat POMC gene promoter sequence around the −73 to −52-bp region (A). Bold letters with an arrow indicate the LXRE half-site, and we employed the region referred to as “LXRE1” for the 32P-radiolabeled DNA probe. Underlined bold italic letters indicate the mutation, and mLXRE1 is the mutant form of the LXRE1 probe. B, We employed the LXRE (DR4) site in the rat Cyp7A1 gene promoter as a positive control. C, Values indicate the fold molar excess of nonradiolabeled (cold) oligonucleotides of LXRE1 or mutant LXRE1 (mLXRE1)(lanes 12–14). N, Nonspecific bands; IgG, mouse normal IgG.
LXR-α and RXR-α, but not LXR-β, were recruited to LXRE1 in AtT-20 cells
To examine whether intrinsic LXR-α was recruited to the POMC gene promoter in living cells, we employed chromatin immunoprecipitation (ChIP) assays. For this purpose, we employed an AtT-20 cell line, which is derived from mouse corticotroph. First, we examined the mouse POMC gene promoter (−3000/+7000 bp) in silico (Ensembl Transcript identification nos: ENSMUST00000020990 for mouse and ENSRNOT00000016976 for rat) and found 96% of the mouse promoter sequence (−89 to +130 bp) to be identical to the rat promoter sequence and that the LXRE1 site in the rat promoter was conserved in the mouse promoter (Fig. 8A). We employed two ChIP assays, one conventional and the other quantitative using real-time PCR. As shown in Fig. 8B, the conventional ChIP assay demonstrated that both LXR-α and RXR-α were clearly recruited to LXRE1, whereas anti-LXR-β antibody showed only background levels as did nonspecific mouse IgG (Fig. 8B, middle panel). On the other hand, a set of primers for the negative control (N.C.)(+5470 to +5645 bp in exon 3 of the mouse POMC gene) did not demonstrate any detective bands (Fig. 8B, lower panel). We confirmed that exon 3 of the mouse POMC gene does not contain a LXRE half-site. We also performed quantitative ChIP assays using real-time PCR and found that LXR-α and RXR-α, but not LXR-β, were significantly recruited to LXRE1 compared with mouse normal IgG and LXR-β (Fig. 8C).
Fig. 8.

ChIP assays demonstrated that LXR-α, but not LXR-β, together with RXR-α, was recruited to LXRE1. Comparison of the sequence around the transcriptional start site (−90 to +20 bp) between the rat and mouse POMC gene promoter (A) revealed that the rat LXRE1 is well conserved in the mouse promoter. Bold letters (A) indicate the transcription start site. The two sets of primers (for conventional and quantitative real-time PCR) for LXRE1 and for negative control (N.C.) are indicated. ChIP assay results were evaluated by conventional PCR and gel electrophoresis (B) or quantitative real-time PCR (C). Representative results with conventional PCR are shown in Fig. 8B. For quantitative real-time PCR (Fig. 8C), relative values (mean ± sem; n = 5) normalized by input levels compared with those obtained with IgG are shown (Fig. 8C). An asterisk indicates that the difference between the denoted pairs is significant at a confidence level of P < 0.05 (*) by Student’s t test.
LXR-α knockdown diminished the POMC gene promoter’s activation by oxysterol
Next, we employed LXR-α small interfering RNA (SiRNA) to reduce the intrinsic LXR-α expression in GH3 cells and examined whether the POMC gene promoter was then activated by the LXR ligand on knockdown of LXR-α. We already confirmed that the anti-LXR-α and anti-LXR-β antibodies employed in this experiment could recognize each intrinsic LXR isoform in GH3 cells (Fig. 6A). SiRNA specific for LXR-α reduced LXR-α expression by 55% compared with control SiRNA (Fig. 9A), whereas LXR-β expression was not disturbed (data not shown). The knockdown cells were subjected to luciferase assays using the POMC gene promoter in pGL4 (−706/+64 bp). We used the lipofection method to induce SiRNA followed by cotransfection of the POMC gene promoter construct; however, the transfected cells, unexpectedly, did not survive the administration of TO. Therefore, we decided to employ 22(R) hydroxy(OH)cholesterol (CH) as an alternative ligand for LXR-α (Fig. 9B). As expected, the ligand could not fully activate the POMC gene promoter in the LXR-α knockdown cells (Fig. 9B). With this experiment, we also found that LXR-β did not compensate for LXR-α to activate the POMC gene promoter.
Fig. 9.

The reduced expression of endogenous LXR-α diminished ligand-dependent activation of the POMC gene promoter. A, The effect of SiRNA against LXR-α. SiRNA-specific against LXR-α was transfected into GH3 cells using the lipofection method. The SiRNA reduced the protein level of LXR-α by about 55%. The protein levels of LXR-α were normalized by cyclophilin. B, After SiRNA transfection into GH3 cells, the knockdown cells in a 12-well format were cotransfected with the rat POMC gene promoter (−706/+64 bp) in pGL4 constructs and then subjected to luciferase assays. 22(R)(OH)CH (10 μm) was employed as the LXR agonist, because TO901317 was toxic to the knockdown GH3 cells and caused complete cell death. Ethanol (100%) was used as a vehicle. Relative luciferase activity (mean ± sem; n = 3) represents the luciferase activity of the reporter construct (−706/+64 pGL4) in the absence of 10 μm of 22(R)(OH)CH and SiRNA. *, The difference between the denoted pairs is significant at a confidence level of P < 0.01 by Student’s t test.
Activated LXR-α antagonized the repression of the POMC gene promoter by dexamethasone (DEX)
DEX strongly inhibits the HPA axis, resulting in the complete suppression of POMC gene expression. To examine whether the pathway by which LXR-α induces POMC gene expression is physiologically relevant or not, we evaluated the effect of TO under conditions of DEX administration. As shown in Fig. 10, TO clearly activated the rat POMC gene promoter in AtT-20 cells treated with DEX. Because LXR-α gene expression is dominant in AtT-20 cells (Fig. 6F), these results suggested that activated LXR-α by TO antagonized the suppression of the POMC gene promoter by DEX. Thus, the induction of POMC gene transcription by activated LXR-α could be an alternative pathway for regulation of the POMC gene.
Fig. 10.

Activated LXR-α antagonized repression of the POMC gene promoter’s induction by DEX
AtT-20 cells in a six-well format were transfected with the rat POMC gene promoter (−706/+64 bp) in a pGL4 construct (2 μg per well). The transfected AtT-20 cells were pretreated with 10−8 m DEX overnight and then treated for 16 h with either DMSO or 10−8 m TO before being harvested and subjected to luciferase assays. Relative luciferase activity (mean ± sem; n = 3) represents the luciferase activity of the reporter construct (−706/+64 pGL4) in the absence of 10−8 m TO901317 or 10−8 m DEX. ***, The difference between the denoted pairs is significant at a confidence level of P < 0.001 by Student’s t test.
Discussion
In the current study, we demonstrated that LXR-α positively regulates POMC gene expression in the pituitary gland at the transcriptional level. First, we fed a 2% cholesterol diet or administered TO to C57/B6 mice. Intriguingly, both treatments increased plasma ACTH levels and POMC gene expression in the pituitary gland, resulting in an increase in serum corticosterone levels. Because oxysterol is a derivative of cholesterol, as the total cholesterol concentration increases, more oxysterol is produced (17). We speculated that oxysterol could be a ligand for LXRs and increased plasma ACTH levels and POMC gene expression in the pituitary gland. In fact, the administration of TO increased serum total cholesterol levels more than did the cholesterol diet. Thus, there is a possibility that, in addition to the direct activation of LXR-α by TO, oxysterol induced by TO administration could activate LXR-α. We also demonstrated that TO increases POMC gene expression in the anterior pituitary lobe but not in the intermediate lobe (Fig. 5, B and C). We speculate that this increase is due to exclusive LXR-α expression in the anterior pituitary lobe (Fig. 2). Therefore, the increase in POMC gene expression and ACTH content in the whole pituitary represent an increase in the anterior pituitary lobe. Consistent with this finding, the ACTH-immunoreactive cells were increased in number in the anterior lobe by the administration of TO (Fig. 4A). However, the molecular mechanism by which LXR-α is specifically expressed in the anterior lobe is yet to be elucidated and should be examined further.
Next, we obtained evidence of LXR gene expression in the mouse pituitary and found, unexpectedly, that LXR-α was more highly expressed than LXR-β at the protein level. Analysis of sections with double immunostaining revealed LXR-α to be present in almost all the ACTH-immunoreactive cells (92%) indicating the localization of LXR-α in the nuclei of corticotroph cells. On the other hand, there is a subset of LXR-α immunoreactive cells other than corticotroph cells, suggesting that LXR-α could be present in other pituitary cells such as somatotroph, lactotroph, thyrotroph, and gonadotroph. However, in the current study, no other anterior pituitary hormone gene was affected by TO901317. Based on these results, we speculate that LXRs, especially LXR-α, regulate POMC gene expression in the pituitary gland. Interestingly, LXR-β did not activate the POMC promoter. Cummins et al. (10) reported that LXR-α knockout mice did not show any increase in plasma corticosterone levels upon the administration of TO, whereas LXR-β knockout animals still showed an increase in response to an LXR agonist. These findings were consistent with our results showing that LXR-α has a more dominant effect on the POMC gene than LXR-β. Moreover, in this study, the gene expression of LXR-α in AtT-20 cells was more robust than that of LXR-β (Fig. 6F) suggesting LXR-α to predominate in corticotroph cells.
Because the HPA axis fine tunes POMC gene expression and ACTH production in the pituitary gland in vivo, we employed a mouse pituitary cell line (AtT-20) and administered TO to the cells to determine whether a LXR agonist could independently induce POMC gene expression. As shown in Fig. 5D, TO significantly increased the expression of the POMC gene in the AtT-20 cells. Nilsson et al. (11) performed a similar experiment using AtT-20 cells and reported that TO induced ACTH production. Their results are consistent with ours.
They also reported that LXRs negatively regulate 11β-HSD1 gene expression in the pituitary gland (18) and therefore that activated LXRs repress 11β-HSD1 gene expression and decrease active glucocorticoid levels in the pituitary gland, resulting in an increase in the secretion of ACTH. In short, they concluded that LXR agonists indirectly regulate POMC gene expression, and the increased ACTH production would increase serum corticosterone levels (11). However, in a recent study, TO901317 administered to dexamethasone (DEX)-treated wild-type C57/B6 mice significantly increased plasma corticosterone levels (10). As dexamethasone increases 11β-HSD1 activity and gene expression (19), the secretion of ACTH in the pituitary should be suppressed. In the current study, we obtained similar data and confirmed that TO activated the rat POMC gene promoter under conditions of DEX treatment, suggesting that activated LXR-α overcomes the suppression of POMC gene expression by dexamethasone. Furthermore, we also evaluated 11β-HSD1 gene expression in the mouse pituitary gland and found no differences among four treatments, including the administration of a LXR agonist (Fig. 5E). Therefore, based on our original findings and the discrepancies among various recent reports, we concluded that it is unlikely that the elevated plasma ACTH levels in LXR agonist-treated animals are due to decreased gene expression of 11β-HSD1, and that LXR-α directly regulates POMC gene expression and ACTH production, resulting in increased corticosterone production. Because TO901317 is a potent ligand of the pregnane X receptor (PXR) (20) and activation of PXR markedly increased plasma corticosterone levels by inducing CYP3A11 gene expression (21, 22, 23), one has to discuss PXR. Zhai et al. (22) demonstrated that in a PXR transgenic mouse, plasma corticosterone levels were increased markedly, and plasma ACTH levels were increased modestly but not significantly. Therefore, in light of the increase in plasma corticosterone levels on the administration of TO901317, we should take account of PXR function. It may be of interest to examine the differences between PXR and LXR-α in regulating the HPA axis.
We thought it suitable to employ LXR-α/β knockout mice for the current study, but unfortunately, they were not available to us. Actually, two groups who examined LXR-α/β knockout mice reported that LXRs regulate glucocorticoid production in the adrenal gland; however, the reports have many discrepancies (10, 11). Both reports (10, 11) showed that plasma glucocorticoid levels were elevated in the LXR-α/β knockout mice; however, the authors’ conclusions about the mechanism responsible for the phenomenon were totally different. Nilsson et al. stated that the increased levels of glucocorticoid seen in LXR-α/β knockout mice were not supported by decreased levels of 11β-HSD1 resulting in a derepression of ACTH expression, because 11β-HSD1 gene expression was induced in the knockout mice compared with wild-type mice. However, there was no difference in ACTH expression between the LXR-α/β knockout mice and the wild-type mice. They also showed that TO did not raise plasma ACTH levels in the LXR-α/β knockout mice, and we speculate that this was due to lack of LXR-α. They also suggested additional effects of LXRs on the HPA axis. On the other hand, Cummins et al. demonstrated that TO increased steroidogenic acute regulatory protein (StAR) and CYP11A1 gene expression in the adrenal glands of the LXR-α/β knockout mice compared with wild-type mice under DEX-treatment, suggesting that regulation of the HPA axis was not related to the phenomenon. They concluded that the increased basal level of glucocorticoid in the LXR-α/β knockout mice was due to a marked decrease in ABC transporter A1 (ABCA1) and a derepression of StAR expression. These results suggest a specific role for LXR in steroidogenesis in the adrenal gland, independent of its role in the pituitary gland. Actually, Nilsson et al. demonstrated that both StAR and Cyp11A1 gene expression were repressed in H295R cells derived from a human adrenal cortex carcinoma upon the administration of another LXR synthetic agonist, GW3965, whereas Cummins et al. showed that StAR gene expression in H295R cells was induced by TO. Nilsson et al. speculated that this discrepancy was due to the difference of LXR ligands; however, we think it is unlikely that similar agonists exert totally different effects on the same gene in the same cells. Therefore, we believe that the roles of LXRs in adrenal glands have yet to be clarified.
Cummins et al. measured plasma ACTH levels in wild-type, LXR-α knockout (−/−), LXR-β knockout (−/−), and LXR-α/β knockout mice and found no significant differences in basal levels across the genotypes. By contrast, Nilsson et al. reported that plasma ACTH levels were significantly higher in LXR-α/β knockout mice than wild-type mice. We speculate that these various discrepancies in the effects of LXR on the HPA axis are due to the individual roles of LXRs both in the adrenal gland and in the pituitary. Therefore, to analyze LXR-α/β knockout mice to elucidate LXR roles in the HPA axis would have been too complicated. Thus, for the purpose of analyzing LXR-specific roles in either the adrenal gland or the pituitary gland, one should generate conditional LXR-α/β knockout mice in which LXR genes are deleted in a tissue-specific manner.
In the present study, we clearly demonstrated that activated LXR-α induced POMC gene expression in the pituitary gland (especially in the anterior lobe) at the transcriptional level using wild-type mice. Under conditions of DEX treatment, the LXR agonist induced POMC gene transcription, suggesting that the regulation of the POMC gene by LXR-α is physiologically relevant and could be an alternative pathway for POMC mRNA expression.
We demonstrated that the RXR-α /LXR-α heterodimer was recruited and bound to the LXRE1 site in the rat POMC gene promoter. LXRE1 contains the LXRE half-site (AGGTCA). Based on our mutational study, we propose that AGGTCACGTCCAAGGC is a novel LXRE forming a DR-4 motif; however, as EMSA showed, the heterodimer bound much more weakly to the LXRE1 site than to the canonical LXRE (DR4) site. The RXR-α /LXR-β heterodimer did not bind or was not recruited to the LXRE1 site, perhaps explaining why LXR-β did not induce expression of the rat POMC gene promoter. Although LXR-α and LXR-β are similar in structure, they differ in tissue distribution and gene regulation (4, 5, 10, 16, 24, 25, 26). Therefore, we conclude that LXRE1 is an LXR-α-specific binding site. Interestingly, the LXRE1 site and its flanking regions in the rat POMC promoter (−86 bp to −33 bp) are well conserved in the mouse promoter (−86 bp to −33 bp) (Fig. 8A). ChIP assays using the AtT-20 cell line demonstrated that LXR-α was specifically recruited to the LXRE1 site, suggesting that this recruitment was physiologically relevant.
Both LXR-α and LXR-β were expressed in GH3 cells at the protein level (Fig. 6A), and the reduction of intrinsic LXR-α protein expression by RNA interference (RNAi) significantly attenuated the induction of the POMC gene promoter (Fig. 9B). This proved that endogenous LXR-α was used to activate the POMC promoter and indicated that LXR-β did not compensate for LXR-α in terms of function. The results of the ChIP assays and RNAi experiments supported the finding that activated LXR-α physiologically induces POMC gene expression in the pituitary gland.
The current study revealed that LXR-α positively regulates POMC gene expression at the transcriptional level, and this is an alternative pathway to regulate the HPA axis. The physiological meaning of this pathway remains to be elucidated; however, it is becoming clear that LXR-α plays a pivotal role in steroid metabolism and in regulating the HPA axis (10, 11, 12).
We speculate that cholesterol itself could be a modulator of POMC gene expression through LXR-α in the pituitary. This suggests the existence of cross talk between lipid metabolism and neuroendocrinology, and LXR-α should play an important role in this cross talk. One should keep this cross talk in mind from a clinical point of view. First, oxysterol derived from cholesterol could regulate plasma ACTH and serum glucocorticoid levels, which act as a counterregulatory hormone against glucose tolerance. Second, LXR-α modulators (selective agonists, antagonists, etc) could be new therapeutic agents in the treatment of psychological disorders as well as atherosclerosis and type 2 diabetes. Thus, we believe that the results of this study shed light on LXR-α as a novel target for clinical applications.
Materials and Methods
Animals
Male C57/BL6 mice (4 wk of age) were employed for the study. All aspects of animal care were approved by the Institutional Animal Care and Use Committee of Gunma University Graduate School of Medicine (Maebashi, Gunma, Japan). Basically, animals were maintained on a 12-h light, 12-h dark schedule (lights on at 0600 h) and fed laboratory chow as indicated and given water ad libitum. C57/B6 mice were divided into four groups: the ND group was fed a normal diet, the CD group was fed a 2% cholesterol-containing diet for 2 wk, and the TO and Sham groups were injected daily with 50 mg/kg/d of TO901317 (TO; Cayman Chemical Co., Inc., Ann Arbor, MI) and vehicle (DMSO) for 2 wk, respectively. The number of mice receiving each treatment is indicated in the figure legends. Animals received daily handling to reduce their stress for 2 wk at 0800 h (during the light cycle). The mice were killed within 1 min of initial handling by prompt decapitation at 0800 h. Pituitaries obtained from the animals were separated into neurointermediate (intermediate) and anterior lobe. The intermediate lobe was carefully dissected away from the anterior lobe to prevent any possibility of cross contamination (27, 28). The Plasma ACTH levels were determined using an ELSA ACTH kit (CIS bio international, France), and serum corticosterone levels were determined using an Immuchem Double Antibody Corticosterone RIA kit (MP Biochemicals, Orangeburg, NY). Serum total cholesterol levels were measured with a Determiner TC555 kit (Kyowa Medex, Tokyo, Japan) (29). Measurements of pituitary ACTH contents were performed as described previously with minor modifications (30, 31, 32). Briefly, after decapitation, the pituitary gland was homogenized in ice-cold 0.1 n HCl (1 ml/gland). The homogenates were centrifuged at 12,000 × g for 30 min. The acid extracts were then lyophilized and reconstituted with dilution buffer provided with the ELSA ACTH kit (CIS bio international) for RIA. The results were normalized to tissue protein levels.
Plasmids
The rat POMC gene promoter (−706/+64 bp) plasmid, which contained the region from −706 to +64 bp of the rat POMC gene, was kindly provided by Dr. Malcolm J. Low [Oregon Health and Science University. (Portland, OR) (33, 34)]. Mouse LXR-α and human RXR-α in pSG5 used previously by us were employed in the current study as well (16). Mouse LXR-β in pSG5 was generated by RT-PCR from mouse liver total RNA using 5′-GTGTGGATCCTGGAACAAGCAGGCTG-3′ as a sense primer and 5′-GTGTGGATCCTACTCGTGCACATC-3′ as an antisense primer. A BamHI restriction enzyme site was introduced into the primer sequences so that the PCR product could be subcloned into the pSG5 vector. The deletion constructs of the rat POMC gene promoter were generated using PCR site-directed mutagenesis (35). We prepared GAL4-LXR-α and GAL4-LXR-β constructs in the pCMX-GAL4-N vector containing a GAL4 DNA-binding domain by PCR using mouse LXR-α and LXR-β in pSG5 as templates. A sense primer to prepare GAL4-LXR-α was 5′-GTGTGAATTCATGTCCTTGTGGCTG-3′, and an antisense primer was 5′-GTGTGGATCCTCACTCGTGGACATC-3′ to introduce EcoRI and BamHI restriction enzyme sites in the PCR product to be subcloned into the pCMX-GAL4-N vector.
The primer sequence to prepare GAL4-LXR-β was 5′-GTGTGGATCCATGTCTTCCCCCACA-3′ for sense primer and 5′-GTGTGGATCCCTACTCGTGCACATC-3′ as an antisense primer. A BamHI restriction enzyme site was introduced into the primer sequences so that the PCR product could be subcloned into the pCMX-GAL4-N vector. All PCR-generated constructs were verified by sequencing the DNA.
Transfections and luciferase assay
For the luciferase assay, we employed GH3 cells derived from the rat pituitary somatotroph or AtT-20 cells derived from the mouse pituitary corticotroph. Two micrograms of the reporter plasmid and 0.2 μg of LXR-α or -β in pSG5 were transfected per well of a six-well plate into GH3/AtT-20 cells using the calcium-phosphate method. Cultures were treated 16 h after transfection with serum-free DMEM for 8 h in the absence or presence of 1 μm TO or 10 μm 22(R) hydroxycholesterol. All transfections were equalized for the same total amount of expression vector using an empty vector as needed. The whole-cell extracts of the GH3/AtT-20 cells transfected with LXR-α or -β in pSG5 were analyzed by Western blotting using anti-LXR-α or -β antibody revealing the identical protein expression of both LXR-α and LXR-β (data not shown). Data are presented as fold basal activation expressed as fold induction over vector (pSG5) in the absence of ligand stimulation ± sem. Luciferase activity was expressed as arbitrary light units per microgram of cellular protein. All transfection experiments were repeated at least twice in triplicate. In the dexamethasone (DEX; Sigma-Aldrich, St. Louis, MO) experiment, AtT-20 cells were plated in a six-well format and transfected with the rat POMC gene promoter (−706/+64 bp) in a pGL4 construct (12 μg/plate). The transfected AtT-20 cells were pretreated with 10−8 m DEX overnight, then subsequently treated for 16 h with either DMSO or 10−8 m TO before the harvest, and subjected to luciferase assays.
Western blotting
For analysis of the protein expression of LXR-α and -β, Western blotting of whole-cell lysates from GH3 cells or mouse liver tissue was performed using rabbit anti-LXR-α and anti-LXR-β polyclonal antibodies (H-144: sc-13068, N-20: sc-1001, respectively; Santa Cruz Biotechnology, Inc., Santa Cruz, CA). Anticyclophilin A (07-313; Upstate Biotechnology, Inc., Lake Placid, NY) was employed as a control.
Real-time RT-PCR
Real-time RT-PCR assays were performed using an Applied Biosystems 7700 sequence detector (Applied Biosystems, Foster City, CA). Briefly, total RNA was extracted from the mouse tissues and AtT-20 cells using ISOGEN (Nippon Gene, Tokyo, Japan). The 1 μg of the total RNA of pituitary, anterior lobe, or intermediate lobe or of AtT-20 cells was reverse transcribed with random hexamers using a Taqman Reverse Transcription Reagent kit (Applied Biosystems) according to the manufacturer’s protocol. Mouse POMC gene mRNA expression was analyzed using a probe and primers from previously developed assays for mouse POMC (Taqman probe no. Mm00435874_m1, Applied Biosystems). Mouse LXR-α and LXR-β mRNA levels were analyzed using probes and primers from previously developed assays for mouse LXR-α and LXR-β [Taqman probe no. Mm00443454_ml for LXR-α (Nr1h3) and no. Mm00437262_ml for LXR-β (Nr1h2), Applied Biosystems]. Mouse 11β-HSD1 mRNA levels were analyzed using probes and primers from previously developed assays for 11β-HSD1 (Taqman probe no. Mm00476182_ml for 11β-HSD1, Applied Biosystems). The CT value of each sample was between 26 and 33 in standard 40 cycles. The PCR results were normalized to mouse glyceraldehyde-3-phosphate dehydrogenase (GAPDH) expression using a probe and primers from previously developed assays for mouse GAPDH (no. Mm99999915_g1, Applied Biosystems). The number of mice or samples is indicated in the figure legends. In the CHX (Sigma-Aldrich; no. C4859) experiment, AtT-20 cells were treated with either DMSO or 50 μm CHX and simultaneously treated from 0 h to 24 h with either DMSO or 10−7 μm TO901317 before the harvest. Then, POMC mRNA levels in AtT-20 cells were analyzed using a Taqman probe for the mouse POMC gene (no. Mm00435874_m1, Applied Biosystems).
EMSAs/gel-shift assays
EMSAs/gel-shift assays were performed as described previously (36). We employed GAL4-LXR-α and GAL4-LXR-β constructs in the pCMX-GAL4-N vector containing a GAL4 DNA-binding domain. The GAL4-LXR recombinant proteins were synthesized using the TNT T7 Quick Coupled Transcription/Translation System (Promega Corp., Madison, WI). Human RXR-α recombinant protein was also synthesized as above. Binding reactions contained 20 mm HEPES (pH 7.6), 50 mm KCl, 12% glycerol, 1 mm dithiothreitol, 1 μg of poly(deoxyinosinic-deoxycytidylic) acid sodium salt, and 4 μl of each of the synthesized nuclear receptors. Double-stranded oligonucleotides (DR4 in rat cholesterol 7α.-hydroxylase: CYP7A1: 5′-TGTTTGCTTTGGTCACTCAAGTTCAA-3′, LXRE1 in the rat POMC gene promoter: 5′-CCAGGAAGGTCACGTCCAAGGC-3′), were labeled with [α-32P] deoxy-CTP by the fill-in reaction using the Klenow fragment of DNA polymerase. Binding reactions were performed at room temperature for 30 min, and the protein-DNA complexes were resolved on a 5% polyacrylamide gel in 1× TBE (45 mm Tris-base, 1 mm EDTA). For competition experiments, a 20- to 100-fold molar excess of cold oligonucleotide (wild type or mutant) was included as indicated in the figure. For supershift experiments, 1.2 μg of rabbit anti-RXR-α polyclonal antibody (sc-774; Santa Cruz Biotechnology) (16), or rabbit anti-GAL4 polyclonal antibody [GAL4 (DNA binding domain): RK5C1:sc-510; Santa Cruz Biotechnology]. was added and the mixture was incubated for an additional 30 min at room temperature. As a negative control, normal mouse IgG (sc-2025, Santa Cruz Biotechnology) was used. All gel-shift assays were repeated at least three times with similar results, and a representative result is shown.
ChIP assay
ChIP assays were performed as we previously reported using a kit from Upstate Biotechnology (Lake Placid, NY) (35). The AtT-20 cells were incubated in medium containing 10% resin-charcoal double-stripped fetal bovine serum. After incubation overnight, formaldehyde (37%) was directly added to the culture at a final concentration of 1% , and the cells were incubated for 15 min at room temperature to cross-link protein to DNA. The whole-cell extracts were pelleted and resuspended in 500 μl of lysis buffer [1% sodium dodecyl sulfate/50 mm Tris-HCl (pH 8.1)/10 mm EDTA/1 mm PMSF/1 μg/ml aprotinin] for 10 min at 4 C. The lysate was sonicated three times with 10-sec pulses using a sonicator set at 70% of maximum power to reduce DNA length to between 200 and 1000 bp. Chromatin solution (500 μl) was used for each ChIP assay with 0.6 μg of a rabbit anti-LXR-α or anti-LXR-β polyclonal antibody (S-20: sc-1000×, N-20:sc1001, respectively; Santa Cruz, CA), or rabbit anti-RXR-α polyclonal antibody (sc-774; Santa Cruz Biotechnology). As a negative control, normal mouse IgG (sc-2025; Santa Cruz Biotechnology) was used. We examined the mouse POMC gene promoter sequence (−3000 to +7000 bp) and compared it with the rat sequence in silico (Emsenbl, NCBI). We found that the sequences around the transcriptional start site including LXRE1 are well conserved in both promoters. The primers used for the LXRE1 region between −278 bp and +80 bp for conventional PCR and gel-based evaluation of ChIP results were as follows: forward, 5′-CGCTAAGCCTCTGTCCAGTT-3′; and reverse, 5′-GCTCTCTGGGGACAAAGATG-3′. The predicted PCR product was 359 bp long. Conventional PCR was performed in 50 μl with Platinum high fidelity (Invitrogen) for 30 cycles (annealing temperature of 62 C). For the quantitative real-time PCR evaluation of ChIP results, forward, 5′-TCAGCGGGTCTGTGCTAAC-3′; and reverse, 5′-TCCCTGTCGCTCTTCTCTCT-3′ were used. The predicted PCR product was 192 bp long. The set of primers used for the region between +5470 bp and +5645 bp (negative control) was as follows: forward, 5′-GCTCTTCAAGAACGCCATC-3′; and reverse, 5′-TGAAGATCAGAGCCGACTGT-3′. The predicted PCR product was 176 bp long. For quantitative real-time PCR, we employed the SYBR green system (POWER SYBR GREEN PCR MASTER MIX, Applied Biosystems) using an Applied Biosystems 7700 sequence detector.
We confirmed that the set of the primers for the real-time PCR yielded a single peak in the 40-cycle procedure. Relative values (mean ± se, n = 5) normalized to input levels compared with those obtained with IgG are shown (Fig. 8C). Conventional PCR signals stained with ethidium bromide in 2% agarose gels were scanned with a Molecular Imager FX (Bio-Rad). All ChIP assays were repeated at least three times with similar results, and representative results for conventional PCR and statistical analysis for quantitative real-time PCR are shown.
SiRNA against LXR-α
We purchased SiRNA for rat LXR-α from B-Bridge International, Inc. (Sunnyvale, CA). The sequences of SiRNA for rat LXR-α were as follows: sense, 5′-gcaaggaguuguggaagaTT-3′; antisense, 5′-ucuuccacaacuccguugcTT-3′. Double-stranded RNA for the negative control (Cy3) was also purchased from B-Bridge International, Inc. (catalog no. S5C-0620), and its target sequence was as follows: 5′-atccgcgcgatagtacgta-3′. These double-stranded RNA oligonucleotides were transfected into GH3 cells by the lipofection method (Lipofectamine RNAiMAX, Invitrogen). Briefly, in the 12-well format, 50 pmol of the double-stranded RNA per well was transfected into the GH3 cells. Twenty-four hours after the first transfection, 1 μg of the rat POMC gene promoter (−706 to +64 bp) in pGL4 was transfected into the cells with Lipofectamine 2000 (Invitrogen). Twenty-four hours after the second transfection, we changed the medium and added 10 μm 22(R)(OH)CH dissolved in 100% ethanol. After incubation overnight, luciferase assays were performed.
Immunohistochemical study
Paraffin sections of 4 μm thickness were cut from archival paraffin blocks with a histology representative of the lesion. An immunohistochemical analysis was performed on the sections using the avidin-biotinylated peroxidase complex (ABC) method with the anti-LXR-α or anti-LXR-β polyclonal antibody (H144:sc-13068, N-20:sc1001, respectively) and human ACTH antibody (Dako Corp., Kyoto, Japan) at 1:50. Briefly, paraffin-embedded sections were dewaxed with xylene and incubated with 0.3% hydrogen peroxidase in absolute methanol to block endogenous peroxidase activity. To avoid nonspecific staining, the sections were incubated with 10% normal horse serum for 30 min at room temperature and treated with the primary antibody at 4 C overnight. After intensive washing, the sections were incubated with secondary biotinylated antimouse or rabbit IgG (Vector Laboratories, Inc., Burlingame, CA) for 30 min at room temperature. Finally, the slides were visualized with a solution containing 0.02% 3,3′-diaminobenzidine tetrahydrochloride (Wako Pure Chemicals, Osaka, Japan) and 0.005% H2O2, followed by light counterstaining with hematoxylin.
Double immunostaining was performed to demonstrate the localization of LXR-α in ACTH-immunoreactive cells in the pituitary gland. The procedure was essentially the same as described elsewhere (37, 38). The anterior lobe of the pituitary was employed. The sections were first immunostained with anti-LXR-α antibody. 3,3′-Diaminobenzidine tetrahydrochloride was used for coloration (brown). After elimination of the first antibody by rinsing in 0.1 m glycine solution (pH 2.2) for 20 min three times, the sections were reincubated with ACTH and visualized using 4-chrolo-1-naphthol (colored in dark blue) (Wako Pure Chemicals).
Statistical analyses
The statistical analysis was performed utilizing an ANOVA. Values are expressed as the mean ± sem. The significance of differences between the mean values was evaluated using the unpaired Student’s t test.
Acknowledgments
We thank Dr. Malcolm J. Low (Oregon Health and Science University, Portland, OR) for providing the rat POMC promoter gene (−706/+64 bp) and Drs. Toshiyuki Takeuchi and Masahiro Hosaka (Gunma University Institute for Molecular and Cellular Regulation) for providing AtT-20 cells. We also thank Ms. Machiko Yokota (Department of Human Pathology, Gunma University Graduate School of Medicine) for technical assistance with the immunohistological analysis.
NURSA Molecule Pages:
Ligands: 22α-Hydroxycholesterol | T0901317;
Nuclear Receptors: LXRα | LXRβ.
Footnotes
This work was supported by a grant from the Japan Intractable Disease Research Foundation and Yamaguchi Endocrine Disease Research Foundation (to K.H.).
The authors have nothing to disclose.
First Published Online November 26, 2008
Abbreviations: ABC, Avidin-biotinylated peroxidase complex; ChIP, Chromatin immunoprecipitation; CHX, cycloheximide; DEX, dexamethasone; DMSO, dimethylsulfoxide; DR, direct repeat; GAPDH, glyceraldehyde-3-phosphate dehydrogenase; HPA, hypothalami-pituitary-adrenal gland; 11β-HSD1, 11β-hydroxysteroid dehydrogenase type 1; LXR, liver X receptor; LXRE, LXR-response element; POMC, proopiomelanocortin; PXR, pregnane X receptor; 22(R)(OH)CH, 22(R)hydroxycholesterol; RNAi, RNA interference; SiRNA, small interfering RNA; RXR, retinoid X receptor; StAR, steroidogenic acute regulatory protein; TO, TO90137.
References
- 1.Joseph SB, Castrillo A, Laffitte BA, Mangelsdorf DJ, Tontonoz P2003. Reciprocal regulation of inflammation and lipid metabolism by liver X receptors. Nat Med 9:213–219 [DOI] [PubMed] [Google Scholar]
- 2.Stulnig TM, Steffensen KR, Gao H, Reimers M, Dahlman-Wright K, Schuster GU, Gustafsson JA2002. Novel roles of liver X receptors exposed by gene expression profiling in liver and adipose tissue. Mol Pharmacol 62:1299–1305 [DOI] [PubMed] [Google Scholar]
- 3.Zelcer N, Tontonoz P2006. Liver X receptors as integrators of metabolic and inflammatory signaling. J Clin Invest 116:607–614 [DOI] [PMC free article] [PubMed] [Google Scholar]
- 4.Apfel R, Benbrook D, Lernhardt E, Ortiz MA, Salbert G, Pfahl M1994. A novel orphan receptor specific for a subset of thyroid hormone-responsive elements and its interaction with the retinoid/thyroid hormone receptor subfamily. Mol Cell Biol 14:7025–7035 [DOI] [PMC free article] [PubMed] [Google Scholar]
- 5.Willy PJ, Umesono K, Ong ES, Evans RM, Heyman RA, Mangelsdorf DJ1995. LXR, a nuclear receptor that defines a distinct retinoid response pathway. Genes Dev 9:1033–1045 [DOI] [PubMed] [Google Scholar]
- 6.Repa JJ, Mangelsdorf DJ2000. The role of orphan nuclear receptors in the regulation of cholesterol homeostasis. Annu Rev Cell Dev Biol 16:459–481 [DOI] [PubMed] [Google Scholar]
- 7.Umesono K, Murakami KK, Thompson CC, Evans RM1991. Direct repeats as selective response elements for the thyroid hormone, retinoic acid, and vitamin D3 receptors. Cell 65:1255–1266 [DOI] [PMC free article] [PubMed] [Google Scholar]
- 8.Tamura K, Chen YE, Horiuchi M, Chen Q, Daviet L, Yang Z, Lopez-Ilasaca M, Mu H, Pratt RE, Dzau VJ2000. LXRα functions as a cAMP-responsive transcriptional regulator of gene expression. Proc Natl Acad Sci USA 97:8513–8518 [DOI] [PMC free article] [PubMed] [Google Scholar]
- 9.Bjorkhem I, Diczfalusy U2002. Oxysterols: friends, foes, or just fellow passengers? Arterioscler Thromb Vasc Biol 22:734–742 [DOI] [PubMed] [Google Scholar]
- 10.Cummins CL, Volle DH, Zhang Y, McDonald JG, Sion B, Lefrancois- Martinez AM, Caira F, Veyssiere G, Mangelsdorf DJ, Lobaccaro JM2006. Liver X receptors regulate adrenal cholesterol balance. J Clin Invest 116:1902–1912 [DOI] [PMC free article] [PubMed] [Google Scholar]
- 11.Nilsson M, Stulnig TM, Lin CY, Yeo AL, Nowotny P, Liu ET, Steffensen KR2007. Liver X receptors regulate adrenal steroidogenesis and hypothalamic-pituitary-adrenal feedback. Mol Endocrinol 21:126–137 [DOI] [PubMed] [Google Scholar]
- 12.Chisholm JW, Hong J, Mills SA, Lawn RM2003. The LXR ligand T0901317 induces severe lipogenesis in the db/db diabetic mouse. J Lipid Res 44:2039–2048 [DOI] [PubMed] [Google Scholar]
- 13.Miao B, Zondlo S, Gibbs S, Cromley D, Hosagrahara VP, Kirchgessner TG, Billheimer J, Mukherjee R2004. Raising HDL cholesterol without inducing hepatic steatosis and hypertriglyceridemia by a selective LXR modulator. J Lipid Res 45:1410–1417 [DOI] [PubMed] [Google Scholar]
- 14.Givalois L, Li S, Pelletier G1999. Differential involvement of adrenal and gonadal steroids in anterior and intermediate pituitary pro-opiomelanocortin mRNA expression induced by the endogenous benzodiazepine, octadecaneuropeptide, in adult male rats. J Endocrinol 161:307–316 [DOI] [PubMed] [Google Scholar]
- 15.Hashimoto K, Yamada M, Matsumoto S, Monden T, Satoh T, Mori M2006. Mouse sterol response element binding protein-1c gene expression is negatively regulated by thyroid hormone. Endocrinology 147:4292–4302 [DOI] [PubMed] [Google Scholar]
- 16.Hashimoto K, Matsumoto S, Yamada M, Satoh T, Mori M2007. Liver X receptor-α gene expression is positively regulated by thyroid hormone. Endocrinology 148:4667–4675 [DOI] [PubMed] [Google Scholar]
- 17.Schroepfer Jr GJ2000. Oxysterols: modulators of cholesterol metabolism and other processes. Physiol Rev 80:361–554 [DOI] [PubMed] [Google Scholar]
- 18.Stulnig TM, Oppermann U, Steffensen KR, Schuster GU, Gustafsson JA2002. Liver X receptors downregulate 11β-hydroxysteroid dehydrogenase type 1 expression and activity. Diabetes 51:2426–2433 [DOI] [PubMed] [Google Scholar]
- 19.Low SC, Moisan MP, Noble JM, Edwards CR, Seckl JR1994. Glucocorticoids regulate hippocampal 11β-hydroxysteroid dehydrogenase activity and gene expression in vivo in the rat. J Neuroendocrinol 6:285–290 [DOI] [PubMed] [Google Scholar]
- 20.Mitro N, Vargas L, Romeo R, Koder A, Saez E2007. T0901317 is a potent PXR ligand: implications for the biology ascribed to LXR. FEBS Lett 581:1721–1726 [DOI] [PubMed] [Google Scholar]
- 21.Kliewer SA, Goodwin B, Willson TM2002. The nuclear pregnane X receptor: a key regulator of xenobiotic metabolism. Endocr Rev 23:687–702 [DOI] [PubMed] [Google Scholar]
- 22.Zhai Y, Pai HV, Zhou J, Amico JA, Vollmer RR, Xie W2007. Activation of pregnane X receptor disrupts glucocorticoid and mineralocorticoid homeostasis. Mol Endocrinol 21:138–147 [DOI] [PubMed] [Google Scholar]
- 23.Yanagimoto T, Itoh S, Sawada M, Kamataki T1997. Mouse cytochrome P450 (Cyp3a11): predominant expression in liver and capacity to activate aflatoxin B1. Arch Biochem Biophys 340:215–218 [DOI] [PubMed] [Google Scholar]
- 24.Morello F, de Boer RA, Steffensen KR, Gnecchi M, Chisholm JW, Boomsma F, Anderson LM, Lawn RM, Gustafsson JK, Lopez-Ilasaca M, Pratt RE, Dzau VJ2005. Liver X receptors α and β regulate renin expression in vivo. J Clin Invest 115:1913–1922 [DOI] [PMC free article] [PubMed] [Google Scholar]
- 25.Janowski BA, Grogan MJ, Jones SA, Wisely GB, Kliewer SA, Corey EJ, Mangelsdorf DJ1999. Structural requirements of ligands for the oxysterol liver X receptors LXRα and LXRβ. Proc Natl Acad Sci USA 96:266–271 [DOI] [PMC free article] [PubMed] [Google Scholar]
- 26.Mouzat K, Prod'homme M, Volle DH, Sion B, Dechelotte P, Gauthier K, Vanacker JM, Lobaccaro JM2007. Oxysterol nuclear receptor LXRβ regulates cholesterol homeostasis and contractile function in mouse uterus. J Biol Chem 282:4693–4701 [DOI] [PubMed] [Google Scholar]
- 27.Murphy D, Levy A, Lightman S, Carter D1989. Vasopressin RNA in the neural lobe of the pituitary: dramatic accumulation in response to salt loading. Proc Natl Acad Sci USA 86:9002–9005 [DOI] [PMC free article] [PubMed] [Google Scholar]
- 28.Day R, Schafer MK-H, Watson SJ, Chretien M, Seidah NG1992. Distribution and regulation of the prohormone convertases PC1 and PC2 in the rat pituitary. Mol Endocrinol 6:485–497 [DOI] [PubMed] [Google Scholar]
- 29.Hashimoto K, Cohen RN, Yamada M, Markan KR, Monden T, Satoh T, Mori M, Wondisford FE2006. Cross-talk between thyroid hormone receptor and liver X receptor regulatory pathways is revealed in a thyroid hormone resistance mouse model. J Biol Chem 281:295–302 [DOI] [PubMed] [Google Scholar]
- 30.Dallman MF, Jones MT, Vernikos-Danellis J, Ganong WF1972. Corticosteroid feedback control of ACTH secretion: rapid effects of bilateral adrenalectomy on plasma ACTH in the rat. Endocrinology 91:961–968 [DOI] [PubMed] [Google Scholar]
- 31.Suda T, Tomori N, Tozawa F, Mouri T, Demura H, Shizume K1983. Effects of bilateral adrenalectomy on immunoreactive corticotropin-releasing factor in the rat median eminence and intermediate-posterior pituitary. Endocrinology 113:1182–1184 [DOI] [PubMed] [Google Scholar]
- 32.Patchev AV, Fischer D, Wolf SS, Herkenham M, Götz F, Gehin M, Chambon P, Patchev VK, Almeida OF2007. Insidious adrenocortical insufficiency underlies neuroendocrine dysregulation in TIF-2 deficient mice. FASEB J 21:231–238 [DOI] [PubMed] [Google Scholar]
- 33.Rubinstein M, Mortrud M, Liu B, Low MJ1993. Rat and mouse proopiomelanocortin gene sequences target tissue-specific expression to the pituitary gland but not to the hypothalamus of transgenic mice. Neuroendocrinology 58:373–380 [DOI] [PubMed] [Google Scholar]
- 34.Drouin J, Chamberland M, Charron J, Jeannotte L, Nemer M1985. Structure of the rat pro-opiomelanocortin (POMC) gene. FEBS Lett 193:54–58 [DOI] [PubMed] [Google Scholar]
- 35.Hashimoto K, Yamada M, Monden T, Satoh T, Wondisford FE, Mori M2005. Thyrotropin-releasing hormone (TRH) specific interaction between amino terminus of P-Lim and CREB binding protein (CBP). Mol Cell Endocrinol 229:11–20 [DOI] [PubMed] [Google Scholar]
- 36.Ren Y, Satoh T, Yamada M, Hashimoto K, Konaka S, Iwasaki T, Mori M1998. Stimulation of the preprothyrotropin-releasing hormone gene by epidermal growth factor. Endocrinology 139:195–203 [DOI] [PubMed] [Google Scholar]
- 37.Yokoo H, Sasaki A, Hirato J, Nakazato Y1998. Immunohistochemical characterization of two novel monoclonal antibodies that recognize human perivascular cells of the central nervous system and macrophage subsets. Pathol Int 48:678–688 [DOI] [PubMed] [Google Scholar]
- 38.Miyanaga T, Hirato J, Nakazato Y2008. Amplification of the epidermal growth factor receptor gene in glioblastoma: an analysis of the relationship between genotype and phenotype by CISH method. Neuropathology 28:116–126 [DOI] [PubMed] [Google Scholar]