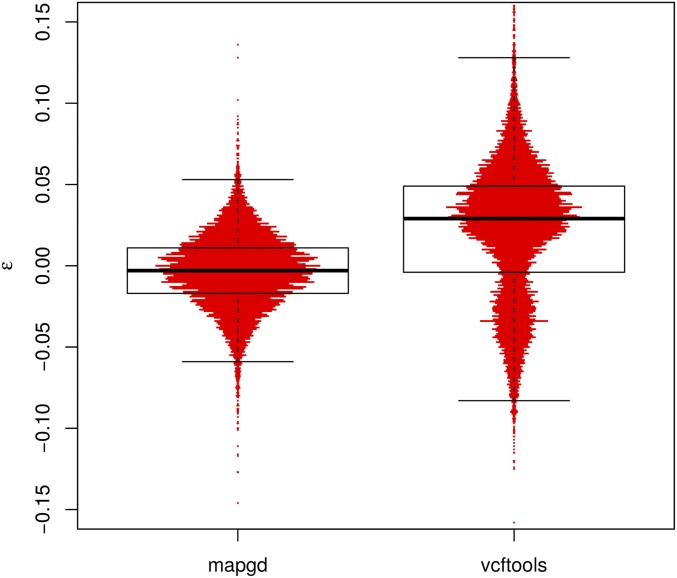
Figure 3.
Violin plots of the errors (ε) of allele-frequency estimates from the programs mapgd and VCFtools. The horizontal width of the red bars represents the frequency of observations with the corresponding values of ε. The black box shows the median (heavy black line), boundaries of the upper and lower quartile (so that 50% of all errors are contained within the box), and the whiskers denote observations within 1.5 interquartile range of the upper and lower quartiles. Results from estimates of a population of 98 individuals with 3× coverage. Alleles are drawn from a neutral spectrum. Allele frequencies in VCFtools are calculated by the VCFtools –freq command.

