Figure 2.
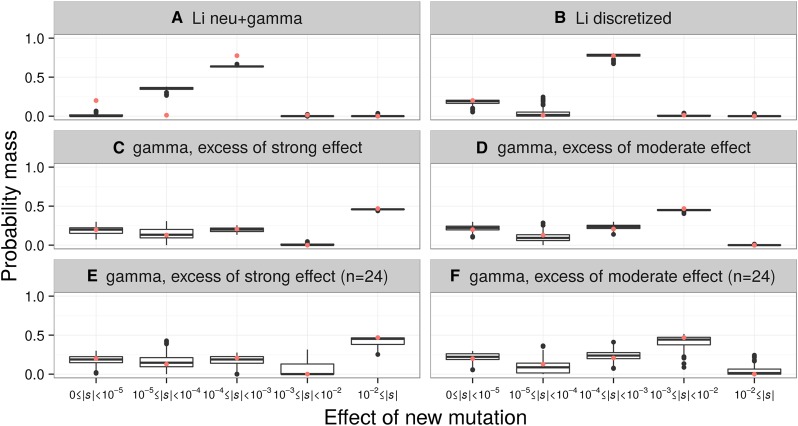
The discrete DFE can recover the approximate form of the DFE from simulated data. The distributions of the proportions of mutations with different selective effects, as inferred by the discrete DFE for 100 simulated data sets, are shown. Each simulation set assumed the demographic model fit to the LuCamp synonymous SFS. A red point depicts the true proportions of the simulated DFE. The true DFE for each set is: (A) the continuous neutral+gamma distribution of Li et al. (2010) (pneu = 0.2, α = 4, β = 1.065 × 10⁻⁴), (B) the discretized version of that distribution, (C–F) a gamma DFE (α = 0.215, β = 567.1), but where (C and E) the mass of the 10−3 ≤ |s| < 10−2 bin was added to the 10−2 ≤ |s| bin, and (D and F) where the mass of the 10−2 ≤ |s| bin was added to the 10−3 ≤ |s| < 10−2 bin. The data sets simulated for (C) and (D) had sample sizes of n = 2596 chromosomes, while the data sets for (E) and (F) had sample sizes of n = 24 chromosomes.

