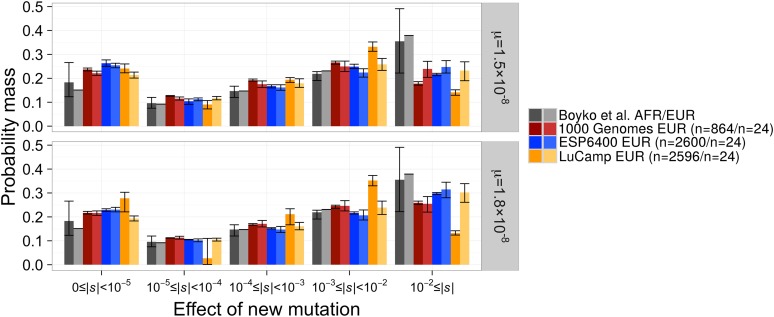
Figure 4.
The distribution of selection coefficients of new mutations under our best-fit DFEs compared to Boyko et al. (2008). Results are presented for the best-fit DFE to each full data set and the best-fit DFE when the data were projected down to n = 24 chromosomes. C.I.’s were estimated by Poisson resampling the nonsynonymous SFS and fitting a DFE 200 times. C.I.’s for the DFE fit to the Boyko et al. (2008) European data set were unavailable. Note that our models predict more nearly neutral mutations (0 ≤ |s| < 10−5) and fewer strongly deleterious mutations (10−2 ≤ |s|) than Boyko et al. (2008), across all mutation rates. Top panel denotes our favored mutation rate while the bottom panel denotes the mutation rate used by Boyko et al. (2008). See Figure S5 in File S1 for a comparison of the population-scaled selection coefficients (2Ns).

