

Abstract
During development, many neurons display calcium-dependent migration, but the role of this messenger in regulating gene expression leading to this event has not yet been elucidated. Among the decoders of calcium signals is calcineurin, a Ca2+/calmodulin serine/threonine phosphatase that has been involved in both short-term and long-term cellular changes. By using immortalized GnRH-secreting neurons, we now show that, in vitro, Ca2+-dependent gene expression, proceeding via calcineurin and the transcription factor nuclear factor of activated T cells, is a key player controlling the chemomigratory potential of developing GnRH-secreting neurons. Furthermore, our data highlight the switch nature of this phosphatase, whose activation or inactivation guides cells to proceed from one genetic program to the next.
CALCINEURIN IS A Ca2+/calmodulin-dependent phosphatase that acts downstream of Ca2+ mobilization to induce short-term and long-term changes (1). Calcineurin is highly abundant in the brain, and its role in short-term neuronal events, i.e. regulation of the phosphorylation status of key proteins, has been well investigated (2). Calcineurin-induced gene expression changes have been shown to be crucial in a number of models, including T lymphocytes, heart, muscle, keratinocytes, and more recently, β-pancreatic acinar cells (3), but in the brain this aspect has so far been given less consideration. Calcineurin and its downstream transcription factor nuclear factor of activated T cells (NFAT) have been linked to changes in gene expression in hippocampal neurons (4) and cerebellar granule cells (5) in response to electrical activity and to neurotrophic factors (6, 7). In cerebellar granule cells, for example, it induces significant changes in gene expression patterns in proteins involved in Ca2+ homeostasis and in glutamatergic transmission (8, 9). It has also been shown that this pathway is required for the stimulation of axonal outgrowth by neurotrophins and netrins (7). Furthermore, an isoform of calcineurin has been linked to schizophrenia both in human association studies (10) and in mouse experiments (11), and NFAT dysregulation has been postulated to be linked to some of the neurological features of Down’s syndrome (12). Two recent microarray experiments have also suggested that calcineurin might be key in the switching between gene expression programs in cerebellar granule neurons (13, 14), although no functional data were reported.
It is well established that calcium signals are crucial during migration (15), but based on the microarray observations described above, we felt it necessary to establish whether the Ca2+/calcineurin/NFAT pathway might play a role upstream of this behavior, by either priming or inhibiting the migratory potential of neurons. To elucidate this, we employed an immortalized neuroendocrine cell line, GN11, that has been well characterized as a model for migratory neurons (16). GnRH-secreting neurons, like olfactory neurons, originate in the olfactory placode (embryo stage E11.5 in mouse), which will later develop into the olfactory epithelium. During development, GnRH neurons migrate into the forebrain to reach their final septohypothalamic localization. GN11 cells were first obtained from the olfactory bulb and have been found to retain the phenotypic characteristics of immature GnRH neurons (16), thereby showing high migratory activity in vitro. As a comparison, we also employed GT1-7 cells, which were first obtained from the hypothalamus and retain the characteristics of nonmigrating mature GnRH-neurons.
We now show that in migratory GN11 neurons, unlike in GT1-7 neurons, basal cytosolic calcium is sufficient to activate calcineurin, and in turn this activates the transcription factor NFAT. Chronic inhibition of either calcineurin or NFAT decreases significantly the ability of cells to undergo chemomigration.
RESULTS AND DISCUSSION
To establish whether calcineurin plays a role in the migration of GN11 cells, we incubated cells with the specific inhibitors FK506 (100 nm) or CsA (1 μm) for 48 h and then performed microchemotaxis (chemomigration) assays using the Boyden’s chamber. Such an incubation resulted in a significant reduction in migration when 1% fetal calf serum (FCS) was used as chemoattractant (16) (Fig. 1A). Cells that were not preincubated with inhibitors but that were acutely exposed to the inhibitors only during the migration assay (3 h) did not display any difference compared with control (Fig. 1A). Our data therefore suggest that calcineurin does not play a direct role in migration itself, but its chronic inhibition disrupts the capacity of cells to undergo this process. Furthermore, when a time course of preincubation was performed with FK506, a correlation between time of exposure and migration emerged (Fig. 1B). Rapamycin, a structural analog of FK506 devoid of activity on calcineurin, also had a significant effect on migration, although the extent was significantly inferior to that displayed by FK506 or cyclosporin A. Although we did not pursue this further, rapamycin has as its main target the protein mammalian target of rapamycin (mTOR), and it is not unlikely that this, or other pathways, might also control migration.
Fig. 1.

Chronic, But Not Acute, Inhibition of Calcineurin Inhibits Chemomigration
A, Effect of acute (white bars) or chronic (black bars) treatment of GN11 cells with FK506 (100 nm; n = 54 from nine independent experiments), CsA (1 μm; n =18 from three independent experiments) or rapamycin (1 μm; n =24 from four independent experiments) on migration. Cells were pretreated for 48 h and allowed to migrate for 3 h. Compounds were added either in the first period (48 h) or in the second (3 h). B, Time course of preincubation with FK506 (100 nm) on migration (n =18 from three separate experiments). Experimental protocol was identical to that outlined in A, but preincubation time was varied as depicted in the figure. Values are mean ± sem. *, P < 0.01; #, P < 0.05 compared with respective controls using one-way ANOVA followed by Tukey’s test.
The change in migratory behavior of cells treated with FK506 or CsA could not be attributed to gross morphological changes because phalloidin staining did not reveal qualitative or quantitative differences between control cells and those treated with calcineurin inhibitors (Fig. 2). Furthermore, cell viability and proliferation were not affected by 48 h treatment with these compounds as measured by the MTT assay (control, 100 ± 6%; 100 nm FK506, 90 ± 4%; 1 μm CsA, 91 ± 2%). On the other hand, although rapamycin did not have an effect on viability and proliferation (91 ± 2%), it did show an effect on GN11 morphology, namely cells appeared enlarged and flattened and had taken on a more rounded shape. Last, it has been previously reported that GN11 cells might not be a homogeneous population (17) and that only 80–90% of cells are GnRH positive. We therefore analyzed whether FK506 might select only the positive or negative population for cell growth. This was not the case, and in our population, all control and FK506-treated cells were GnRH positive.
Fig. 2.

Inhibition of Calcineurin Does Not Change Morphology of GN11 Cells
Cells were treated with FK506 (100 nm), CsA (1 μm), or rapamycin (Rap) (1 μm) for 48 h and stained with phalloidin-fluorescein isothiocyanate. Figures are representative of two separate experiments. No significant toxicity was elicited by any of the three pharmacological agents (see text for details).
In the chemomigration experiments described above (Fig. 1), cells were grown in the presence or absence of calcineurin inhibitors, but no stimulation was provided. Because the canonical activator of calcineurin is Ca2+, we decided to investigate basal calcium signaling in these cells. Under basal culture conditions, GN11 cells displayed an oscillatory Ca2+ pattern in 20% of cells (n = 228). This behavior was observed in the presence (20.2%, n = 163) or absence (20.0%, n = 65) of serum in the medium (Fig. 3). Oscillations were inhibited in 50% of cells tested (n = 6) by acute application of the nonspecific Ca2+ antagonist 2-aminoethoxydiphenyl borate (2-APB) (100 μm, Fig. 3) and observed in only 2.6% of cells (nine of 343) after 40 h of incubation with this membrane-permeable calcium modulator. When we compared GN11 cells to GT1-7 cells, the mature equivalent of GN11 cells, the most striking difference was represented by basal calcium, which was considerably higher in the migration-competent cell line (99 ± 16 nm, n =19, vs. 63 ± 6 nm, n =25, respectively).
Fig. 3.
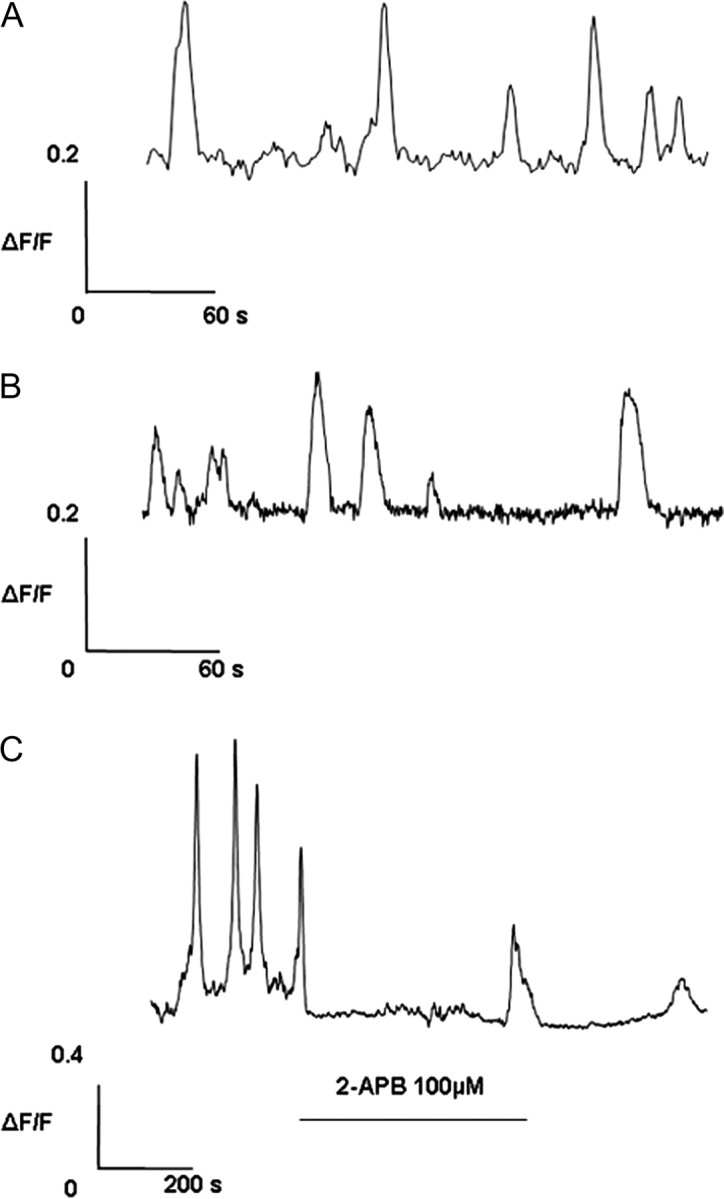
Characterization of Basal Nonstimulated Ca2+ in GN11 Cells
Representative traces of the oscillatory Ca2+ pattern in GN11 cells: spontaneous oscillations observed in presence (A) or absence (B) of serum in the medium and effect of 2-APB 100 μm (C) (three of six displayed an instant block of oscillations). In cells treated for 40 h with 2-APB, the effect of the blocker was complete (only nine of 343 showed a modest spontaneous calcium activity).
To confirm that calcineurin is active in our conditions, we performed a luciferase reporter assay with a construct driven by NFAT in GN11 cells and in GT1-7 cells. Indeed, NFAT-driven expression was present in GN11 cells under basal nonstimulated conditions and was abolished by incubation with FK506 or CsA (Fig. 4A). In the sister cell line GT1-7, calcineurin activity, defined as luciferase activity inhibited by either FK506 or CsA, was not constitutively present (Fig. 4A). Additional evidence of the lack of calcineurin activity can be implied by the absence of an effect of dominant-negative calcineurin and NFAT in luciferase experiments (Fig. 5A). Surprisingly, NFATc4, the isoform better characterized in brain, was present in GN11 cells but absent in GT1-7 cells (Fig. 4B). Our data suggest that the calcineurin signaling pathway is active in migration-competent neurons and undergoes changes upon completion of migration. We and others (4, 5) have previously shown that activation of L-type Ca2+ channels regulated calcineurin activity. To investigate whether this was true also in our system, we incubated cells for 48 h with nifedipine (1 μm) and assayed for migration. Inhibition of L-type calcium channels was unable to influence migration of GN11 cells compared with control (control, 100 ± 16%; nifedipine, 114 ± 14%). The inability of nifedipine to influence migration was substantiated by the absence of a calcium response in high potassium (44 mm; data not shown) and by previous reports that suggest that these cells (unlike GT1-7) are devoid of voltage-operated Ca2+ channels (17). We also attempted to grow cells in the presence of thapsigargin, but this treatment was highly cytotoxic and could not be used.
Fig. 4.
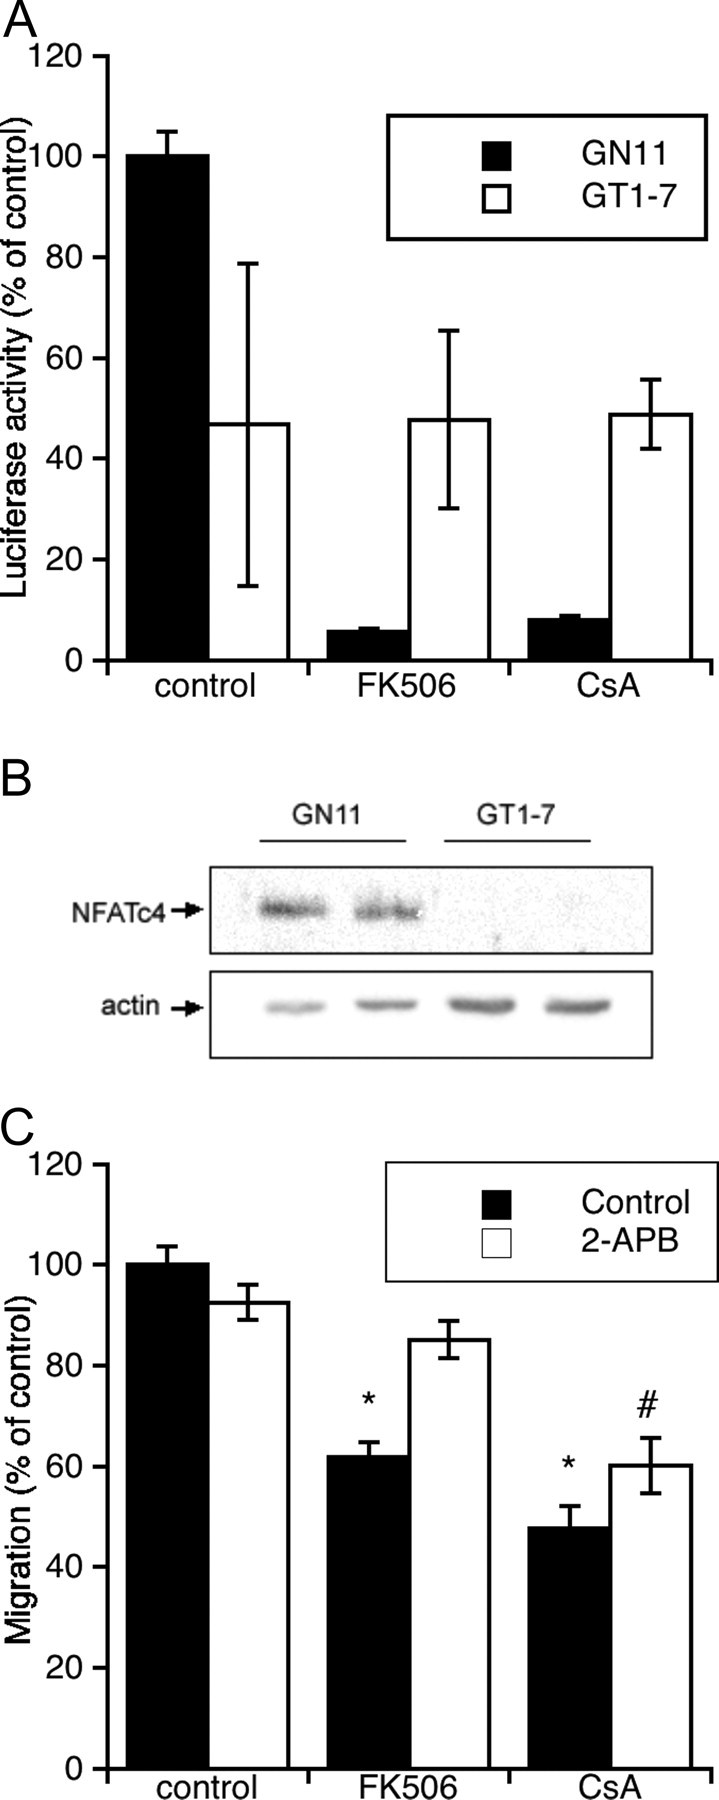
Characterization of the Ca2+/Calcineurin/NFAT Pathway under Basal Conditions in GN11 Cells
A, NFAT-driven luciferase activity in GN11 or GT1-7 cells in the presence or absence of FK506 (100 nm) or CsA (1 μm) for 48 h. Note that in GT1-7 cells, activity appears to represent background noise, because it cannot be inhibited by calcineurin antagonists. Values are mean ± sem of five to 15 replicates in one to three separate experiments. B, Western blot of NFATc4 in two separate preparations of GN11 and GT1-7 cells; 30 μg protein was loaded in each well. C, Effect of 2-APB on migration. Values are sem of 12–18 replicates from two to three experiments. *, P < 0.01; #, P < 0.05 compared with respective controls using one-way ANOVA, followed by Tukey’s test.
Fig. 5.

Molecular Characterization of the Calcineurin/NFAT Pathway
A, Effect of the constructs used in the present study on luciferase activity in GN11 (black bars) or GT1-7 (hatched bars) cells. Values are sem of five to 20 replicates from one to four experiments. *, P < 0.01 compared with respective controls using one-way ANOVA, followed by Tukey’s test. B, Effect of dominant-negative constructs on GN11 migration. Cells negative for GFP are in black, and their migration behavior did not differ from control cells. Cells were transiently transfected and, after 72 h, cell sorted for GFP positivity. For the effect of constitutively active constructs or overexpression, see text. Values are sem of 24–28 replicates from three separate experiments. *, P < 0.01 compared with respective controls using one-way ANOVA followed by Student’s t test.
To establish whether a correlation existed between Ca2+ oscillations, activation of the calcineurin-NFAT pathway, and the migratory behavior of GN11 cells, we analyzed the effects of 2-ABP, the only compound that affected basal calcium signaling (i.e. blocking oscillations) on GN11 cells transfected with the luciferase reporter construct and in chemomigration assays. 2-APB was unable to block NFAT-driven luciferase expression (141 ± 15% of control; n =11), suggesting that the elevated resting Ca2+ in these migration-competent cells (previous paragraph) might be sufficient to drive the activation of the calcineurin-NFAT pathway. In support of this, incubation of 2-APB alone did not reduce chemomigration of GN11 cells (Fig. 4C). Surprisingly, though, incubation with 2-APB was able to partially rescue the block in migratory potential induced by FK506 (Fig. 4C). Experiments directed at clarifying this showed that incubation with 2-APB did not reduce significantly basal calcium levels (basal cell calcium after 40 h incubation was 89 + 13% of control cells), suggesting that calcium on its own could not provide an explanation for this paradoxical effect of 2-APB. The rescue observed might in principle be explained by the activation of a parallel pathway by 2-APB treatment. Indeed, preliminary experiments from our lab (Genazzani, A. A., and S. Tacchi, unpublished) suggest that this might occur. In brief, in control GN11 cells, preincubation for 48 h with wortmannin elicits no effect, whereas in cells treated with FK506 plus 2-APB, preincubation with wortmannin yields a significant reduction in migratory potential. These data suggest that 2-APB pretreatment unmasks a new pathway that can support migration in the absence of calcineurin activity. Whether this unmasking of a parallel, redundant pathway is correlated with the abolishment of calcium oscillations remains to be established.
Although our data demonstrate the involvement of calcineurin and the endogenous activation of the NFAT pathway, formal proof that the calcineurin/NFAT pathway is implicated in the migratory behavior is required. To establish this, we transfected cells with the truncated form either of calcineurin A (ΔCaNA) or of NFAT (ΔNFAT), both of which are constitutively active (18). Indeed, control experiments established that both plasmids were able to considerably increase NFAT-driven luciferase expression (Fig. 5A). To unmask the effect of an increase of calcineurin activity over background, fewer cells were seeded in the Boyden’s chamber and exposed to a reduced chemotactic stimulus (0.1% FCS). In these conditions, GN11 cells transfected with either of the two plasmids significantly increased their migratory response (130 ± 5% for ΔCaNA and 131 ± 5% for ΔNFAT of control migration; P < 0.01). To further strengthen this finding, a stable cell line overexpressing ΔNFAT was generated. Indeed, these overexpressing cells displayed a significantly higher migration behavior compared with the respective control (178 ± 4%).
If our hypothesis is correct, and calcineurin indeed plays a permissive role toward migration by regulating gene expression, one would expect that overexpression of dominant-negatives or negative regulators should decrease migration. Cells were therefore cotransfected with vectors coding for CaIN, an inhibitor of calcineurin (19), or with a dominant-negative NFAT (amino acids 1–317, lacking the DNA-binding domain; Fig. 5A for inhibitory activity on luciferase) and cotransfected with a green fluorescent protein (GFP) marker plasmid. After 72 h of culture, cells were sorted by fluorescence flow cytometry and GFP+ or GFP− cells were allowed to migrate in the Boyden’s chamber vs. 0.1% serum, as described above. Cells expressing either CaIN or dominant-negative NFAT (GFP+) displayed a markedly reduced chemomigratory response to serum with respect to untransfected cells (GFP−, Fig. 5B), thereby confirming the involvement of both the phosphatase and its downstream transcription factor in migration of GN11 cells in vitro.
It would be extremely important in the future to understand which proteins are controlled by calcineurin at a transcriptional level to allow the permissive role on migration to occur. We have previously shown that brain-derived neurotrophic factor (BDNF) is controlled by this phosphatase in cerebellar granule cells (20). Furthermore, it has been shown that BDNF can control calcineurin activity (6) and that it has a neurotrophic effect on embryonic GnRH-secreting neurons (21). These data, taken together, prompted us to investigate whether a relationship exists between calcineurin-dependent migration and BDNF. Treatment of cells for 48 h with BDNF (30 ng/ml) did not alter migratory behavior of control GN11 (control, 100 ± 2%; BDNF, 99 ± 2%) or FK506-treated cells (FK506, 61 ± 3%; FK506 plus BDNF, 52 ± 3%). Furthermore, unlike in cerebellar granule cells, calcineurin inhibition did not alter mRNA levels for BDNF, as analyzed by PCR (data not shown). It would therefore appear that BDNF does not mediate migration of these cells, nor is it controlled at a transcriptional level by calcineurin.
In conclusion, in the present manuscript, we show that the chronic activation of the Ca2+/calcineurin/NFAT pathway primes GnRH neurons to undergo migration. This statement is supported by pharmacological and molecular evidence. In brief, inhibition of calcineurin by FK506, CsA, CaIN, and a dominant-negative NFAT reduces the migratory potential of neurons, whereas molecular potentiation of the pathway (constitutively active CaN or NFAT) augments migration. Inhibition of this pathway during migration is unable to exert any effect, confirming that the mechanism of action is at the transcriptional/preparatory level in neurons. Conclusive proof that calcineurin regulates migration at a transcriptional level and whether this is a direct effect or mediated by synthesis of other proteins would come from the use of transcription (e.g. actinomycin D) and/or protein synthesis (e.g. cycloheximide) inhibitors. Indeed, we have performed similar experiments in cerebellar granule cells (8). Yet, we were unable to obtain such data because both compounds were highly cytotoxic in the first 12 h of treatment (data not shown), whereas we require 16 h (Fig. 1B) to unmask effects on migration.
In cerebellar granule cells, our group and others have postulated, via indirect evidence (e.g. microarray analysis), that calcineurin is activated upon completion of migration (13, 14). This is apparently in contrast with the findings reported here and demonstrates that calcineurin does not positively regulate migration in all neuronal or neuroendocrine cell types. On the other hand, however, these opposing effects suggest that calcineurin acts as a transcriptional switch in the developing nervous system and is able to facilitate transitions from one developmental stage to the next (e.g. migration to maturation). Indeed, the nature of the calcium transients required for calcineurin activation, i.e. moderate in amplitude but prolonged in time, would make this phosphatase perfect for such a transitional role. It is interesting to note that in our model, it appears that the calcium elevation required for calcineurin activation is provided by high unstimulated basal levels of calcium and that GT1-7 cells display lower basal levels. Our data therefore also suggest that during development, calcium signaling is not necessarily only a stimulated process but may also be constitutively present under basal conditions. In this context, it is interesting to note that among the genes reported to be controlled by the CaN/NFAT pathway in neurons are those involved in calcium homeostasis (including pumps and exchangers) (8), maybe providing a feedback mechanism to this signal transduction pathway. It is also striking that the CaN/NFAT pathway itself undergoes changes upon migration, as demonstrated by the disappearance of NFATc4 in GT1-7 cells (Fig. 3). Yet, these changes do not result in the disappearance of the pathway altogether, because mature cells are capable of activating it, presumably upon stimulation, because transfection of a constitutively active calcineurin leads to its activation (Fig. 5).
Neuronal migration will be controlled by numerous signaling pathways in vivo (22), and some of these pathways will be redundant and cell specific to allow such a complex but fundamental behavior to occur. Our data strongly suggest that in our model the Ca2+/calcineurin/NFAT pathway is among the primers that determines the migratory potential of neurons. Yet, it also highlights the switch nature of this phosphatase, whose activation or inactivation guides cells to proceed from one genetic program to the next.
MATERIALS AND METHODS
Cell Cultures
GN11 and GT1-7 cells were originally provided by S. Radovick (University of Chicago, Chicago, IL) and R. I. Weiner (San Francisco, CA), respectively. The cells were grown in a monolayer at 37 C in a humidified CO2 incubator in DMEM containing 1 mm sodium pyruvate, 2 mm glutamine, 100 μg/ml streptomycin, and 100 U/ml penicillin and supplemented with 10% FCS. The medium was replaced at 2-d intervals. Subconfluent cells were routinely harvested by trypsinization and seeded in 57-cm2 dishes.
Chemicals, Plasmids, Antibodies, Transfection, and PCR
FK506 and rapamycin were purchased from Calbiochem (La Jolla, CA), and cyclosporin A and 2-APB were from Sigma-Aldrich (St. Louis, MO).
GN11 cells were grown in culture plates in complete culture medium for 24 h and incubated for 3 h with the selected expression vector in the presence of the Lipofectamine-Plus Reagent (Invitrogen, Carlsbad, CA) according to the manufacturer’s instructions. The following plasmids were used: pEGFP-N1 (Clontech, Palo Alto, CA), pLEGFP-C1 (Clontech), ΔCnA (23), ΔNFAT (18), dominant-negative NFAT (amino acids 1–317 of the human NFATc4) in pAC-CMVpLpA (S−)+ kindly provided by the laboratory of Jeff Molkentin (Cincinnati Children’s Hospital, Cincinnati, OH), ΔCAIN in pRK5 (24), pNFAT-TA-luc (Clontech), and pRL-TK (Promega, Madison, WI).
For Western blotting, the following antibodies were used: anti-NFATc4 (1:500, sc-13036; Santa Cruz Biotechnology, Santa Cruz, CA) and antirabbit IgG (1:8000; Amersham Biosciences, Arlington Heights, IL).
For immunocytochemistry, phalloidin-fluorescein isothiocyanate (Sigma-Aldrich) was used to visualize the actin cytoskeleton, whereas a polyclonal anti-GnRH antibody (Progen, Heidelberg, Germany) and a goat antirabbit Alexa Fluor 488 (Invitrogen) were used to visualize GnRH.
For evaluation of BDNF transcript level, a PCR approach (94, 65, and 72 C for 30 cycles) was used with the following primers: bdnf forward, CAATGAAAGAAGCAAACGTC; bdnf reverse, GCTAATACTGTCACACACGCTC; gadph forward, TGGCATTGTGGAAGGGCTCAT; and gadph reverse, ATGCCAGTGAGCTTCCCGTTCAGC.
Microchemotaxis Assay
The assay was performed using a 48-well Boyden’s microchemotaxis chamber according to the instructions (Neuroprobe, Cabin John, MD). Briefly, the lower compartment of the chamber was loaded with the chemoattractant (1 or 0.1% FCS) or control medium; the cells, grown in complete medium until subconfluent, were suspended (100,000; 20,000; or 13,500 cells/50 μl) in serum-free culture medium and placed in the open-bottom wells of the upper compartment of the Boyden’s chamber. Each pair of facing wells was separated by a polyvinylpyrrolidone-free polycarbonate porous membrane (8-μm pores) precoated with gelatin (0.2 mg/ml in PBS). The chamber was then kept for 3 h in the cell culture incubator. At the end of the incubation period, the cells that migrated through the pores and adhered to the underside of the membrane were fixed and stained according to the Diff-Quik kit (Biomap, Milano, Italy) and mounted onto glass slides. For quantitative analysis, the membranes were observed on a Nikon microscope using a ×40 objective. Three random fields of stained cells were counted for each well, and the mean number of migrating cells was calculated. Numbers in the text and figures are expressed as percentage of control for clarity. In a typical experiment, an optical field contained 65 ± 7 cells, which corresponded to 4815 + 518 cells in the well. This experiment is indicative of most experiments, where in 3 h approximately 20–25% of cells migrate to the lower chamber.
Luciferase Assays
GN11 or GT1-7 cells were transfected with a luciferase reporter gene driven by NFAT (0.075 μg/well) and a control renilla reporter gene (0.075 μg/well) in 96-well plates. After 3 h of transfection, cells were washed and treated with the calcineurin inhibitors (FK506 100 nm; CyclosporinA 1 μm) or 2-APB (100 μm) for 48 h. Luciferase assays were performed with the dual luciferase reporter assay system (Promega) and assessed using a multilabel counter (Victor3 V, Perkin Elmer).
Generation of ΔNFAT-pLEGFP and pLEGFP Stable Cell Lines
ΔNFAT (18) was subcloned into pLEGFP-C1 and transfected into Phoenix Retroviral Producer cells. The supernatant was then used to infect GN11 cells. Selection was by G418 (500 μg/ml). To speed up the procedure, cells were also sorted by GFP fluorescence using stringent conditions to avoid cross-contaminations using the FACSVantage SE DiVA cell sorter (Becton Dickinson, Franklin Lakes, NJ). More than 99% of cells were GFP fluorescent when experiments were performed. In parallel, the same procedure was used to generate a pLEGFP stable cell line, which was used as control.
Cell Sorting of Transient Expression
GN11 cells were cultured for 3 d after the cotransfection with pEGFP-N1 and dnNFAT in pAC-CMVpLpA (S−)+ or ΔCAIN in pRK5 in a 1:4 ratio. Cells were then resuspended (10 × 106/ml) in PBS (Ca/Mg2+-free) plus 5 mm EDTA, 25 mm HEPES (pH 7.0), and 1% FCS and sorted into GFP+ and GFP− populations using stringent conditions to avoid cross-contaminations using the MoFlo cell sorter (Dako Cytomation, Glostrup, Denmark).
Ca2+ Measurements
To perform calcium imaging experiments, cells were loaded for 30 min at 37 C with 1 μm Fluo-4 AM (Invitrogen) and were transferred in a perfusion chamber (Bioptechs, Butler, PA) connected to a peristaltic pump and mounted on an inverted microscope (Eclipse TE 300, Nikon, Japan). A microperfusion system was employed to rapidly and locally perfuse a Tyrode solution of the following composition (in mm): 154 NaCl, 4 KCl, 2 CaCl2, 1 MgCl2, 5 HEPES), 5.5 glucose, and NaOH to pH 7.4 with added 10% BSA or FCS. Single-cell [Ca2+]i measurements were performed exciting Fluo-4 at 494 nm for less than 200 msec, at a frequency of 0.2–1 Hz by means of a monochromator (Polychrome IV, T.I.L.L.; Photonics GmbH, Hamburg, Germany). Images were recorded with a cooled CCD camera (SensiCam, PCO, Kehlheim, Germany) and stored on a computer. Fluorescence was determined from regions of interest covering single cell bodies. Dye excitation, image acquisitions, and region-of-interest analysis protocols were performed with Axon Imaging Workbench software (Axon Instruments, Foster City, CA). Estimation of fluorescence intensity was performed as the pseudoratio ΔF/F according to the following formula: ΔF/F = (F − Fbas)/(Fbas− B), where F is the measured fluorescence intensity of the Fluo-4 indicator, Fbas is the fluorescence intensity of the indicator in the cell before stimulation, and B is the background signal from the averaged areas adjacent to the cell.
Fura-2 was employed to estimate ratiometrically the intracellular calcium concentrations. The indicator was added to cultures for 30 min at 37 C at a final concentration of 0.5 μm. Fluorescence was excited every 0.3 sec alternatively at 340 and 380 nm for 100 msec, and emission was recorded at 510 nm. The intracellular calcium concentration was estimated from the ratio image, as described by Grynkiewicz et al. (25). All imaging experiments were performed at 27 C.
Acknowledgments
We are particularly indebted to the labs of Jeff Molkentin and Ernesto Carafoli for constructs used in this work.
Footnotes
This work was possible through funding from the Italian Government (PRIN) and from the Regione Piemonte (Ricerca Finalizzata 2003 to A.A.G.).
Disclosure Statement: The authors have nothing to disclose regarding potential conflicts of interest.
First Published Online November 21, 2007
Abbreviations: 2-APB, 2-Aminoethoxydiphenyl borate; BDNF, brain-derived neurotrophic factor; FCS, fetal calf serum; GFP, green fluorescent protein; NFAT, nuclear factor of activated T cells.
References
- 1.Aramburu J, Rao A, Klee CB 2000. Calcineurin: from structure to function. Curr Top Cell Regul 36:237–295 [DOI] [PubMed] [Google Scholar]
- 2.Park KS, Mohapatra DP, Misonou H, Trimmer JS 2006. Graded regulation of the Kv2.1 potassium channel by variable phosphorylation. Science 313:976–979 [DOI] [PubMed] [Google Scholar]
- 3.Heit JJ, Apelqvist AA, Gu X, Winslow MM, Neilson JR, Crabtree GR, Kim SK 2006. Calcineurin/NFAT signalling regulates pancreatic β-cell growth and function. Nature 443:345–349 [DOI] [PubMed] [Google Scholar]
- 4.Graef IA, Mermelstein PG, Stankunas K, Neilson JR, Deisseroth K, Tsien RW, Crabtree GR 1999. L-type calcium channels and GSK-3 regulate the activity of NF-ATc4 in hippocampal neurons. Nature 401:703–708 [DOI] [PubMed] [Google Scholar]
- 5.Genazzani AA, Carafoli E, Guerini D 1999. Calcineurin controls inositol 1,4,5-trisphosphate type 1 receptor expression in neurons. Proc Natl Acad Sci USA 96:5797–5801 [DOI] [PMC free article] [PubMed] [Google Scholar]
- 6.Groth RD, Mermelstein PG 2003. Brain-derived neurotrophic factor activation of NFAT (nuclear factor of activated T-cells)-dependent transcription: a role for the transcription factor NFATc4 in neurotrophin-mediated gene expression. J Neurosci 23:8125–8134 [DOI] [PMC free article] [PubMed] [Google Scholar]
- 7.Graef IA, Wang F, Charron F, Chen L, Neilson J, Tessier-Lavigne M, Crabtree GR 2003. Neurotrophins and netrins require calcineurin/NFAT signaling to stimulate outgrowth of embryonic axons. Cell 113:657–670 [DOI] [PubMed] [Google Scholar]
- 8.Carafoli E, Genazzani A, Guerini D 1999. Calcium controls the transcription of its own transporters and channels in developing neurons. Biochem Biophys Res Commun 266:624–632 [DOI] [PubMed] [Google Scholar]
- 9.Nakanishi S, Okazawa M 2006. Membrane potential-regulated Ca2+ signalling in development and maturation of mammalian cerebellar granule cells. J Physiol 575:389–395 [DOI] [PMC free article] [PubMed] [Google Scholar]
- 10.Gerber DJ, Hall D, Miyakawa T, Demars S, Gogos JA, Karayiorgou M, Tonegawa S 2003. Evidence for association of schizophrenia with genetic variation in the 8p21.3 gene, PPP3CC, encoding the calcineurin γ-subunit. Proc Natl Acad Sci USA 100:8993–8998 [DOI] [PMC free article] [PubMed] [Google Scholar]
- 11.Miyakawa T, Leiter LM, Gerber DJ, Gainetdinov RR, Sotnikova TD, Zeng H, Caron MG, Tonegawa S 2003. Conditional calcineurin knockout mice exhibit multiple abnormal behaviors related to schizophrenia. Proc Natl Acad Sci USA 100:8987–8992 [DOI] [PMC free article] [PubMed] [Google Scholar]
- 12.Arron JR, Winslow MM, Polleri A, Chang CP, Wu H, Gao X, Neilson JR, Chen L, Heit JJ, Kim SK, Yamasaki N, Miyakawa T, Francke U, Graef IA, Crabtree GR 2006. NFAT dysregulation by increased dosage of DSCR1 and DYRK1A on chromosome 21. Nature 441:595–600 [DOI] [PubMed] [Google Scholar]
- 13.Kramer D, Fresu L, Ashby DS, Freeman TC, Genazzani AA 2003. Calcineurin controls the expression of numerous genes in cerebellar granule cells. Mol Cell Neurosci 23:325–330 [DOI] [PubMed] [Google Scholar]
- 14.Sato M, Suzuki K, Yamazaki H, Nakanishi S 2005. A pivotal role of calcineurin signaling in development and maturation of postnatal cerebellar granule cells. Proc Natl Acad Sci USA 102:5874–5879 [DOI] [PMC free article] [PubMed] [Google Scholar]
- 15.Komuro H, Kumada T 2005. Ca2+ transients control CNS neuronal migration. Cell Calcium 37:387–393 [DOI] [PubMed] [Google Scholar]
- 16.Maggi R, Pimpinelli F, Molteni L, Milani M, Martini L, Piva F 2000. Immortalized luteinizing hormone-releasing hormone neurons show a different migratory activity in vitro Endocrinology 141:2105–2112 [DOI] [PubMed] [Google Scholar]
- 17.Pimpinelli F, Redaelli E, Restano-Cassulini R, Curia G, Giacobini P, Cariboni A, Wanke E, Bondiolotti GP, Piva F, Maggi R 2003. Depolarization differentially affects the secretory and migratory properties of two cell lines of immortalized luteinizing hormone-releasing hormone (LHRH) neurons. Eur J Neurosci 18:1410–1418 [DOI] [PubMed] [Google Scholar]
- 18.Molkentin JD, Lu JR, Antos CL, Markham B, Richardson J, Robbins J, Grant SR, Olson EN 1998. A calcineurin-dependent transcriptional pathway for cardiac hypertrophy. Cell 93:215–228 [DOI] [PMC free article] [PubMed] [Google Scholar]
- 19.Lai MM, Burnett PE, Wolosker H, Blackshaw S, Snyder SH 1998. Cain, a novel physiologic protein inhibitor of calcineurin. J Biol Chem 273:18325–18331 [DOI] [PubMed] [Google Scholar]
- 20.Kramer D, Caruso A, Nicoletti F, Genazzani AA 2005. Somatostatin and the somatostatin receptor 2 are reciprocally controlled by calcineurin during cerebellar granule cell maturation. J Neurochem 94:1374–1383 [DOI] [PubMed] [Google Scholar]
- 21.Cronin AS, Horan TL, Spergel DJ, Brooks AN, Hastings MH, Ebling FJ 2004. Neurotrophic effects of BDNF on embryonic gonadotropin-releasing hormone (GnRH) neurons. Eur J Neurosci 20:338–344 [DOI] [PubMed] [Google Scholar]
- 22.Kumada T, Lakshmana MK, Komuro H 2006. Reversal of neuronal migration in a mouse model of fetal alcohol syndrome by controlling second-messenger signalings. J Neurosci 26:742–756 [DOI] [PMC free article] [PubMed] [Google Scholar]
- 23.O’Keefe SJ, Tamura J, Kincaid RL, Tocci MJ, O’Neill EA 1992. FK-506- and CsA-sensitive activation of the interleukin-2 promoter by calcineurin. Nature 357:692–694 [DOI] [PubMed] [Google Scholar]
- 24.Serrano AL, Murgia M, Pallafacchina G, Calabria E, Coniglio P, Lomo T, Schiaffino S 2001. Calcineurin controls nerve activity-dependent specification of slow skeletal muscle fibers but not muscle growth. Proc Natl Acad Sci USA 98:13108–13113 [DOI] [PMC free article] [PubMed] [Google Scholar]
- 25.Grynkiewicz G, Poenie M, Tsien RY 1985. A new generation of Ca2+ indicators with greatly improved fluorescence properties. J Biol Chem 260:3440–3450 [PubMed] [Google Scholar]