

Abstract
Estradiol (E2) is believed to modulate physiological functions relevant to osteoblast biology through the actions of estrogen receptors (ERs) that in turn regulate the expression of target genes. The molecular effects of estrogen action in bone remain to be fully elucidated. This study reports a genome-wide molecular and computational analysis of the interaction between ER and regulatory elements on the DNA of target genes in human primary osteoblasts. Of approximately 54,000 gene probes surveyed in this study, a total of 375 genes were up-regulated and 418 genes were down-regulated on exposure to E2, with only 46 of these being direct target genes after 24 h, as determined by concomitant cycloheximide treatment. Computational analysis discovered several pathways where E2 coregulates multiple functionally linked components. Examination of the genomic sequence of IGF binding protein 4 located ER response elements within the first intron. Using by chromatin immunoprecipitation, we show a site- and cell-specific recruitment of transcription factors to this newly identified regulatory region. Transient transfection studies revealed that this intronic region acts as a functional promoter in human osteoblasts. Taken together, this analysis provides a comprehensive gene transcription profile and identifies several genes of potential physiological importance in controlling estrogen-mediated signaling in primary osteoblasts.
THE ESTROGEN RECEPTORS (ERs) are ligand-dependent transcription factors that transduce estrogenic signals into changes in gene expression profiles in target cells (1). Estrogens have regulatory roles within the female and male reproductive system, in neuroendocrine and cardiovascular physiology and in bone metabolism. To date, two ERs, human ERα (NR3A1) and human ERβ (NR3A2) are known to mediate hormonal effects in humans (2, 3, 4). ERs interact with cis-regulatory elements of target genes either directly by associating with estrogen-responsive elements (EREs) located within promoter regions of target genes (5) but also widely distributed within the genome (6, 7), or indirectly by binding to other transcription factor complexes that bind to their respective binding sites (8, 9). Additionally, membrane-associated or cytoplasmic ERs can regulate gene transcription in bone and other nonreproductive tissues through extranuclear signaling processes (10, 11).
Upon association of ligand, ERs undergo major structural rearrangements to generate interaction surfaces that associate with transcription cofactors (12). Our lab has recently defined the concept of directed and cyclical events that achieve the sequential and combinatorial assembly of transcriptionally productive complexes on a target promoter (13, 14). Consequently, cellular responses to estradiol (E2) are restricted in their duration with estrogen-responsive promoters continuously monitoring and responding to estrogen levels.
Estrogen induces tissue-specific changes in gene expression profiles. Such pleiotropic effects arise from cell specific variation in the expression of coregulators and associated cofactor complexes, which together with differences in receptor distribution and in the expression of splice variants account for the differential effects of E2 in different tissues (15). We and others (16, 17, 18, 19, 20) have found that nonreproductive cells express relatively low amounts of ERs, with the ERα66 and ERα46 isoforms expressed at similar ratios in osteoblasts and both with the potential to contribute to estrogen signaling. We find that ER-β is expressed at extremely low levels in osteoblasts and in consequence it may play a minor physiological role in these cells (16). Whereas expression levels of ERα in osteoblasts are much lower than in uterine and breast cells, they do not vary by gender but are expressed in similar levels in both males and females (1).
In this study, we used a microarray approach to evaluate primary human osteoblasts to obtain a global gene expression profile of hormone response and to provide insight into the physiological signaling networks mediated by E2. These results show that estrogens exert tissue-specific effects by regulating a specific subset of target genes in primary osteoblasts, including genes not previously known to be under regulation by estrogen. Transcriptional regulation of target genes in primary osteoblasts is distinct from gene profiles obtained by overexpression of ERα in bone cell lines and presumable closely reflect the physiological situation (21, 22, 23). Furthermore, we observed that hormone-regulated genes can be assigned to several functional categories, indicating that estrogen exerts effects on multiple regulatory pathways in these cells.
We then focused on one direct target gene, IGF binding protein-4 (IGFBP4). Using chromatin immunoprecipitation (ChIP), we show the recruitment of ERα, P-PolII and activating transcription factor 4 (ATF4), a bone-specific transcription factor, to a newly identified intronic region of IGFBP4. ATF4, also known as cAMP response element binding protein (CREB) 2, is a basic leucine-zipper transcription factor whose crucial role in osteoblast differentiation and bone formation was recently described (24, 25). We also show ChIP analysis that the control of the expression of the IGFBP4 gene in the breast cancer cell line MCF-7 predominantly involves a different mechanism. Finally, transient transfection of MCF7 and bone cells revealed the functionality of the IGFBP4 intronic region as a promoter that can activate luciferase reporter gene expression in a cell-specific manner.
RESULTS
Transcriptome Profiling of Estrogen-Regulated Genes in Primary Human Osteoblasts
The aim of this study was to determine the transcriptome profile of genes regulated by endogenous ERα in response to estrogen treatment in primary human osteoblasts. This global analysis includes genes directly influenced by ERα and those that subsequently respond to primary gene changes within a 24-h period. Collectively, all of these genes may effect on osteoblast physiology. Analysis of primary cells has the advantage that endogenous ER and other relevant transcription factors are expressed at physiological levels. In particular, ER is expressed at relatively low abundance in these cells (16); accordingly, putative ER target genes should be regulated relative to their sensitivity to this physiological ER level, reflecting the biological function of endogenous ER expressed in primary bone. In contrast, studies performed with stably transfected ER differ in both the cellular context and the levels of ER.
We compared the transcriptome of control osteoblasts with that of cells treated for 24 h with 10 nm E2 using the Codelink whole genome 55K array. As we expected, variations in gene expression profiles within human primary osteoblasts, high stringency criteria were applied to the selected genes by cross comparing signals and restricting further evaluation of regulated genes that were present and regulated in all three samples analyzed within a group. The results show genes that are regulated in a similar manner within all the primary sample groups tested (Fig. 1A).
Fig. 1.
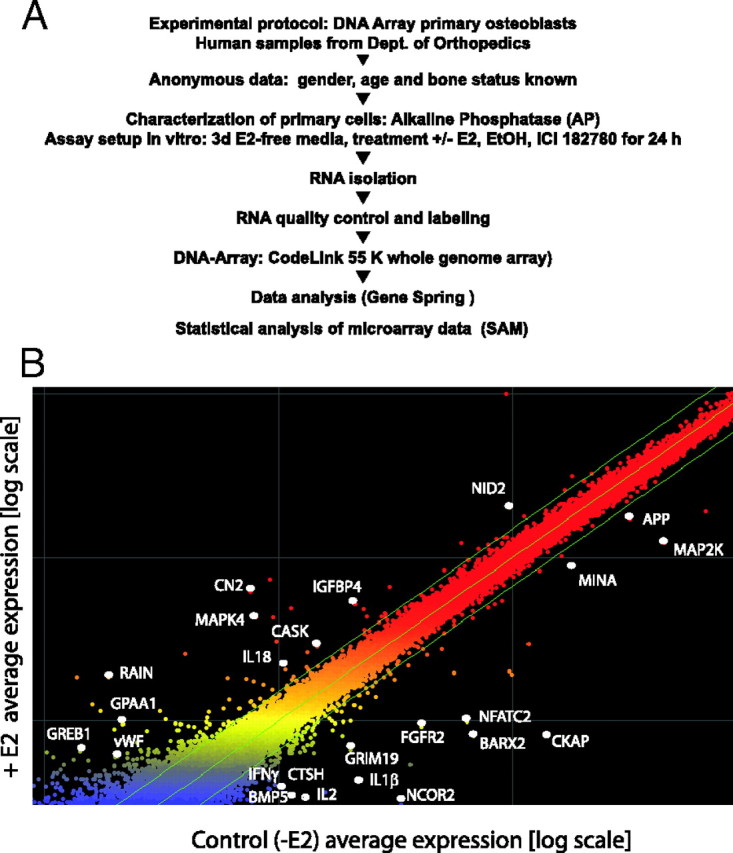
Comparative Transcriptome Profiling of Primary Human Osteoblasts
A, Experimental design and microarray data selection in primary human osteoblasts. Cells were serum starved followed by a treatment with E2, EtOH, ICI, and CHX. The procedure to obtain direct target genes is indicated. Data selection for estrogen-responsive genes was based on P values (P < 0.05) and magnitude of response (at least 1.5-fold change in the same direction). ICI sensitivity and CHX insensitivity were also identified statistically (P < 0.05). B, mRNA was prepared from biological replicates of control osteoblasts or osteoblasts treated for 24 h with 10 nm E2, EtOH, and ICI 182780. The mRNA was used to generate labeled cRNA that was then applied to individual Amersham Human 55K arrays. Significant changes in gene expression profiles occur under E2 treatment compared with EtOh control, with approximately 1.25% of transcripts up-regulated and 1.4% down-regulated in response to E2. Selected transcripts are indicated in the scatter blot. Green lines separate genes that are regulated greater than 1.5-fold.
The use of these techniques allowed the reproducible evaluation of gene expression levels in primary cells. Using these criteria, we identified 1.25% of transcripts that were up-regulated and 1.4% of transcripts down-regulated greater than 1.5-fold 24 h after E2 treatment. A large number of these genes have never been previously recognized in the context of osteoblast physiology. We selected a number of genes of potential significance whose expression changed markedly (fold change >1.5; P < 0.05, significance analysis for microrrays) in response to E2. Genes that are expressed in lower abundance are colored in blue, and highly expressed genes are shown in red. Representative genes that were regulated greater than 1.5-fold in response to E2 are presented as examples in the scatter blot (Fig. 1B).
Regulation of Bone-Related Genes in Response to Estrogen
Our method of analysis revealed several bone-related genes that are up-regulated or down-regulated in response to estrogen in human primary osteoblasts. A complete list and description of these genes is provided in the supplemental data published on The Endocrine Society’s Journals Online web site at http://mend.endojournals.org.
The majority of these genes have not been described previously and only a few of these correspond to candidate target genes that have been identified in transfected osteosarcoma cell lines (Table 1). In general, in addition to genes related to bone physiology, it is striking that several immune response and inflammatory response genes are down-regulated by E2 in the osteoblasts, supporting the antiinflammatory role that estrogens play in many tissues including bone. For example, IL-1β is a potent stimulator of bone resorption, and has been implicated in the pathogenesis of high bone turnover and osteoporosis, is 4.5-fold down-regulated in response to E2.
Table 1.
Computational Analysis of Genes Regulated in Previous Studies Compared with Primary Human Osteoblasts (24-h Time Points)
| Study | Gene Name | Regulation Compared with Primary Osteoblasts |
|---|---|---|
| Stossiet al. (22 ) | ZNF 264 | Commonly up-regulated |
| Monroeet al. (21 ) | IL18 | Commonly down-regulated |
| CALB2 | Commonly down-regulated | |
| NEDD9 | Commonly down-regulated | |
| RPS6KA2 | Commonly up-regulated | |
| APBB1 | Commonly up-regulated | |
| ARID4A | Commonly up-regulated |
Targets of ER
To study the group of estrogen-regulated genes that are targets of ER, we compared the genes that were inversely regulated by treatment with the pure ER antagonist ICI 182780 compared with E2 (data not shown). The results contain genes that are up-regulated by E2 and down-regulated by ICI. The oxidored-nitro domain-containing protein, TGFβ-associated protein (TGFβAP) and interferon regulatory factor 4 (IRF4) are examples of up-regulated genes. IRF4 is a nuclear transcription factor that positively regulates IL10 biosynthesis and transcription in monocyte-derived cells (26). Genes that are down-regulated by E2 and up-regulated in response to ICI include, for example, the nuclear corepressor NCoR2 [silencing mediator for retinoid and thyroid hormone receptors (SMRT)], which plays a direct role in stringently down-regulating the expression of genes to which ERα46 binds in the absence of E2 (27). SMRT is 6-fold down-regulated in primary human osteoblasts in response to E2.
Treatment with Cycloheximide (CHX) Defines Direct Targets of ERα Signaling
We then wished to determine the set of genes that respond directly to E2 treatment, through an evaluation of gene profiles that occur under blockade of de novo protein synthesis by CHX. In Fig. 2, the list of direct target genes that remain up- or down-regulated greater than 1.5-fold (24 and 22, respectively) in the presence of CHX is shown. The presence of the hormone and CHX together (E2 + CHX) did not antagonize the E2 effect on these genes, indicating that they are insensitive to CHX treatment and therefore do not require de novo protein synthesis.
Fig. 2.
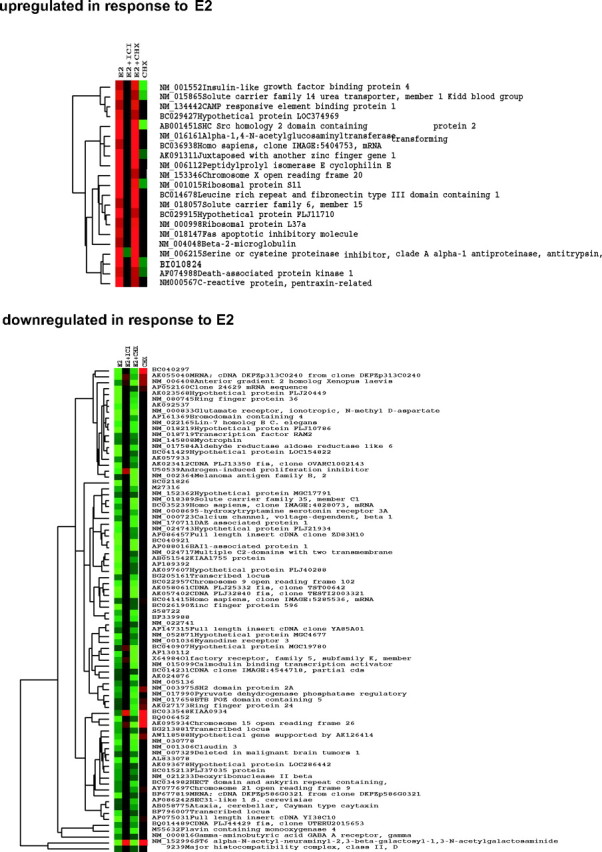
CHX Treatment Elucidates Direct ER Target Genes
The set of genes that directly respond to E2 treatment was determined through an evaluation of gene profiles that occur under blockade of de novo protein synthesis by CHX with concomitant treatment with E2.
For example, IGFBP-4 is a direct target gene up-regulated in response to E2 and blocked by ICI. By regulating IGF transport and stability, IGFBPs modulate IGFs bioactivity. IGFBP4 is a potent inhibitor of IGF actions in vitro by preventing the binding of IGF to its membrane receptors, subsequently resulting in decreased cell proliferation (28). It has been previously described as an estrogen-regulated gene in MCF7 (29) and the U2OS cell line and represents one of the few genes that are regulated in a similar manner in both, primary osteoblasts and osteoblast-like cell lines (22).
In contrast, the newly identified target gene GRIM19 is 2-fold down-regulated by E2, 1.5× up-regulated by the addition of ICI, which is not affected by treatment with CHX, suggesting that GRIM 19 is a direct target of ER signaling. GRIM19 belongs to the family of genes that are associated with retinoid-interferon induced mortality (GRIMs) and may represent a novel type of tumor suppressor in Stat 3-expressing cells such as bone (30).
Validation of the Microarray Data
To confirm changes in the expression profiles detected by microarrays, several up- and down-regulated genes were tested using real-time RT-PCR (Fig. 3). The results of a total of 16 primary bone samples after 24 h stimulation by E2 are presented. In all, selected genes we found changes in mRNA levels that reflect the array data. For example, GREB1 has been reported to be a target gene in reproductive cells, but here we show that it is also under estrogen regulation in primary osteoblasts. Two other genes, IGFBP4 and CN2 that are up-regulated in the microarray analysis, were also validated by quantitative PCR. The ER mediation of these E2 effects is clearly supported by the fact that the pure antagonist ICI 182780 reversed the observed effect in all of the selected genes. In contrast, GRIM19 and NCoR2 (SMRT) were down-regulated in response to E2, whereas both genes were up-regulated by ICI (Fig. 3).
Fig. 3.
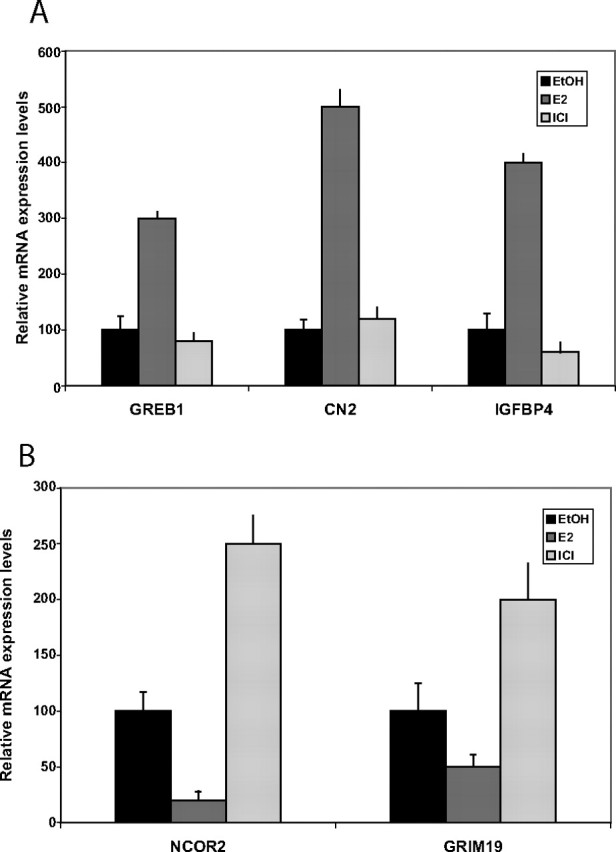
Real-Time PCR Validation of Genes Regulated by E2
E2 (10 nm) and ICI 182780 (1 nm) treatments were performed as described in Materials and Methods to confirm microarray data and to assess ER-dependent mechanisms of gene regulation. Total RNA from control, E2- and ICI-treated osteoblast cells was prepared after 24 h. The relative level of mRNA of regulated genes was then analyzed by quantitative RT-PCR. Samples were analyzed in triplicates and are given as sem. NCOR, Nuclear receptor corepressor.
In conclusion, real-time RT-PCR confirms both, the pattern of the expression profiles as well as the level of differential expression of selected genes of the microarray experiment.
Prediction of EREs in Direct ER Target Genes
Because EREs are the preferential sequence for ER binding on target genes, it follows that direct responding genes should be enriched for these binding motifs (31). To further explore this, we computationally extracted sequences flanking the transcriptional start sites (−1 kb to + 250 bp) of E2-responsive genes (Gene2Promoter; Genomatix, Munich, Germany) and queried them for potential ER binding sites (MatInspector). The results of this ERE scan are shown in Table 2. The core sequence of a matrix is defined as the (usually 4) consecutive highest conserved positions of the matrix. The maximum core similarity of 1.0 is only reached when the highest conserved bases of a matrix match exactly in the sequence. More important than the core similarity is the matrix similarity, which takes into account all bases over the matrix length. A perfect match to the matrix obtains a score of 1.0, which means that each sequence position corresponds to the highest conserved nucleotide at that position in the matrix.
Table 2.
Putative ERE Binding Sites
| Gene Symbol | Further Information | Start Position | End Position | Strand | Core Similarity | Matrix Similarity | Sequence |
|---|---|---|---|---|---|---|---|
| TEB1 | ER | 124 | 142 | + | 1 | 0.855 | taggGTCAtattatccttg |
| ZC3H12D | Canonical palindromic ERE | 361 | 379 | − | 0.79 | 0.811 | caagGGCAaggtgtgcctg |
| MYL6 | Canonical palindromic ERE | 572 | 590 | − | 1 | 0.815 | tgaaGTCAcactgctcaga |
| LIN7B | ER | 246 | 264 | − | 1 | 0.833 | agagGTCAgagcgccatga |
| NKD1, LOC283859 | ER | 129 | 147 | + | 1 | 0.831 | cctgGTCAggttggttggg |
| SEMA5B | ER | 318 | 336 | + | 1 | 0.881 | tgagGTCActgtggctcag |
| SEMA5B | Canonical palindromic ERE | 333 | 351 | + | 0.79 | 0.859 | tcagGGCAgagtggtctgg |
| SEMA5B | ER | 234 | 252 | + | 1 | 0.865 | gttgGTCAgccttaccttg |
| DAAM2 | ER | 369 | 387 | − | 1 | 0.892 | agagGTCActctgccttca |
| DAAM2 | Canonical palindromic ERE | 369 | 387 | + | 0.79 | 0.856 | tgaaGGCAgagtgacctct |
| MCTP1, LOC389310 | ER | 550 | 568 | − | 0.806 | 0.831 | agggGTAAggatgactgag |
| NUAK1 | ER | 130 | 148 | − | 1 | 0.84 | cctgGTCAccttaccccgg |
| DDIT4 liter | Canonical palindromic ERE | 407 | 425 | + | 1 | 0.847 | gcagGTCAccgagtcccca |
| ADCY4 | Canonical palindromic ERE | 309 | 327 | − | 0.79 | 0.811 | gaagGGCAatgtggaccct |
| RWDD4A | Canonical palindromic ERE | 49 | 67 | + | 0.767 | 0.826 | gttgGCCAggctgacctcg |
| RWDD4A | Canonical palindromic ERE | 49 | 67 | − | 1 | 0.888 | cgagGTCAgcctggccaac |
| IGFBP4 | Canonical palindromic ERE | 1020 | 1038 | + | 1 | 0.829 | ggcgGTCAtgctgcccctc |
| SHC2, C19orf19 | Canonical palindromic ERE | 190 | 208 | + | 1 | 0.919 | gcagGTCAccgtgaacaaa |
| GARNL3 | ER | 228 | 246 | − | 1 | 0.84 | cttaGTCAatgtgctttga |
| GARNL3 | ER | 582 | 600 | + | 1 | 0.849 | tgtgGTCAttgtgcataga |
| GARNL3 | Canonical palindromic ERE | 52 | 70 | − | 1 | 0.852 | gcaaGTCAccctgatccta |
| CCDC3, LOC389939 | ER | 283 | 301 | + | 1 | 0.856 | gaagGTCAagaggtccttg |
| ITPR3 | Canonical palindromic ERE | 555 | 573 | − | 0.767 | 0.82 | cgggGCCAgagtgagctgg |
| THRAP6 | Canonical palindromic ERE | 484 | 502 | + | 1 | 0.835 | ttacGTCAcagtgggcgga |
| CALML5 | ER | 195 | 213 | + | 1 | 0.843 | cttgGTCAggatctccgag |
| KIAA1026 | Canonical palindromic ERE | 509 | 527 | + | 1 | 0.841 | gaagGTCAggcttgcctcc |
| KIAA1026 | ER | 186 | 204 | + | 1 | 0.834 | ccatGTCAtgatgctttgc |
| KIAA1026 | ER | 507 | 525 | − | 1 | 0.847 | gttgGTCAggttgtctgcg |
| OR2B2 | ER | 33 | 51 | − | 1 | 0.841 | gttgGTCAggttggtctca |
| PHIP | ER | 265 | 283 | − | 1 | 0.876 | caagGTCActatgtactac |
| EMP1 | ER | 30 | 48 | − | 1 | 0.848 | caatGTCAaaatgactgaa |
| MAGEB2 | Canonical palindromic ERE | 488 | 506 | − | 1 | 0.822 | ggaaGTCAggatgagccac |
| tAKR | ER | 17 | 35 | + | 0.806 | 0.845 | ctggGTAAacatgaatttt |
| CYFIP2 | Canonical palindromic ERE | 521 | 539 | + | 0.79 | 0.835 | acagGGCAgtgtgtgcttt |
| CYFIP2 | Canonical palindromic ERE | 285 | 303 | − | 1 | 0.831 | actgGTCAcagagaccaac |
| CYFIP2 | ER | 115 | 133 | − | 1 | 0.854 | atagGTCAtggttagtttc |
| CYFIP2 | ER | 419 | 437 | + | 1 | 0.864 | gctgGTCAtggtgcggtta |
| APRIN | ER | 255 | 273 | − | 1 | 0.863 | tgagGTCAaaatgttattc |
| APRIN | Canonical palindromic ERE | 33 | 51 | + | 1 | 0.836 | ctagGTCAgagttaacaag |
| CDH6 | ER | 233 | 251 | − | 1 | 0.858 | atagGTCAatgtgccagaa |
| SPSB3 | ER | 363 | 381 | + | 1 | 0.838 | agcgGTCAcggtgcttctg |
| SPSB3 | ER | 279 | 297 | + | 1 | 0.834 | tccgGTCAacgcggcctgc |
| SPSB3 | Canonical palindromic ERE | 617 | 635 | − | 1 | 0.833 | caagGTCAgcgcgcccgcc |
| SLC13A1 | ER | 110 | 128 | − | 1 | 0.84 | cattGTCAtggtgccatga |
| CCDC19 | Canonical palindromic ERE | 243 | 261 | + | 1 | 0.838 | agagGTCAccttgttcggt |
| TNFAIP8L1 | ER | 388 | 406 | + | 1 | 0.903 | cctgGTCAaggtggccctg |
| RYR3 | ER | 493 | 511 | − | 1 | 0.861 | cttgGTCActctgatgttc |
| ACTG1 | ER | 295 | 313 | + | 1 | 0.87 | ggcgGTCAggatgtctgca |
| PDPR | ER | 342 | 360 | − | 1 | 0.83 | aaagGTCAgtctggctcca |
| DAZAP1 | ER | 88 | 106 | + | 1 | 0.852 | gttgGTCAggctggtcttg |
| DAZAP1 | Canonical palindromic ERE | 279 | 297 | + | 0.79 | 0.825 | gaacGGCAccgtgatctga |
| DAZAP1 | Canonical palindromic ERE | 280 | 298 | + | 0.79 | 0.825 | gaacGGCAccgtgatctga |
| LOC116123 | Canonical palindromic ERE | 112 | 130 | − | 1 | 0.857 | gtgaGTCActgtgccctgc |
| LOC116123 | Canonical palindromic ERE | 152 | 170 | + | 0.767 | 0.811 | ggagGCCAaggtgggcgga |
| KRT6IRS | Canonical palindromic ERE | 368 | 386 | − | 0.79 | 0.822 | gtggGGCAgagtggcccgc |
| CAMTA2 | ER | 398 | 416 | − | 1 | 0.877 | ctggGTCAtagtatctggg |
| MGC11332 | ER | 554 | 572 | + | 1 | 0.863 | ggggGTCActgggacatga |
ERE scan of putative binding sites for ERs in primary human osteoblasts. Analysis was performed using Dragon ERE and Genomatix MatInspector software packages as described in Materials and Methods.
Gene Interaction Networks
Elucidation of the genetic cascade guiding osteoblasts to form bone and to communicate with other cells such as osteoclasts is of extreme importance for understanding osteoblast physiology. As a next step, we wished to identify potential regulators of estrogen-mediated signaling in osteoblasts. For this issue, we used literature mining applying Genomatix BiblioSphere and found that several estrogen-regulated target genes are clustered within the signaling networks of ER and in addition to JUN, p53 and related regulatory networks with up-regulated genes colored in red and down-regulated genes in blue (Fig. 4A). Moreover, the direct target genes that are colored can also be grouped into these major categories (Fig. 4B).
Fig. 4.
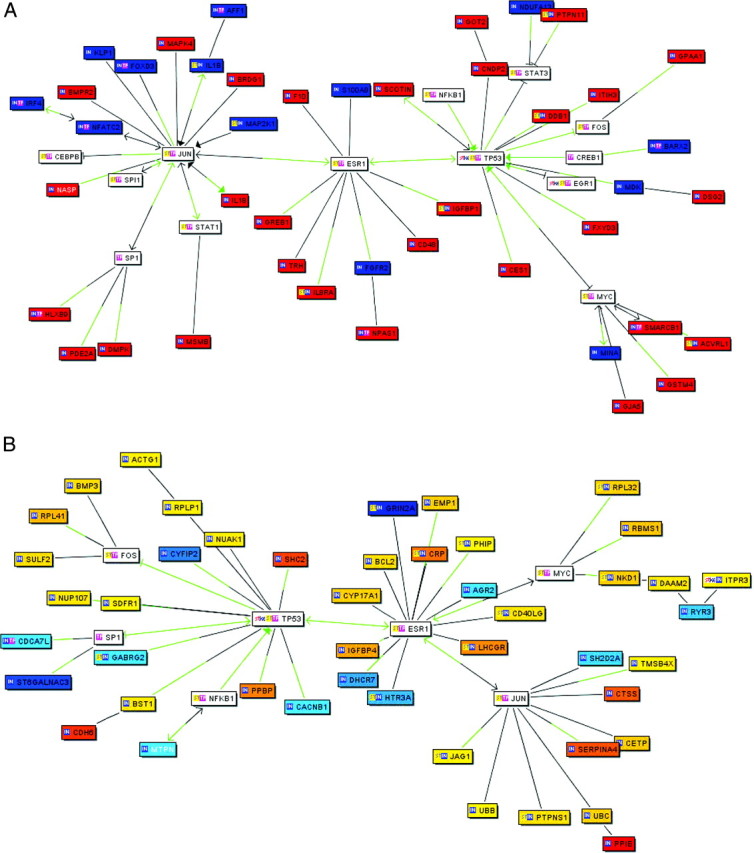
Gene Interaction Networks and Gene Clusters
Gene cluster analysis of selected and bone-related estrogen target genes in primary human osteoblasts (A) and direct estrogen target genes (B). A, Up-regulated genes are shown in red, down-regulated genes are given in blue. B, Direct candidate target genes that are regulated in osteoblasts in response to 24-h E2 treatment are gradiently labeled according to their gene expression profile. Connection lines indicate gene-gene co-citation. Green-colored connections indicate the detection of a transcription factor binding site for the connected transcription factor in the promoter of a co-cited gene by MatInspector. Connection lines with arrowheads are expert evaluated.
Gene Ontology
To classify E2-regulated genes into functional groups, we clustered genes as shown in Table 3. Our results indicate that E2 exerts effects on multiple regulatory pathways in these cells. The majority of regulated genes belong to the group of DNA-dependent transcriptional regulators and genes involved in signal transduction. Additionally, many of the genes up-regulated by E2 encode proteins that are associated with cell adhesion, protein phosphorylation, cell-cell signaling and intracellular signaling. In contrast, down-regulated genes encode several proteins that play a role in inflammatory and immune responses, G protein-coupled receptor pathways and apoptosis. Only one cell cycle gene, cyclin B3, is negatively regulated by E2, supporting our observations that E2 had no major effect on the proliferation rate of these cells. This is in contrast to the data obtained for breast cancer cell lines (32) and in concordance with results obtained in bone cell lines (21). We also found forkhead domain D3 (FOXD3), which is involved in development and the gene asscociated with retinoid-interferon induced mortality (GRIM 19) as a regulator of cell death down-regulated by E2. Both, osteoblasts and osteoclasts individually contribute to bone remodeling. Their cellular interactions control their physiological activity and bone remodeling intensity. These interactions can be established either through a cell-cell contact, involving molecules of the integrin family, or by the release of many polypeptidic factors and/or their soluble receptor chains. These factors can act directly on osteogenic cells and on their precursors to control differentiation and functions such as matrix formation, mineralization and resorption. The regulation of immunomodulatory molecules contributes to cellular communication between osteoblasts and the bone-resorbing osteoclasts (33). Interestingly, when we investigated the functional categories of E2-regulated genes, we found that a substantial proportion of genes involved in immune response is down-regulated as a consequence of E2 stimulation. For example, IL-1β, cathepsin S, IRF-4, integrin α, CD68 and nuclear factor of activated T cells (NFATC2) were down-regulated more than 2-fold in response to E2. The main biological functions and processes associated with ERα targets are represented in Fig. 5.
Table 3.
Functional Classification of E2-Regulated Genes
| Gene Ontology | Regulated Genes in Response to E2/Common Name | GenBank Accession No. | Description |
|---|---|---|---|
| Inflammatory response ↓ | IL-1β | NM_000576 | Signal transducer activity |
| Complement component 3a receptor 1 | NM_004054 | Integral to plasma membrane, C3a receptor activity | |
| IL 18 receptor accessory protein | NM_003853 | Cell surface receptor linked signal transduction transmembrane receptor activity | |
| Signal transduction ↓ | Membrane-spanning 4-domains, subfamily A, member 1 | NM_021950 | Receptor signaling protein activity, integral to membrane |
| Midkine (neurite growth-promoting factor 2) | BC 011704 | Structural constituent of cytoskeleton, cell differentiation, extracellular space (secreted) | |
| Ankyrin 3, node of Ranvier (ankyrin G) | NM_001149 | Structural component of cytoskeleton | |
| IL-1β | NM_000576 | Cell-cell signalling, extracellular space (secreted) | |
| Corticotropin-releasing hormone | NM_000756 | Neuropeptide hormone activity | |
| Guanine nucleotide binding protein (G protein), α transducer activity PP 2 | NM_005272 | GTP binding; signal transducer activity | |
| Ataxia telangiectasia mutated (including complementation groups A, C, and D) | NM_000051 | Negative regulation of cell cycle | |
| Amyloid β (A4) precursor protein (protease nexin-II, Alzheimer disease) | NM_000484 | Involved in apoptosis; cell adhesion; cell death | |
| G protein-coupled receptor protein signaling pathway ↓ | Complement component 3a receptor 1 | NM_004054 | Phospholipase C activity; |
| G protein-coupled receptor 84 | NM_020370 | G protein-coupled receptor signaling pathway | |
| Guanine nucleotide BP (G protein), α transducing activity PP2 | NM_005272 | GTP binding; signal transducer activity | |
| G protein-coupled receptor 88 | NM_022049 | G protein-coupled receptor activity, unknown ligand | |
| Regulation of cell cycle ↓ | Cyclin B3 (CCNB3) | NM_033031 | Regulation of cell cycle, cytokinesis |
| Regulation of transcription, DNA-dependent ↓ | Zinc finger protein 138 (clone pHZ-32) | NM_006524 | DNA-dependent regulation of transcription |
| Myeloid/lymphoid or mixed-lineage leukemia 2 | AF010403 | Transcription factor activity | |
| Zinc finger protein 8 (clone HF.18) | NM_021089 | DNA-binding, Zn-ion binding | |
| Interferon, γ-inducible protein 16 | NM_005531 | Transcription repressor activity, monocyte differentiation | |
| IRF4 NM_002460 | RNA-Pol II TF activity, transcription activator activity | ||
| Basonuclin | NM_001717 | Positive regulation of proliferation | |
| Zinc finger protein 238 (ZNF 238) | NM_006352 | DNA binding; zinc ion binding | |
| Forkhead box A2 (FOXA2) | NM_021784 | Transcription factor activity | |
| BarH-like homeobox 2 (BARX) | NM_003658 | RNA polymerase II transcription factor activity | |
| Nuclear corepressor (NCOR2) | AW015549 | SMRT, corepressor activity | |
| Apoptosis ↓ | IL-1β | NM_000576 | Signal transducer activity, extracellular space |
| Amyloid β (A4) precursor protein (protease nexin-II, Alzheimer disease) | NM_000484 | Amyloid β A4 protein precursor, involved in apoptosis and cell adhesion | |
| Apoptotic chromatin condensation inducer in the nucleus (ACINUS) | NM_014977 | Apoptotic chromatin condensation, DNA binding protein, ATPase activity | |
| Development ↓ | Forkhead box D3 | NM_012183 | Transcriptional activator activity |
| Cell death ↓ | GRIM 19 | NM_153221 | Cell death-regulatory protein, cartilage intermediate layer protein 2 |
| Cell adhesion ↑ | Calcium/calmodulin-dependent serine protein kinase (CASK) | NM_003688 | Serin threonin kinase activity |
| Desmocollin 2 | NM_004949 | Intercellular junctions | |
| Desmoglein 2 | NM_001943 | Intercellular junction | |
| PTK2B protein tyrosine kinase 2 b | NM_004103 | Nonmembrane-spanning Tyr kinase activity | |
| Nidogen 2 (osteonidogen) (NID2) | NM_007361 | Calcium ion and collagen binding | |
| Protein phosphorylation↑ | Cyclin-dependent kinase (CDC2-like) 10 | NM_003674 | Negative regulation of proliferation |
| Dystrophia myotonica-protein kinase | NM_004409 | Muscle contraction | |
| Calcium/calmodulin-dependent serine protein kinase (MAGUK family) | NM_003688 | Calmodulin binding | |
| CDC42 binding protein kinase β (DMPK-like) | NM_006035 | Intracellular signaling cascade | |
| Regulation of transcription, DNA dependent ↑ | Chromosome 20 open reading frame 17 | NM_173485 | Transcription factor activity; zinc ion binding |
| Neuronal PAS domain protein 1 | NM_002517 | Transcription factor activity | |
| Nuclear receptor subfamily 0, group B, member 1 | NM_000475 | Steroid hormone receptor activity; | |
| Zinc finger protein 197 | NM_006991 | Zn-finger binding transcription factor activity | |
| TAF6 RNA polymerase II, TATA box binding protein (TBP)-associated factor | NM_005641 | Transcription initiation | |
| Homeo box C8 | NM_022658 | Transcription factor activity | |
| Zinc finger protein 551 | NM_138347 | DNA-binding transcription factor | |
| SLC2A4 regulator | NM_020062 | Transcription factor activity |
Table 3A.
Continued
| Gene Ontology | Regulated Genes in Response to E2/Common Name | GenBank Accession No. | Description |
|---|---|---|---|
| Intracellular signaling cascade ↑ | CDC42 binding protein kinase β (DMPK-like) | NM_006035 | Serine/threonine kinase activity |
| Phospholipase C, δ 1 (PLC) | NM_006225 | Ca-ion binding | |
| Protein tyrosine phosphatase, non-receptor type 11 (PTPN11) | NM_002834 | Small GTPase regulatory/interacting protein activity | |
| BCR downstream signaling 1 | NM_012108 | iItracellular protein transport, membrane fusion | |
| Signal-transducing adaptor protein-2 | NM_017720 | Kinase activity | |
| Cell-cell signaling ↑ | TRH | NM_007117 | Signal transduction activity |
| IL-18 (interferon-γ-inducing factor) | NM_001562 | Apoptosis activator, IL-1R binding activity | |
| Amphiregulin (schwannoma-derived growth factor) | NM_001657 | Growth factor activity | |
| Signal transduction ↑ | Neuronal PAS domain protein 1 (NPAS) | NM_002517 | Transcription factor activity, in nucleus |
| GDP dissociation inhibitor 1 | NM_001493 | GTPase activator activity | |
| Protein tyrosine kinase 2 β (PTK2B) | NM_004103 | Positive regulation of proliferation | |
| IGFBP1 | NM_000596 | Regulation of cell proliferation | |
| IGFBP4 | NM_00 | Regulation of cell proliferation | |
| Ras-interacting protein (RAIN) | NM_017805 | Regulator of ras activity | |
| Protein modification ↑ | GPI-anchor transamidase activity (GPAA1) | NM_003801 | Protein modification |
All the genes that were identified to be regulated more than 1.5-fold were then categorized into functional groups according to their main known functions based on gene ontology networks.
Fig. 5.
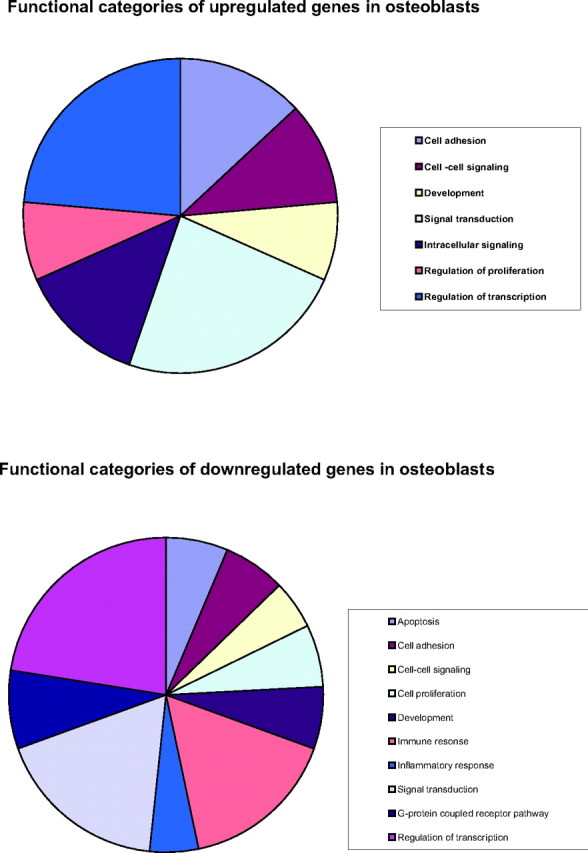
Functional Categories of Estrogen- Regulated Genes in Primary Human Osteoblasts
Gene ontology was generated using the GeneSpring 7.2 software package.
The IGFB4P4 Intron 1 Region Contains Multiple Transcription Factor Binding Sites
To obtain a further molecular insight into osteoblast gene expression, we focused on IGFBP4. In a genome-wide ER binding site mapping study (38), a new ER binding site was identified in intron 1 of IGFBP4 using ChIP and the recently developed Paired End diTag (PET) cloning and sequencing technology (34, 35, 36). Having identified IGFBP4 as a direct target for ER in this study, we wished to determine the mechanism and genetic components of estrogen induction of IGFBP4 gene expression. Initially, the genomic sequence of the human IGFBP4 gene was scanned for potential ERE-like sequences. A new potential ER binding site within intron 1 of the IGFBP4 gene was identified using this ditag cloning strategy. As depicted in Fig. 6A, further examination of the IGFBP4 genomic sequence discovered EREs and forkhead motifs conserved in all species tested. The structure of the IGFBP4 intronic region within intron 1 is represented in Fig. 6B. Interestingly, two CREB2 (ATF4) binding sites, one located adjacent to an ERE, are found in the human sequence, exclusively, whereas an additional ERE and forkhead motif are conserved in human, mouse, rat, and dog (Fig. 6B).
Fig. 6.
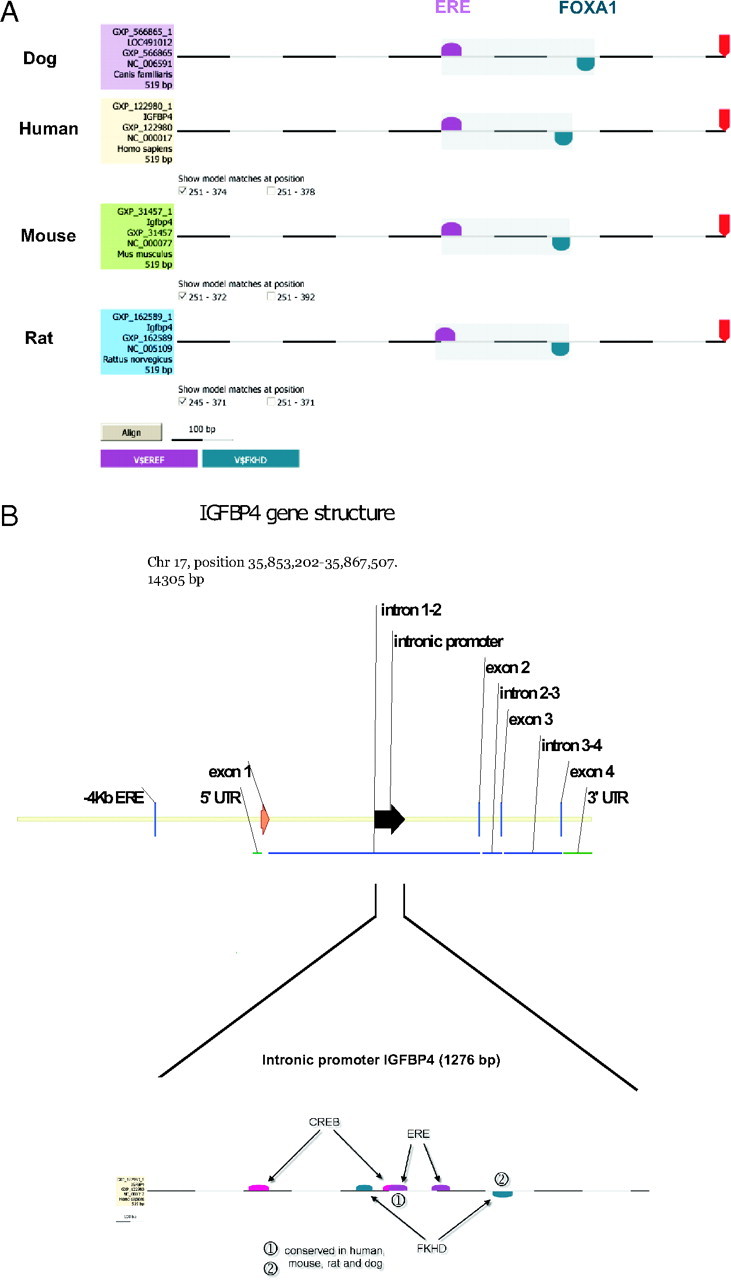
Schematic Representation of the IGFBP4 Intron 1 Sequence
A, Comparison of the human, mouse, rat and dog genomic sequences reveals the conservation of an ERE and FoxA1 site within 150 bp of intron 1 of the IGFBP4 gene in all the species that were analyzed. B, Computational analysis of the IGFBP4 intron 1 fragment (1276 bp) on chromosome 17 revealed putative transcription factor binding sites such as CREB2, which represents the binding sequence for ATF4, EREs and Forkhead (FKHD) binding sites. The elements marked as 1 and 2 are conserved in mouse, human, dog, and rat, whereas the other putative binding sites are only conserved in the human genome. UTR, Untranslated region.
Transcriptional Complexes Recruited to the IGFBP4 Gene
A region of the IGFBP4 gene promoter has already been shown to contain a functional ERE (−4214/−4210, Fig. 6B) (29). Here, we assessed the ability of the identified 1276-bp intronic region of IGFBP4 to recruit ER, the bone-specific transcription factors osterix and ATF4 and P-PolII in MCF-7 and primary human osteoblasts. (Fig. 7A).
Fig. 7.
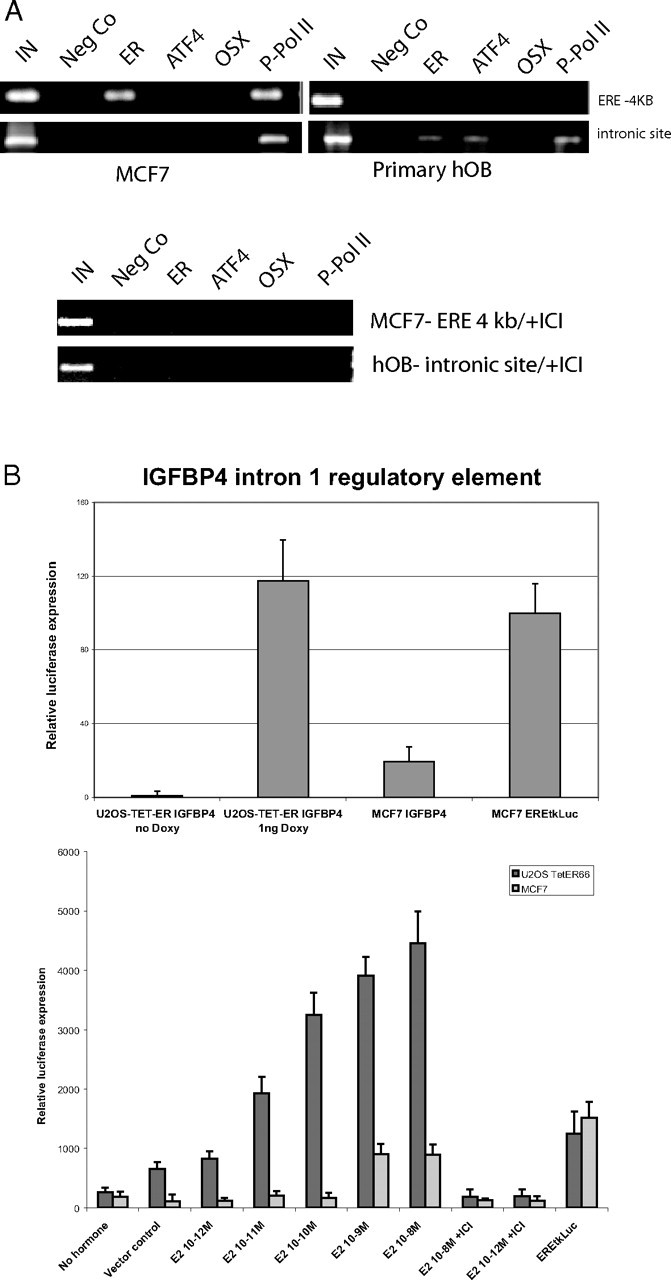
Experimental Analysis of the IGFBP4 Intron 1 Sequence
A, ChIP analysis of the IGFBP4 intron 1 region demonstates cell-specific transcription factor profile. ChIP assays were performed in MCF7 cells and primary human osteoblasts in the presence of E2 +/− ICI 182780 using antibodies specific for ERα, ATF4, Osterix and P-PolII as described in Materials and Methods. Two distinct genomic regions were examined by PCR: the genomic region around the ERE at −4 kb at the 5′ untranslated region and an intronic fragment located in intron 1 of the IGFBP4 gene. The resulting amplification products were separated using agarose gel electrophoresis. B, Transient transfections performed in triplicates in U2OS-TET-ERα cells show that the 1276-bp fragment of the IGFBP4 intron 1 acts as a functional promoter. Cells were transfected and treated with E2 (10−8 m) upper panel and various concentrations (10−8 to 10−12 m) in the lower panel and ER expression at physiological levels was induced in bone cells by the addition of low concentrations of doxycyclin (1 ng). Lysates were harvested 24 h after treatment and the results are given as a mean of three experiments normalized to an internal control (Renilla luciferase).
As a positive control for ER recruitment, the −4.2-kb region of IGFBP4 region was used, and, as expected, showed recruitment of ER on the promoter elements in MCF-7 cells (Fig. 7A) (29). No specific enrichment was found with preimmune rabbit IgG. Additionally, consistent with the process of transcription of the gene, binding of activated phosphorylated polymerase II (P-PolII) was also observed on the −4-kb regulatory sequence of IGFBP-4. However, ER binding and subsequent P-PolII recruitment in this promoter region was not detectable in primary osteoblasts. In these cells, ER binds in the first intronic region of the IGFBP4 promoter in osteoblasts located on chromosome 17 in the region 35858279–35859554. In addition to ER, ATF4 and P-PolII recruitment was detected, suggesting that this region has a previously unknown regulatory element that is used in primary osteoblasts (Fig. 7A). The cell-specific properties of the IGFBP4 gene suggests that not all binding sites are accessible for ER binding, possibly due to differences in chromosomal topology between MCF7 and primary bone cells or the presence or absence of other factors involved in IGFBP4 regulation.
The involvement of two bone-specific transcription factors, ATF4 and osterix in the transcriptional regulation of IGFBP4, was also tested. Whereas no recruitment of either of these bone-specific transcription factors was observed in MCF-7 cells, the differentiation-dependent transcription factor ATF4 was recruited to the intronic site in primary osteoblasts, therefore presumably contributing to estrogen mediated up-regulation of this gene. However, osterix, a factor required for differentiation of mesenchymal cells into osteoblasts (37) could not be detected in breast cancer cells or in differentiated osteoblasts used in this study.
We then assessed whether the pure ER antagonist ICI 182780 modulates the recruitment of ER and associated transcription factors to the IGFBP4 gene. As shown in Fig. 7A, addition of ICI 182780 to estrogen stimulated MCF7 cells inhibited the recruitment of ERα and P-Pol II to the −4-kb regulatory element in the IGFBP4 gene. Additionally, binding of ERα, ATF4, and P-Pol II to the intronic element was blocked in osteoblasts, indicating that ICI acts as a potent inhibitor of ER signaling in both cell types.
The IGFBP4 Intronic Region Acts as a Promoter
To show that the intronic region of IGFBP4 acts as a promoter, MCF7 cells and U2OS stably expressing ERα66 under the control of tetracycline (doxycyclin) were transfected with an ERE-tk-luc expression vector that served as a positive control or with the 1276-bp fragment of IGFBP4 intron1 (Fig. 7B). After stimulation of the U2OS-TET-ER with low concentration of doxycyclin (1 nm) to induce the expression of physiological levels of ERα, the IGFBP4 intronic construct was activated by addition of E2. E2 regulation of the IGFBP4 intronic region occurred predominantly in the bone cell line, with only minor activation detectable in the MCF-7 cells (Fig. 7B). In contrast, the positive control ERE-tk-Luc was significantly regulated in MCF-7 cells. This provides evidence that the intronic region of the IGFBP4 gene can act as a promoter/enhancer in a cell-specific presumably tissue-restrictive manner.
It was striking that when we varied the concentrations of E2 ranging from 10−12 to 10−8 m, even low levels of E2 resulted in significant activation of the luciferase reporter gene in the U2OS-TetER cells, whereas signaling in MCF-7 was restricted to levels of 10−8 and 10−9 m E2. The activating effects on both IGFBP4 regulatory regions could be effectively blocked by the addition of ICI 182780 in both MCF7 and U2OS cells.
IGFBP4 mRNA Transcripts Are Regulated in a Cell-Specific Manner
RT-PCR was then performed to investigate whether the usage of either the promoter at −4 kb or in intron 1 of the IGFBP4 gene would give rise to different mRNA transcripts. The results in Fig. 8 demonstrate that the full-length transcript of the IGFBP4 gene (exon 1 to exon 4) is expressed in MCF7 cells exclusively, whereas no amplification product is detectable in the U2OS-Tet-ER cell line. In contrast, transcripts arising from nested amplification of exon 2 to exon 4 were detectable in both cell lines. We then tested the expression of the IGFBP4 transcripts in primary osteoblasts and found that only the shorter mRNA transcript is detectable in the primary cells. The sizes of the fragments were in agreement with those expected from the amplification of the full-length IGFBP4 transcript in MCF7 and a transcript lacking exon 1 in the bone context. These findings support the differential usage of alternative promoters and, as a consequence, the existence of different IGFBP4 transcripts in the cells tested.
Fig. 8.

RT-PCR Experiment Designed to Identify IGFBP4 mRNA Transcripts
Schematic representation of PCR and nested PCR amplification of either the full-length transcript (exon 1 to exon 4) or the mRNA lacking exon 1 (exon 2 to exon 4) of the IGFBP4 gene. The reverse-transcribed IGFBP4 cDNA variants were amplified as described above, using total RNA from MCF7,U2OS-Tet-ER66 cell lines and primary human osteoblasts. PCR products were then separated by an agarose gel and sequenced to validate the specificity of the amplified fragments. UTR, Untranslated region.
Taken together, this study reveals a comprehensive transcriptional profile and identifies several genes of potential importance in controlling estrogen-mediated signaling, also providing insight into the physiological actions of osteoblasts.
DISCUSSION
Transcriptional Profiling of Primary Osteoblasts Compared with Transfected Cell Lines
The lack of data relating to estrogen signaling in primary human bone cells was the stimulus for the identification of specific gene targets responsible for activation and inhibition of gene expression mediated by E2 treatment for 24 h. In this study, we provide a genome-wide analysis of E2-responsive genes in primary human osteoblasts and show bone-specific regulation of the direct ER target gene IGFBP4. A combination of genomics, bioinformatics, and molecular biology revealed a core set of 739 target genes from 54,000 probes on the whole genome array. Array analysis has been applied by several investigators to further the understanding of the molecular basis of osteoblast physiology, demonstrating the utility of genome wide technologies to study estrogen signaling. Transcriptional studies in bone cells evaluating estrogenic effects have used ER-negative osteoblast-like osteosarcoma cell lines that have been transfected with only one isoform of the ERs (21, 22), although several isoforms are coexpressed in the physiological context of primary human osteoblasts (15).
The results presented in this paper show a regulated transcriptome profile in primary osteoblasts that is distinct from the profile of genes regulated in transfected osteoblast-like cell lines, with only minor overlap of some target genes when we compared the results of several studies after 24-h treatment (21, 22), as shown in Table 1. However, most genes were uniquely regulated in primary osteoblasts (Figs. 1 and 4). Taken together, although it should be noted that varying platform conditions and different cut off rates have been used in previous studies, these findings indicate that the expression of physiological, albeit low, levels of ERα isoforms ERα66 and ERα46, both influencing estrogen signaling is key to the specific gene expression profile we observed in our studies. Therefore, primary cultures may represent the most pertinent osteoblast models for attempting to extrapolate in vitro estrogenic effects to in vivo relevance. For many years, questions have been raised concerning the reliability of osteosarcoma cell lines as models of osteoblast biology and as a consequence, caution should be applied to findings that are obtained from these cell lines (39, 40). Other publications have shown that E2 suppresses proliferation and changes the morphology of transfected cells. The authors conclude that the effects of E2 may result not from direct activation of endogenous genes but instead by transcriptional interference in cell lines that overexpress ER (41). Thus, as concluded by Watts and King (41), overexpression of the ER may inhibit cell proliferation by interfering with transcription, which means that ER negative bone cells that overexpress ER at high, nonphysiological levels may not serve as appropriate model system that can be compared with cells endogenously expressing moderate levels of ER and, more specifically, combinations of both ERα isoforms that have different properties. Changes in gene expression must therefore be interpreted in a way that takes the cellular context, endogenous protein expression levels and the differentiation status into consideration.
Estrogen Effects on Immunomodulatory Genes
Because estrogens influence bone remodeling and osteoblast and osteoclast numbers, it is of note that E2 showed significant regulation of cytokines and factors that are associated with cellular communication and regulation of the immune system, including cells of the monocytic lineage such as osteoclasts. Many of these genes represent new E2 target genes that have not been reported previously to be regulated in these cells (21). Several immunomodulatory genes are down-regulated in the presence of E2, presenting a mechanism by which osteoblasts control the processes of osteoclast differentiation. Moreover, it is only recently that the involvement of the immune system, mainly T-lymphocytes, has been recognized as regulators of osteoblast and osteoclast physiology (42, 43). Osteoclast formation, life span, and activity are dependent on an equilibrium of several cytokines produced by osteoblasts, stromal cells, and T-lymphocytes.
This control mechanism of osteoclast activity can be reversed in the absence of E2, thereby imbalancing the normal process of bone regeneration (44). This can result in increased activity and decreased apoptosis of osteoclasts and as a consequence, an augmented bone resorption process. Hence the decrease of estrogens during menopause should result in a dual negative effect.: the bone formation activity of osteoblasts is diminished, and the bone resorption activity of osteoclasts is not only unimpeded but is stimulated by the osteoblast.
Estrogen Effects on Signal Transduction Genes
As we monitored the expression profile at a single time point, it is likely that other regulatory profiles occur in other experimental settings. It is now evident that, in contrast to reproductive cells such as breast cancer cells, extranuclear estrogen signaling plays an important role in nonreproductive tissues including bone (8) (45). Proposed mechanisms of estrogen-regulated transcription involve either an indirect extranuclear function of ER or the action of other membrane-bound nonnuclear receptors that mediate estrogen responses. In support of this model are reported interactions of ERα with a number of signaling proteins such as Src, ras, and G proteins (46, 47). Intriguingly, 24 h after stimulation with E2 a high number of genes involved in signal transduction cascades are still highly regulated in addition to the genomic regulation of target genes. This suggests that other mechanisms, such as extranuclear activities, might also remain involved in transcriptional control of target genes at a later stage. Further binding studies on target promoters will allow us to distinguish different molecular mechanisms of transcriptional regulation.
Control of the Expression of IGFBP4
To move from total genome analysis to a specific gene highlighted by these experiments, we focused on IGFBP4 and we provide evidence that the direct estrogen target gene IGFBP4 can be modulated in a cell-specific manner. We chose the IGFBP4 gene for further study because ditag clustering suggested functional ER binding within intron 1 that had not been previously described. IGFBP4 is of physiological relevance to bone physiology, as it acts as a transport protein for IGF-I and -II and modulates their biological activity with subsequent effects on osteoblast proliferation, differentiation and activity (48, 49).
Using ChIP assays sufficiently sensitive to allow the analysis of primary cells, we demonstrate that this gene displays a unique regulatory response in osteoblasts with the recruitment of a bone-specific transcription factor ATF4 that is required for terminal differentiation of osteoblasts, and posttranscriptionally regulates the synthesis of other target genes such as osteocalcin and type I collagen (50). Yang et al. (24) have shown that ATF4 represents the first transcription factor in which cell-specific protein expression is achieved posttranscriptionally by an ubiquitination-dependent process. ATF4 mRNA is found in many tissues, however, ATF4 is degraded in most cell types with the exception of osteoblasts and a few other cell types (24, 51, 52). Thus, ATF4 cannot be regarded as an exclusive osteoblast transcription factor; however, the severity and complex phenotype observed in the absence of ATF4 shows the importance of this factor in osteoblasts (24). It is striking that ATF4, after blockage of its degradation, has the capacity to induce osteoblast specific gene expression in nonosteoblastic cells (24, 54). The presence of cell-specific cofactors such as ATF4 provides additional options for cell-specific regulation of ER target genes. The impact of ATF4 in bone physiology is further established by the findings that ATF4 deficiency in knockout mice results in delayed bone formation during embryonic development and low bone mass throughout life (54). We show in Fig. 7A that the control of IGFBP4 is dependent on different gene regions and factors in different cells. In addition to the lack of a specific transcription factor, the absence of ER binding to the newly identified binding site in MCF7 may also reflect limited access due to differences in chromatin conformation compared with primary osteoblasts. This finding was confirmed by transient transfection studies that support the concept of differential usage of promoter/enhancer elements in a tissue-specific manner as this newly identified intronic region functions preferentially in bone cells (Fig. 7B), although a weak activity was also found in MCF7 cells in the highly sensitive luciferase assay at the 24-h time point tested.
It was striking that when we performed transient transfection experiments using different concentrations of E2 we observed a concentration-dependent luciferase activation in MCF7 and in primary bone cells. These results show that the concentration of E2 required to stimulate expression is significantly lower in bone cells than in MCF7. These findings suggest that this difference in required E2 levels could have real physiological consequences. This is in concordance with the studies by Ciana et al. (55) using a transgenic ERE-tk-luc reporter mouse model under the control of activated ERs that show that bone tissue exerts a significant luciferase expression during the diestrous cycle, when E2 levels are decreasing and lower than in the estrous cycle, in which luciferase expression occurs predominantly in reproductive tissues.
Consequently, different mRNA transcripts arise from the usage of these promoters, with a shorter transcript lacking IGFBP4 exon 1 being expressed in U2OS-Tet-ER cells and in primary human osteoblasts (Fig. 8).
We then evaluated the expression of a shorter IGFBP4 protein isoform due to the usage of the internal promoter. Although we have not been successful in detecting a corresponding protein isoform in primary osteoblasts in Western blot experiments (data not shown), which could be due to the lack of antibody sensitivity or the low abundance of the protein in the primary cells, IGFBP4 isoforms of the corresponding molecular size of 22 kDa have been previously described in the literature (56).
The alternative IGFBP4 promoter was previously identified by a combination of PET ditag cloning (31) and in silico transcription factor binding analysis. The initial ditag cloning procedure was performed in MCF7 cells and the outcome is a prediction on a potential binding site due to fragment enrichment in the region of the IGFBP4 intron 1. In our study, the functionality of this region was evaluated with the findings demonstrating that the IGFBP4 binding region in intron 1 is predominantly functional in bone cells with only a minor activity in our MCF7 cells.
Recently, a genome-wide analysis of EREs in MCF7 was performed by Carroll et al. (7) When we analyzed the publicly available data set, the enrichment of fragments for the IGFBP4 intronic region was confirmed. Interestingly, the group of Myles Brown (personal communication) also validated their results obtained in MCF7 cells by expression arrays and PCR up to 12 h E2 treatment and found an up-regulation of expression after 3 h estrogen treatment. This result shows that there is a time dependency in promoter usage in the cells used in the study.
The functional activity of ER is regulated not only by estrogen but also by an array of regulatory proteins such as coactivators, corepressors, and chromatin modifiers. Contrary to an earlier notion that corepressors and coactivators exist in separate complexes, these proteins, with apparently opposite functions, are increasingly being found in the same complex. This may allow for efficient transcriptional control mechanisms. These control mechanisms are in turn regulated by a number of posttranslational modifications under the influence of upstream and local signaling networks. Because the outcome of steroid hormone receptor transcriptional complexes is measured by changes in the expression of target genes, differences in the composition of coregulator complexes can modulate the impact of transcriptional complexes on gene expression. This and other studies highlight ATF4 as an example of such a cell-specific mechanism.
Another study recently reported on the functionality of estrogen control of intronic regions and their role as promoter/enhancer regions. In this report, the retinoblastoma binding protein 1 (RBBP1) genomic sequence revealed an ER response element and an Sp1 site located within the first intron of the gene that is activated in an ER isoform-dependent manner (57).
Conclusion
Clinical studies have demonstrated that estrogens induce distinct tissue-specific effects. Estrogens have agonistic effects in all tissues, even though their action can result in diverse effects. For example, estrogens promote breast cancer but prevent the development of colon cancer and a decrease in bone mass (Writing Group for Women’s Health Initiative, 2002). This study helps to gain further insight into gene regulation and specific cofactor activity that contribute to estrogen-mediated signaling in primary osteoblasts. Identification of the underlying mechanisms that enable tissue specificity remains the crucial step to further advance in this field of study. The achievement of a more complete understanding of estrogen signaling should allow greater definition and integration of molecular mechanisms and open up unique opportunities for novel targeted therapies for bone diseases.
MATERIALS AND METHODS
Isolation of Bone Cells
Human primary osteoblasts were isolated from bone tissues using an explant technique. Outgrowing cells were cultivated in α-MEM + 10% fetal calf serum (FCS) + glutamine at 37 C, 5% CO2 and characterized using alkaline phosphatase marker staining (Sigma, Munich, Germany). For studies on the effect of estrogen treatment, cells were washed three times with PBS and cultivated in phenol red-free medium supplemented with 2.5% charcoal-stripped FCS before incubating for 24 h with E2 (10 nm), ICI 182780 (ICI, 1 μm), ICI + E2 or ethanol (EtOH) (diluent control) and in further experiments to evaluate direct target genes in conjunction with CHX (CHX + E2, CHX alone).
Transcriptome Analysis: Experimental Design and Procedure
Comparative transcriptome profiling of untreated primary human osteoblasts and osteoblasts treated for 24 h with 10 nm E2, EtOH, or ICI 182780 (1 nm) was performed using the Amersham (Freiburg, Germany) whole human genome 55K array, following the manufacturer’s instructions. For the analysis of ER-responsive genes and direct target genes, respectively, treatments with the E2 antagonist ICI + E2 and CHX + E2 were performed. We also treated the cells with ICI and CHX alone to control the direct effects of these compounds, independent of E2. The complete raw data set of the samples analyzed have been submitted to the Arrayexpress database located at the European Bioinformatics Institute (EBI, Hinxton, UK), under the accession no. E-MEXP-1053.
Three individual RNA isolations from three biological replicates were prepared for each condition, which were validated for integrity on preparation and through the process of generating singly Cy5 labeled cRNA using the Agilent (Waldbronn, Germany) 2100 bioanalyzer. After hybridization and washing, the processed array was scanned using an Axom scanner, spots grided, assigned and the intensity of each spot then calculated. The resulting data were then normalized on a per chip basis by dividing each measurement by the 50th percentile of all measurements on the chip, and then E2-treated samples were normalized to the median result of the array and imported into the GeneSpring software package (Silicon Genetics, Redwood City, CA), which was used to integrate the replicates and to compare the different conditions. E2- or ICI-treated samples were compared with vehicle-treated control samples. Data were filtered to include only samples that could be consistently detected (present flags) and had a relative expression level above 0.2. Genes that were changed greater than 1.5-fold relative to E2-free levels were considered as significantly regulated. Additionally, to provide an estimate of false discovery rates for multiple testing, a significance analysis for microrrays was performed on the data.
Quantitative PCR
Real-time PCR was carried out on a subset of up- and down-regulated genes to verify regulation as assessed by microarray analysis. RNA was prepared from 16 different primary human osteoblast cultures using the TriZol reagent (Invitrogen, Carlsbad, CA). Reverse transcription using poly-deoxythymidine oligos (Roche, Indianapolis, IN) was then performed on 1 μg RNA that had been treated with ribonuclease-free deoxyribonuclease I (Roche). Quantitative PCR was performed using SybrGreen as a marker for DNA amplification on an ABI prism 7700 with 40 cycles of a stepwise amplification (once for 2 min at 50 C, once for 10 min at 95 C, 40 times for 15 sec at 95 C followed by measurement for 1 min at 60 C). Each real-time PCR consisted of 5 μl reverse transcription product and 1× SYBR Green PCR Master Mix (Applied Biosystems, Darmstadt, Germany). The fold change of expression was calculated using β-actin as an internal reference gene and the expression level was determined relative to the vehicle treated control.
Detection of ER Binding Sites/Direct Target Gene
Parameters were chosen on the basis of optimized settings for the Dragon ERE Finder (58) using a 83% detection frequency in training data sets. These settings were subsequently applied to the test data sets. Statistical significance of binding-site enrichment between putative target genes and nonresponsive genes was determined by Monte Carlo simulations between predictions in defined gene sets and randomly generated genes sets. A set of Monte Carlo simulations was performed to assess the significance of the apparent enrichment of putative EREs between the set of estrogen direct target genes and the nonresponsive genes. In each simulation, we randomly generated two sets of genes (equivalent in sizes to the set of direct target and nonresponsive genes), plotted the curves accordingly, and calculated the difference between the areas under the two curves. The simulations were performed 100,000,000 times and the fraction of times in the simulations that the random area-difference was at least as large as the observed area difference was reported as the empirical P value. Most significant direct target genes used in the analysis were ranked by the lowest P values from analysis of E2-treated and control samples, E2 and E2 + ICI samples, and E2 and E2 + CHX samples. Nonresponsive genes were ranked by highest P values from the same analysis.
Identification of IGFBP4 Intronic ER Binding Site by ChIP-PET
The IGFBP4 intronic ER binding site was identified in a whole-genome binding site mapping study by ChIP and application of Paired End diTag (PET) technology (31). ChIP DNA fragments were then cloned into a specialized construct (36), and a PET library was generated and sequenced as described in previous studies (6, 36).
ChIP
Chromatin of primary human osteoblasts after 24 h treatment was cross-linked using 1% formaldehyde (HPLC grade; Merck, Darmstadt, Germany) for 15 min at 37 C, and the cells were collected after two washings with PBS in 1 ml cell collection buffer [100 mm Tris-HCl (pH 7.4) and 100 mm dithiothreitol]. The cell suspension was then incubated on ice for 15 min and at 30 C for 15 min. Cells were then washed sequentially by suspension and 5 min centrifugation at 2000 × g at 4 C with 1 ml Buffer A [10 mm EDTA, 0.5 mm EGTA, 10 mm HEPES (pH 6.5), and 0.25% Triton X-100] and 1 ml Buffer B [1 mm EDTA, 0.5 mm EGTA, 10 mm HEPES (pH 6.5), and 200 mm NaCl], and sonicated three times for 10 sec at 4 C and maximum settings (Sonifier Cell Disruptor, Branson, Danbury, CT) in 100 μl lysis buffer [10 mm EDTA, 50 mm Tris-HCl (pH 8.0), 1% sodium dodecyl sulfate (SDS)]. After centrifugation, 10 μl of the supernatants were used as inputs, and the remainder diluted 2.5-fold in immunoprecipitation buffer [2 mm EDTA, 100 mm NaCl, 20 mm Tris-HCl (pH 8.1) and 0.5% Triton X-100]. This diluted fraction was subjected to immunoprecipitation overnight [after 2 h preclearing at 4 C with 20 μl preimmune IgG (Sigma)], 5 μg sheared salmon sperm DNA (Sigma), and 50 μl of a 50% protein A-Sepharose beads (Sigma) slurry. For the precipitation of transcription factor complexes, 1 μl of specific antibodies for ER-α (HC20), ATF4 or CREB2 (all three from Santa Cruz Biotechnology, Santa Cruz, CA) and P-Pol II (Upstate, Lake Placid, NY) were used. Beads were prepared by three washings in PBS, and resuspension in 1 mm EDTA, 10 mm Tris-HCl (pH 8.1). Complexes were recovered by a 2-h incubation at 4 C with 2 μg of sheared salmon sperm DNA and 50 μl of protein A-Sepharose. Precipitates were serially washed with washing buffer (WB) I [2 mm EDTA, 20 mm Tris-HCl (pH 8.0), 0.1% SDS, 1% Triton X-100, 150 mm NaCl], WB II [2 mm EDTA, 20 mm Tris-HCl (pH 8.0)], WB III [1 mm EDTA, 10 mm Tris-HCl (pH 8.0), 1% Nonidet P-40, 1% Deoxycholate, 0.25 m LiCl] and then twice with Tris/EDTA buffer. Immunoprecipitated complexes were removed from the beads with 150 μl of 1% SDS, 0.1 m NaHCO3. All buffers contained a protease inhibitor cocktail (CompleteMini, Roche, Germany). Cross-linking was reversed by incubation at 65 C overnight. and the DNA was purified with QIAquick purification columns (QIAGEN, Hilden, Germany). Then, PCR was performed using the following IGFBP4 specific primers. P1 forward, 5′GATAAGGCCTGAAGCTCAGAGAG; P2 reverse, GAGAGAGATGATCCTTGAGCCAA (purchased from MWG Biotech, Martinsreid, Germany).
Bioinformatical Analysis and Data Mining
To further analyze the gene lists obtained from the microarray analysis, we used the Genomatix software suite, which combine several data mining sources [Bibliosphere, Gene2Promoter and GEMS-Launcher (MatInspector and FrameWorker)] to integrate and combine bioinformatics data to detect further insight into promoter structure, transcription factor binding sites, gene interaction networks and signaling pathways. BiblioSphere was used for literature and pathway mining (59). In brief BiblioSphere was applied to identify relevant functional networks by displaying gene-gene co-citations and overlaying promoter analysis results. In addition the software was used for gene classification with different ontologies. Gene2Promoter was used for the retrieval of promoter sequences under study. The Programs MatInspector and FrameWorker, which are part of the GEMS-Launcher package, were applied for transcription factor analysis and the retrieval of conserved transcription factor frameworks (60). This enables an integration of transcriptome profiles obtained from the microarray analysis.
Cloning of the IGFBP4 Intron 1 Construct
The IGFBP4 intronic sequence located on chromosome 17 between positions 35858279–35859554 was isolated from human genomic DNA by PCR amplification of the 1276-bp fragment using specific primers (forward primer, 5′ GGAATAGGTCTGACTTCACTC; reverse primer, CTCTCTCTCTCTCCTTTTT) flanked by HindIII and XhoI restriction sites that facilitate cloning into the pGL3-luciferase vector (Promega, Madison, WI). All clones were verified by sequencing.
Transfection Studies
The breast carcinoma cell line MCF-7 that endogeneously express ERα, and the human U2OS cell line stably transfected with ERα (kindly provided by D. Monroe, University of North Carolina, Chapel Hill, NC) were used in transient transfection experiments. Cells were cultured in phenol red-free DMEM/F12 media containing 10% fetal calf serum, 5 mg/liter blasticidin S (Roche) and 500 mg/liter zeocin (Invitrogen). E2 (10 nm) or control (EtOH) treatment was performed in charcoal-stripped FCS-containing media. The expression of ERα was induced by the addition of 1 ng doxycyclin (Doxy; Sigma) in U2OS cells. For transient transfection studies cells were plated at a density of 60% in six-well plates. The IGFBP4 construct was transiently transfected in triplicate using the Ex-gene (Fermentas, St. Leon-Rot, Germany) transfection reagent (Biopolymers). Cells were washed twice and incubated with 1 ng/ml doxycyclin and either ethanol control, E2 (10 nm) in the absence or presence of ICI 182,780 in stripped medium for 24 h. Cells were harvested and 1 μl of protein extract was assayed using Luciferase Assay reagent (Promega).
RT-PCR of IGFBP4
RNA was prepared from MCF7 cells and U2OS-TeT-ERα66 cell lines using the TriZol reagent (Invitrogen, Carlsbad, CA). Reverse transcription using poly-deoxythymidine oligos was then performed on 1 μg RNA that had been treated with ribonuclease-free deoxyribonuclease I. PCR was performed using the following standard protocol and Fast Start polymerase (Roche) with 30 cycles of amplification (94C for 2 min, then 30 cycles of 94 C for 1 min, 60 C for 1 min, 72 C for 1 min), using specific primer pairs for amplification and nested PCR rounds as shown in Fig. 8.
Acknowledgments
We are grateful to D. Parsch, University of Heidelberg, for providing the human primary bone tissue samples used in this study and D. Monroe and S. Johnsen for providing the U2OS cell line stably expressing ERα66 (21 ).
NURSA Molecule Pages:
Coregulators: SMRT;
Ligands: 17β-Estradiol | Fulvestrant;
Nuclear Receptors: ERα.
Footnotes
This work was supported by the EC 6th Framework Program Grants ANABONOS (LSHM-CT-2003-503020) and CRESCENDO (LSHM-CT-2005-018652).
Disclosure Statement: The authors have nothing to disclose.
First Published Online October 25, 2007
Abbreviations: ATF4, Activating transcription factor 4; ChIP, chromatin immunoprecipitation; CHX, cycloheximide; CREB, cAMP response element binding protein; E2, estradiol; ER, estrogen receptor; ERE, estrogen-responsive element; EtOH, ethanol; FCS, fetal calf serum; GRIM, retinoid-interferon induced mortality; IGFBP, IGF binding protein; IRF4, interferon regulatory factor 4; PET, Paired End diTag; SDS, sodium dodecyl sulfate; SMRT, silencing mediator for retinoid and thyroid hormone receptors; WB, washing buffer.
References
- 1.Manolagas SC, Kousteni S, Jilka RL 2002. Sex steroids and bone. Recent Prog Horm Res 57:385–409 [DOI] [PubMed] [Google Scholar]
- 2.Green S, Walter P, Kumar V, Krust A, Bornert JM, Argos P, Chambon P 1986. Human oestrogen receptor cDNA: sequence, expression and homology to v-erb-A. Nature 320:134–139 [DOI] [PubMed] [Google Scholar]
- 3.Mosselman S, Polman J, Dijkema R 1996. ER β: identification and characterization of a novel human estrogen receptor. FEBS Lett 392:49–53 [DOI] [PubMed] [Google Scholar]
- 4.A unified nomenclature system for the nuclear receptor superfamily 1999. Cell 97:161–163 [DOI] [PubMed] [Google Scholar]
- 5.Robinson-Rechavi M, Escriva GH, Laudet V 2003. The nuclear receptor superfamily. J Cell Sci 116:585–586 [DOI] [PubMed] [Google Scholar]
- 6.Lin CY, Vega VB, Thomsen JS, Zhang T, Kong SL, Xie M, Chiu KP, Lipovich L, Barnett DH, Stossi F, Yeo A, George J, Kuznetsov VA, Lee YK, Charne TH, Palanisamy N, Miller LD, Cheung E, Katzenellenbogen B, Ruan Y, Bourque G, Wei CL, Liu ET 2007. Whole-genome cartography of estrogen receptor α binding sites. PLOS Genet 6:1–19 [DOI] [PMC free article] [PubMed] [Google Scholar]
- 7.Carroll JS, Meyer CA, Song J, Li W, Geistlinger TR, Eeckhoute J, Brodsky AS, Keeton EK, Fertuck KC, Hall GF, Wang Q, Bekiranov S, Sementchenko V, Fox EA, Silver PA, Gingeras TR, Liu XS, Brown M 2006. Genome-wide analysis of estrogen receptor binding sites. Nat Genet 38:1289–1297 [DOI] [PubMed] [Google Scholar]
- 8.Kushner PJ, Agard DA, Greene GL, Scanlan TS, Shiau AK, Uht RM, Webb P 2000. Estrogen receptor pathways to AP-1. J Steroid Biochem Mol Biol 74:311–317 [DOI] [PubMed] [Google Scholar]
- 9.Saville B, Wormke M, Wang F, Nguyen T, Enmark E, Kuiper G, Gustafsson JA, Safe S 2000. Ligand-, cell-, and estrogen receptor subtype (α/β)-dependent activation at GC-rich (Sp1) promoter elements. J Biol Chem 275:5379–5387 [DOI] [PubMed] [Google Scholar]
- 10.Kousteni S, Han L, Chen JR, Almeida M, Plotkin LI, Bellido T, Manolagas SC 2003. Kinase-mediated regulation of common transcription factors accounts for the bone-protective effects of sex steroids. J Clin Invest 111:1651–1664 [DOI] [PMC free article] [PubMed] [Google Scholar]
- 11.Kennedy AM, Shogren KL, Zhang M, Turner RT, Spelsberg TC, Maran A 2005. 17β-Estradiol-dependent activation of signal transducer and activator of transcription-1 in human fetal osteoblasts is dependent on Src kinase activity. Endocrinology 146:201–207 [DOI] [PubMed] [Google Scholar]
- 12.Brzozowski AM, Pike AC, Dauter Z, Hubbard RE, Bonn T, Engstrom O, Ohman L, Greene GL, Gustafsson JA, Carlquist M 1997. Molecular basis of agonism and antagonism in the oestrogen receptor. Nature 389:753–758 [DOI] [PubMed] [Google Scholar]
- 13.Reid G, Hubner MR, Metivier R, Brand H, Denger S, Manu D, Beaudouin J, Ellenberg J, Gannon F 2003. Cyclic, proteasome-mediated turnover of unliganded and liganded ERα on responsive promoters is an integral feature of estrogen signaling. Mol Cell 11:695–707 [DOI] [PubMed] [Google Scholar]
- 14.Metivier R, Penot G, Hubner MR, Reid G, Brand H, Kos M, Gannon F 2003. Estrogen receptor-α directs ordered, cyclical, and combinatorial recruitment of cofactors on a natural target promoter. Cell 115:751–763 [DOI] [PubMed] [Google Scholar]
- 15.Sanchez R, Nguyen D, Rocha W, White JH, Mader S 2002. Diversity in the mechanisms of gene regulation by estrogen receptors. Bioessays 24:244–254 [DOI] [PubMed] [Google Scholar]
- 16.Denger S, Reid G, Kos M, Flouriot G, Parsch D, Brand H, Korach KS, Sonntag-Buck V, Gannon F 2001. ERα gene expression in human primary osteoblasts: evidence for the expression of two receptor proteins. Mol Endocrinol 15:2064–2077 [DOI] [PubMed] [Google Scholar]
- 17.Flouriot G, Brand H, Denger S, Metivier R, Kos M, Reid G, Sonntag-Buck V, Gannon F 2000. Identification of a new isoform of the human estrogen receptor-α (hER-α) that is encoded by distinct transcripts and that is able to repress hER-α activation function 1. EMBO J 19:4688–4700 [DOI] [PMC free article] [PubMed] [Google Scholar]
- 18.Figtree GA, McDonald D, Watkins H, Channon KM 2003. Truncated estrogen receptor α 46-kDa isoform in human endothelial cells: relationship to acute activation of nitric oxide synthase. Circulation 107:120–126 [DOI] [PubMed] [Google Scholar]
- 19.Staub C, Rauch M, Ferriere F, Trepos M, Dorval-Coiffec I, Saunders PT, Cobellis G, Flouriot G, Saligaut C, Jegou B 2005. Expression of estrogen receptor ESR1 and its 46-kDa variant in the gubernaculum testis. Biol Reprod 73:703–712 [DOI] [PubMed] [Google Scholar]
- 20.Faye JC, Toulas C, Bayard F 1989. Differential estrogenic responsiveness of MCF-7 cells. Relationship to the presence of two different estrogen receptors. J Recept Res 9:203–219 [DOI] [PubMed] [Google Scholar]
- 21.Monroe DG, Getz BJ, Johnsen SA, Riggs BL, Khosla S, Spelsberg TC 2003. Estrogen receptor isoform-specific regulation of endogenous gene expression in human osteoblastic cell lines expressing either ERα or ERβ. J Cell Biochem 90:315–326 [DOI] [PubMed] [Google Scholar]
- 22.Stossi F, Barnett DH, Frasor J, Komm B, Lyttle CR, Katzenellenbogen BS 2004. Transcriptional profiling of estrogen-regulated gene expression via estrogen receptor (ER) α or ERβ in human osteosarcoma cells: distinct and common target genes for these receptors. Endocrinology 145:3473–3486 [DOI] [PubMed] [Google Scholar]
- 23.Kian TM, Rogatsky I, Tzagarakis-Foster C, Cvoro A, An J, Christy RJ, Yamamoto KR, Leitman DC 2004. Estradiol and selective estrogen receptor modulators differentially regulate target genes with estrogen receptors α and β. Mol Biol Cell 15:1262–1272 [DOI] [PMC free article] [PubMed] [Google Scholar]
- 24.Yang X, Matsuda K, Bialek P, Jacquot S, Masuoka HC, Schinke T, Li L, Brancorsini S, Sassone-Corsi P, Townes TM, Hanauer A, Karsenty G 2004. ATF4 is a substrate of RSK2 and an essential regulator of osteoblast biology; implication for Coffin-Lowry syndrome. Cell 117:387–398 [DOI] [PubMed] [Google Scholar]
- 25.Yang X, Karsenty G 2004. ATF4, the osteoblast accumulation of which is determined post-translationally, can induce osteoblast-specific gene expression in non-osteoblastic cells. J Biol Chem 279:47109–47114 [DOI] [PubMed] [Google Scholar]
- 26.Marecki S, Atchison ML, Fenton MJ 1999. Differential expression and distinct functions of IFN regulatory factor 4 and IFN consensus sequence binding protein in macrophages. J Immunol 163:2713–2722 [PubMed] [Google Scholar]
- 27.Metivier R, Penot G, Carmouche RP, Hubner MR, Reid G, Denger S, Manu D, Brand H, Kos M, Benes V, Gannon F 2004. Transcriptional complexes engaged by apo-estrogen receptor-α isoforms have divergent outcomes. EMBO J 23:3653–3666 [DOI] [PMC free article] [PubMed] [Google Scholar]
- 28.Jones JI, Clemmons DR 1995. Insulin-like growth factors and their binding proteins: biological actions. Endocr Rev 16:3–34 [DOI] [PubMed] [Google Scholar]
- 29.Bourdeau V, Deschenes J, Metivier R, Nagai Y, Nguyen D, Bretschneider N, Gannon F, White JH, Mader S 2004. Genome-wide identification of high-affinity estrogen response elements in human and mouse. Mol Endocrinol 18:1411–1427 [DOI] [PubMed] [Google Scholar]
- 30.Lufei C, Ma J, Huang G, Zhang T, Novotny-Diermayr V, Ong CT, Cao X 2003. GRIM-19, a death-regulatory gene product, suppresses Stat3 activity via functional interaction. EMBO J 22:1325–1335 [DOI] [PMC free article] [PubMed] [Google Scholar]
- 31.Lin CY, Strom A, Vega VB, Kong SL, Yeo AL, Thomsen JS, Chan WC, Doray B, Bangarusamy DK, Ramasamy A, Vergara LA, Tang S, Chong A, Bajic VB, Miller LD, Gustafsson JA, Liu ET 2004. Discovery of estrogen receptor α target genes and response elements in breast tumor cells. Genome Biol 5:R66 [DOI] [PMC free article] [PubMed]
- 32.Frasor J, Danes JM, Komm B, Chang KC, Lyttle CR, Katzenellenbogen BS 2003. Profiling of estrogen up- and down-regulated gene expression in human breast cancer cells: insights into gene networks and pathways underlying estrogenic control of proliferation and cell phenotype. Endocrinology 144:4 562–4574 [DOI] [PubMed] [Google Scholar]
- 33.Weitzmann MN, Pacifici R 2006. Estrogen regulation of immune cell bone interactions. Ann NY Acad Sci 1068:256–274 [DOI] [PubMed] [Google Scholar]
- 34.Wei CL, Wu Q, Vega VB, Chiu KP, Ng P, Zhang T, Shahab A, Yong HC, Fu Y, Weng Z, Liu J, Zhao XD, Chew JL, Lee YL, Kuznetsov VA, Sung WK, Miller LD, Lim B, Liu ET, Yu Q, Ng HH, Ruan Y 2006. A global map of p53 transcription-factor binding sites in the human genome. Cell 124:207–219 [DOI] [PubMed] [Google Scholar]
- 35.Loh YH, Wu Q, Chew JL, Vega VB, Zhang W, Chen X, Bourque G, George J, Leong B, Liu J, Wong KY, Sung KW, Lee CW, Zhao XD, Chiu KP, Lipovich L, Kuznetsov VA, Robson P, Stanton LW, Wei CL, Ruan Y, Lim B, Ng HH 2006. The Oct4 and Nanog transcription network regulates pluripotency in mouse embryonic stem cells. Nat Genet 38:431–440 [DOI] [PubMed] [Google Scholar]
- 36.Ng P, Wei CL, Sung WK, Chiu KP, Lipovich L, Ang CC, Gupta S, Shahab A, Ridwan A, Wong CH, Liu ET, Ruan Y 2005. Gene identification signature (GIS) analysis for transcriptome characterization and genome annotation. Nat Methods 2:105–111 [DOI] [PubMed] [Google Scholar]
- 37.Nakashima K, Zhou X, Kunkel G, Zhang Z, Deng JM, Behringer RR, de Crombrugghe B 2002. The novel zinc finger-containing transcription factor osterix is required for osteoblast differentiation and bone formation. Cell 108:17–29 [DOI] [PubMed] [Google Scholar]
- 38.Lin CY, Vega VB, Thomsen JS, Zhang T, Kong SL, Xie M, Chiu KP, Lipovich L, Barnett DH, Stossi F, Yeo A, George J, Kuznetsov VA, Lee YK, Charn TH, Palanisamy N, Miller LD, Cheung E, Katzenellenbogen BS, Ruan Y, Bourque G, Wei CL, Liu ET 2007. Whole-genome cartography of estrogen receptor α binding sites. PLoS Genet 3:e87 [DOI] [PMC free article] [PubMed]
- 39.Stein GS, Lian JB 1993. Molecular mechanisms mediating proliferation/differentiation interrelationships during progressive development of the osteoblast phenotype. Endocr Rev 14:424–442 [DOI] [PubMed] [Google Scholar]
- 40.Clover J, Gowen M 1994. Are MG-63 and HOS TE85 human osteosarcoma cell lines representative models of the osteoblastic phenotype? Bone 15:585–591 [DOI] [PubMed] [Google Scholar]
- 41.Watts CK, King RJ 1994. Overexpression of estrogen receptor in HTB 96 human osteosarcoma cells results in estrogen-induced growth inhibition and receptor cross talk. J Bone Miner Res 9:1251–1258 [DOI] [PubMed] [Google Scholar]
- 42.Weitzmann MN, Pacifici R 2005. The role of T lymphocytes in bone metabolism. Immunol Rev 208:154–168 [DOI] [PubMed] [Google Scholar]
- 43.Teitelbaum SL 2004. Postmenopausal osteoporosis, T cells, and immune dysfunction. Proc Natl Acad Sci USA 101:16711–16712 [DOI] [PMC free article] [PubMed] [Google Scholar]
- 44.Manolagas SC, Jilka RL 1995. Bone marrow, cytokines, and bone remodeling. Emerging insights into the pathophysiology of osteoporosis. N Engl J Med 332:305–311 [DOI] [PubMed] [Google Scholar]
- 45.Cheskis BJ 2004. Regulation of cell signalling cascades by steroid hormones. J Cell Biochem 93:20–27 [DOI] [PubMed] [Google Scholar]
- 46.Migliaccio A, Piccolo D, Castoria G, Di Domenico M, Bilancio A, Lombardi M, Gong W, Beato M, Auricchio F 1998. Activation of the Src/p21ras/Erk pathway by progesterone receptor via cross-talk with estrogen receptor. EMBO J 17:2008–2018 [DOI] [PMC free article] [PubMed] [Google Scholar]
- 47.Wyckoff MH, Chambliss KL, Mineo C, Yuhanna IS, Mendelsohn ME, Mumby SM, Shaul PW 2001. Plasma membrane estrogen receptors are coupled to endothelial nitric-oxide synthase through Gα(i). J Biol Chem 276:27071–27076 [DOI] [PubMed] [Google Scholar]
- 48.Radcliff K, Tang TB, Lim J, Zhang Z, Abedin M, Demer LL, Tintut Y 2005. Insulin-like growth factor-I regulates proliferation and osteoblastic differentiation of calcifying vascular cells via extracellular signal-regulated protein kinase and phosphatidylinositol 3-kinase pathways. Circ Res 96:398–400 [DOI] [PubMed] [Google Scholar]
- 49.Birnbaum RS, Wiren KM 1994. Changes in insulin-like growth factor-binding protein expression and secretion during the proliferation, differentiation, and mineralization of primary cultures of rat osteoblasts. Endocrinology 135:223–230 [DOI] [PubMed] [Google Scholar]
- 50.Ducy P, Karsenty G 2000. The family of bone morphogenetic proteins. Kidney Int 57:2207–2214 [DOI] [PubMed] [Google Scholar]
- 51.Hettmann T, Barton K, Leiden JM 2000. Microphthalmia due to p53-mediated apoptosis of anterior lens epithelial cells in mice lacking the CREB-2 transcription factor. Dev Biol 222:110–123 [DOI] [PubMed] [Google Scholar]
- 52.Tanaka T, Tsujimura T, Takeda K, Sugihara A, Maekawa A, Terada N, Yoshida N, Akira S 1998. Targeted disruption of ATF4 discloses its essential role in the formation of eye lens fibres. Genes Cells 3:801–810 [DOI] [PubMed] [Google Scholar]
- 53.Ducy P, Karsenty G 1995. Two distinct osteoblast-specific cis-acting elements control expression of a mouse osteocalcin gene. Mol Cell Biol 15:1858–1869 [DOI] [PMC free article] [PubMed] [Google Scholar]
- 54.Masuoka HC, Townes TM 2002. Targeted disruption of the activating transcription factor 4 gene results in severe fetal anemia in mice. Blood 99:736–745 [DOI] [PubMed] [Google Scholar]
- 55.Ciana P, Raviscioni M, Mussi P, Vegeto E, Que I, Parker MG, Lowik C, Maggi A 2003. In vivo imaging of transcriptionally active estrogen receptors. Nat Med 9:82–86 [DOI] [PubMed] [Google Scholar]
- 56.Durham SK, Riggs BL, Harris SA, Conover CA 1995. Alterations in insulin-like growth factor (IGF)-dependent IGF-binding protein-4 proteolysis in transformed osteoblastic cells. Endocrinology 136:1374–1380 [DOI] [PubMed] [Google Scholar]
- 57.Monroe DG, Secreto FJ, Hawse JR, Subramaniam M, Khosla S, Spelsberg TC 2006. Estrogen receptor isoform-specific regulation of the retinoblastoma-binding protein 1 (RBBP1) gene: roles of AF1 and enhancer elements. J Biol Chem 281:28596–28604 [DOI] [PubMed] [Google Scholar]
- 58.Bajic VB, Tan SL, Chong A, Tang S, Strom A, Gustafsson JA, Lin CY, Liu ET 2003. Dragon ERE Finder version 2: A tool for accurate detection and analysis of estrogen response elements in vertebrate genomes. Nucleic Acids Res 31:3605–3607 [DOI] [PMC free article] [PubMed] [Google Scholar]
- 59.Scherf M, Epple A, Werner T 2005. The next generation of literature analysis: integration of genomic analysis into text mining. Brief Bioinform 6:287–297 [DOI] [PubMed] [Google Scholar]
- 60.Cartharius K, Frech K, Grote K, Klocke B, Haltmeier M, Klingenhoff A, Frisch M, Bayerlein M, Werner T 2005. MatInspector and beyond: promoter analysis based on transcription factor binding sites. Bioinformatics 21:2933–2942 [DOI] [PubMed] [Google Scholar]