

Photoemission established KHgSb as a nonsymmorphic topological insulator, which hosts hourglass-shaped surface states.
Keywords: nonsymmorphic materials, topological insulator, Hourglass fermion
Abstract
Topological insulators (TIs) host novel states of quantum matter characterized by nontrivial conducting boundary states connecting valence and conduction bulk bands. All TIs discovered experimentally so far rely on either time-reversal or mirror crystal symmorphic symmetry to protect massless Dirac-like boundary states. Several materials were recently proposed to be TIs with nonsymmorphic symmetry, where a glide mirror protects exotic surface fermions with hourglass-shaped dispersion. However, an experimental confirmation of this new fermion is missing. Using angle-resolved photoemission spectroscopy, we provide experimental evidence of hourglass fermions on the (010) surface of crystalline KHgSb, whereas the (001) surface has no boundary state, in agreement with first-principles calculations. Our study will stimulate further research activities of topological properties of nonsymmorphic materials.
INTRODUCTION
The discovery of symmetry-protected states of matter in time-reversal topological insulators (TIs) and topological semimetals (1–9) has attracted tremendous interest in a wide range of areas from condensed matter physics to materials science and high-energy physics. The first discovered TI (10) has time-reversal symmetry with Kramers degeneracy protecting nontrivial conducting states on the boundary. Over the past decade, the classification of topological insulating phases has been theoretically extended to many other discrete symmetry classes (11–18). Among these, we mention particle-hole symmetry for topological superconductors, certain magnetic translation symmetry for antiferromagnetic TIs, and crystal symmetries for topological crystalline insulators (TCIs). TCIs studied in the past rely on the presence of a symmorphic mirror plane. In all the previously known cases, time-reversal and/or crystal symmetry generically protects massless boundary states with the usual Dirac-like dispersion (10, 19). Among spatial symmetries, symmorphic symmetries preserve the origin, whereas nonsymmorphic symmetries unavoidably translate the origin by a rational fraction of the lattice vector. The fractional translation could, in principle, play an important role in the classification of band topologies without analog in symmorphic crystals (20, 21). Very recently, Wang et al. (22) and Alexandradinata et al. (23) proposed the first theory of nonsymmorphic time reversal–invariant insulators. In contrast to the surface Dirac fermions ubiquitous in symmorphic TIs, nonsymmorphic TIs exhibit exotic surface fermions with hourglass-shaped dispersion (Fig. 1A). Wang et al. (22) also proposed that this new kind of TI can be realized in the series of three materials KHgX (X = As, Sb, and Bi).
Fig. 1. Hourglass fermions predicted in KHgSb with nonsymmorphic spatial symmetry.
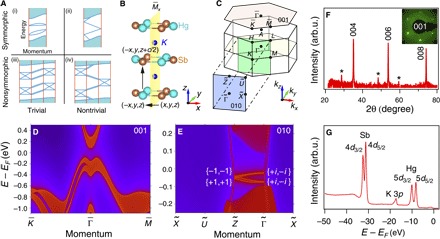
(A) Schematic surface state bands for materials with symmorphic and nonsymmorphic spatial symmetries. Panels (i) and (ii) present topologically trivial and nontrivial cases with symmorphic spatial symmetry, respectively. Panels (iii) and (iv) are the same as (i) and (ii), respectively, but with nonsymmorphic spatial symmetry showing hourglass-shaped surface band dispersion. (B) Crystal structure of double-layered KHgSb with space group P63/mmc (no. 194). The yellow plane indicates the glide mirror plane preserved on the (010) side surface. The arrows and coordinates indicate the operation of the glide reflection . (C) Three-dimensional (3D) bulk BZ of KHgSb as well as its projected (001) and (010) surface BZs. (D and E) Projections of calculated bulk and surface bands on the (001) and (010) surfaces of KHgSb, respectively. The calculations show hourglass-shaped surface bands along the glide-symmetric line on the (010) surface. The complex-conjugate eigenvalues are paired as ±i pairs at and +1 (or −1) pairs at . (F) Logarithmic plot of XRD data measured on the (001) plane of KHgSb single crystal. The peaks marked by stars are from the Sb flux. Inset: LEED pattern shows the hexagonal structure of the (001) surface. arb.u., arbitrary units. (G) Core-level photoemission spectrum showing characteristic peaks of K 3p, Hg 5d, and Sb 4d core levels.
We start with a brief review of the surface state properties predicted theoretically for KHgSb, which is measured experimentally here. KHgSb has a layered crystal structure constructed from alternately stacked honeycomb HgSb and trigonal K layers. Previous ab initio calculations have predicted that the single-layered KHgSb is a weak TI, whereas the double-layered KHgSb is a trivial insulator, in which only time-reversal symmetry was considered (24). The double-layered KHgSb has a nonsymmorphic space group P63/mmc (SG 194) generated by screw rotation and glide mirror symmetries. Wang et al. (22) pointed out that the glide reflection , indicated as yellow plane in Fig. 1B, is crucial to form the hourglass fermions on the (010) surface. As illustrated in Fig. 1E, because of time-reversal symmetry, the complex-conjugate eigenvalues are paired at time reversal–invariant momenta and as ±i and +1 (or −1) pairs, respectively. The degeneracies at and have to exchange glide partners along the glide-symmetric line , resulting in an hourglass-shaped dispersion along . The crossing of the hourglass is stabilized by glide symmetry.
RESULTS
The chemical composition of KHgSb single crystals is confirmed by core-level photoemission measurements. As shown in Fig. 1G, the characteristic peaks of K, Hg, and Sb elements are observed. Because the theoretical prediction relies heavily on the nonsymmorphic crystal structure, we have performed x-ray diffraction (XRD) measurements on both single crystal and powder of KHgSb. On the basis of the XRD data, we determine that KHgSb has a nonsymmorphic double-layered structure with space group P63/mmc or P63mc (SG 186) (see the Supplementary Materials for details on structural analysis). Because both variants have the same nontrivial topology defined by the glide symmetry , our discussion will be limited to space group P63/mmc, which has been assumed in the theoretical work of Wang et al. (22). The XRD data on the (001) plane of KHgSb single crystal exhibit sharp (00l) diffraction peaks (Fig. 1F), indicating that the samples are well crystallized. The low-energy electron diffraction (LEED) pattern on the (001) surface shows a hexagonal structure, consistent with the sixfold symmetry of the crystal structure (Fig. 1F, inset).
To search for hourglass fermions, we performed systematic angle-resolved photoemission spectroscopy (ARPES) measurements to investigate the electronic structure of KHgSb. We first summarize the ARPES results recorded on the (001) surface of KHgSb in Fig. 2. The chemical potential on the pristine surface lies in the bandgap between the valence and conduction bands (Fig. 2, C and D), demonstrating the insulating nature of the bulk states in this material. The measured band dispersions along the high-symmetry lines are in good agreement with the calculated valence band structure (Fig. 2, C and D). The valence bands form an “M”-like top along both and . The band top is close to Fermi energy (EF), resulting in enhanced spectral intensity in the vicinity of at EF in Fig. 2A.
Fig. 2. Electronic structure on the KHgSb (001) surface.
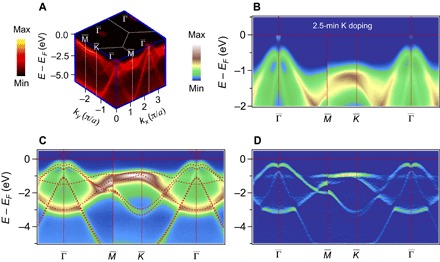
(A) 3D intensity plot of ARPES spectra showing the electronic structure of valence bands in the kx-ky plane. (B) ARPES intensity plot along after in situ K doping, showing the bottom of the conduction bands. (C) ARPES intensity plot showing band dispersions along on the pristine (001) surface. The dashed curves represent the calculated bulk bands at kz = 0. Because generalized gradient approximation (GGA) calculations usually underestimate the bandgap of semiconductors, we rigidly shifted the calculated conduction bands upward to have a 0.46-eV bandgap, which is the value determined experimentally in (B). For clarity, the chemical potential of the calculated band structure is chosen to have the best match with the measured valence band dispersions. (D) Corresponding curvature intensity plot of (C).
To observe the conduction bands, we deposited potassium atoms onto the (001) surface in situ, which dopes electrons into the surface layer and thus shifts the local chemical potential upward. The bottom of the conduction bands is observed around after deposition of potassium (Fig. 2B). No sign of surface state is observed within the bulk bandgap, in agreement with the theoretical prediction.
We then turn our focus to the ARPES results recorded on the (010) surface, where the hourglass-shaped surface state was predicted to exist. As illustrated in the top-down view of the lattice in Fig. 2B of Wang et al. (22), the crystal structure of KHgSb can also be described as a stacking of chemically equivalent monatomic layers along the (010) direction, but the interlayer coupling along (010) is much stronger than that along (001). Thus, it is more difficult to obtain a flat (010) surface by cleaving. After many attempts of in situ cleaving, we succeeded in obtaining a mirror-like (010) surface several times. Highly dispersive and well-defined bands are observed with good reproducibility. We performed photon energy dependence measurements along on the (010) surface. These measurements map the electronic structure in the Γ − M − K − Γ plane of the bulk Brillouin zone (BZ). For the bulk states, the measurements on the (010) surface with varying photon energy should be analogous to the in-plane mapping on the (001) surface at a fixed photon energy. In Fig. 3A, the Fermi surface (FS) intensity map obtained by varying photon energy on the (010) surface exhibits enhanced spectral intensity near Γ, which is consistent with our observation on the (001) surface in Fig. 2A. In addition, the FS intensity map in Fig. 3A shows two straight lines at kx = 0 and along Γ − M − K − Γ, which is perpendicular to the (010) surface.
Fig. 3. Band dispersions along on the KHgSb (010) surface.
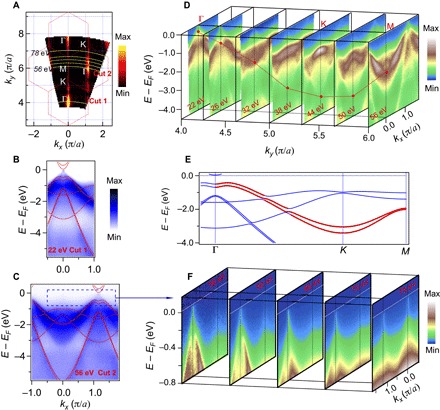
(A) ARPES intensity plot at EF recorded along by varying the photon energy from 20 to 100 eV on the (010) surface, which maps the kx-ky plane at kz = 0 of the 3D bulk BZ. The overlaid hexagons indicate the BZ structure in the kx-ky plane. (B and C) Band dispersions along cuts 1 and 2 indicated in (A), recorded with photon energy hv = 22 and 56 eV, respectively. The solid curves represent the calculated bulk bands along Γ − M. Note that the chemical potential on the (010) surface is slightly different from that on the (001) surface, most likely because of different surface chemistry effects. (D) Band dispersions along kx at different ky positions recorded with different photon energies from 22 to 56 eV. The dashed curve indicates the dispersion of one representative bulk band along Γ − K − M. (E) Calculated bulk bands along Γ − K − M. The red curves indicate the calculated bulk bands that correspond to the experimental band dispersion indicated in (D). (F) Near-EF band dispersions along kx at different ky positions recorded with different photon energies from 56 to 78 eV, showing a Dirac-like surface state band along . The momentum locations are indicated in (A).
To illuminate the origin of the straight-line FSs, we investigate the band dispersions recorded with different photon energies. In Fig. 3 (B and C), we compare the band dispersions measured along Γ − M with the calculated bulk bands. Although most of the experimental band dispersions are in good agreement with the bulk band calculations, we observe an extra feature close to EF at kx = 0 and , corresponding to the two straight lines in the FS intensity map. Figure 3D illustrates the evolution of the band dispersions upon sliding along the ky direction. The valence band top at Γ gradually sinks upon sliding from Γ to K, as indicated in Fig. 3D, which is consistent with the calculated bulk bands highlighted by red color in Fig. 3E. In contrast, the extra band is observable near EF in all the cuts in Fig. 3D, although with weaker spectral intensity around M. Figure 3F displays the near-EF band dispersions obtained with different photon energies. The extra band shows a nearly linear dispersion with the crossing point close to EF. The nondispersive feature of the extra band along ky (the momentum perpendicular to the surface) indicates its surface origin.
The measurements along indicate the existence of surface states on the (010) surface, where the hourglass-shaped surface state was predicted to exist. To capture the hourglass fermions and their connectivity to other bands in different directions of the surface BZ, we systematically investigate the low-energy electronic structure of the surface states in the (010) surface BZ in Fig. 4. Let us first review the overall surface band structure in the (010) surface BZ predicted by the calculations. The calculations show two Dirac-like bands that are split in energy along (kz = 0), leading to two Kramers points with an energy separation of 50 meV at (Fig. 4A). These bands are doubly degenerate along (kz = π) but open a small gap of 10 meV between the upper and lower branches at (Fig. 4B). The crossing points at and are nothing else but the doubly degenerate end points of the theoretically calculated hourglass-shaped dispersion along (Fig. 4, C and D).
Fig. 4. Electronic structure of surface states on the KHgSb (010) surface.
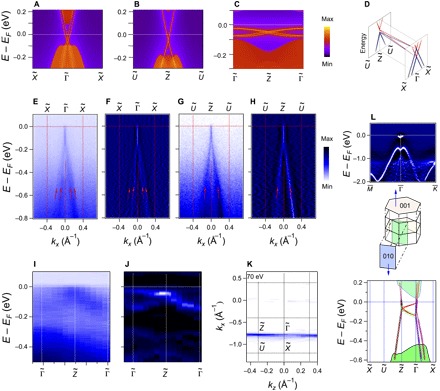
(A to C) Calculated surface band dispersions along , , and , respectively. (D) 3D sketch of the band structure of hourglass fermions along high-symmetry lines. (E and G) ARPES intensity plots showing band dispersions along and , respectively. (F and H) Corresponding curvature intensity plots of momentum distribution curves of (E) and (G), respectively. (I and J) ARPES intensity plot and corresponding curvature intensity plot along , respectively. (K) FS intensity map recorded at hv = 70 eV. (L) Summary of the experimental results recorded on the (001) and (010) surfaces. Top: Curvature intensity plot of the band dispersions along on the (001) surface. Bottom: Surface band structure along on the (010) surface. The symbols represent the extracted bands from the experimental data in (E) to (J). Middle: 3D bulk BZ of KHgSb and its projected (001) and (010) surface BZs.
Along , we observe a band splitting from the ARPES intensity plot in Fig. 4E. The band splitting is more discernible in the curvature intensity plot in Fig. 4F. Along , we observe only one Dirac-like band in Fig. 4 (G and H). These observed band dispersions are generally consistent with the calculated band structures shown in Fig. 4 (A and B). However, some fine features in the calculations remain to be identified. For instance, the band splitting along is only observed below −0.2 eV, whereas the paired crossing points at the point are not resolved. Moreover, the calculations have predicted a small gap at the point between the upper and lower branches, which is not resolved experimentally because of an insufficient resolution.
Figure 4I displays the ARPES intensity plot along , where the hourglass fermions theoretically reside. A broad peak disperses from −150 meV at to −50 meV at , which is consistent with the lower branch of the calculated hourglass bands in Fig. 4C. However, the upper branch is difficult to identify in the ARPES intensity data. In Fig. 4J, the curvature intensity plot exhibits a cross-like dispersion, which is consistent with the characteristic of the calculated hourglass fermions in Fig. 4C. However, it should be noted that band dispersions near EF in the curvature plots suffer interference from the Fermi cutoff, which could lead to some artifacts. We summarize the measured surface band dispersions on the (010) surface in the bottom panel of Fig. 4L. The surface bands along are connected to the bulk states via Dirac-like bands along and , indicating the nontrivial topology of surface states. Although the predicted hourglass fermions remain to be completely resolved, the observed (010) surface states are consistent with the global feature of the calculated band structure, thus providing strong evidence for the existence of hourglass fermions.
CONCLUSION
By mapping a large set of high-symmetry manifolds in the surface BZ, we provided the first experimental evidence that a newly proposed type of TI, hosting a novel type of surface state, exists in crystals protected by nonsymmorphic symmetry. Most of the symmetry groups in nature are nonsymmorphic and can host interesting topological classes with their own unique surface state responses. Last, nonsymmorphic symmetries can protect bulk semimetals hosting exotic types of fermions (25). All these await experimental discovery.
MATERIALS AND METHODS
Sample growth method
Single crystals of KHgSb were grown using self-flux methods. The starting materials K (99.95%; Alfa Aesar), Hg (99.9995%; Aladdin), and Sb (antimony shot, 99.999%; Alfa Aesar) were put in an Al2O3 capsule and sealed in a quartz tube. The operation was in a glove box filled with high-purity argon. We presintered the samples by heating at 200°C for 20 hours in the furnace. After that, the samples were sealed in a tantalum capsule and then in a quartz tube, followed by heating at 900°C for 10 hours and maintaining this temperature for 5 hours. Then, the samples were cooled down to 480°C at a rate of 3°C/hour and were held at this temperature for 5 to 7 days.
ARPES measurement technique
ARPES measurements were performed at the “Dreamline” beamline of the Shanghai Synchrotron Radiation Facility with a Scienta D80 analyzer. The energy and angular resolutions were set to 15 to 30 meV and 0.2°, respectively. The samples for ARPES measurements were mounted in a BIP argon (>99.9999%)–filled glove box, cleaved in situ, and measured at 30 K in a vacuum better than 5 × 10⁻¹¹ torr.
Calculation method
The Vienna Ab initio Simulation Package (26) was used for first-principles calculations. The GGA of Perdew-Burke-Ernzerhof type (27) was used for the exchange-correlation potential. Spin-orbit coupling was self-consistently taken into account. The cutoff energy for plane-wave expansion is 500 eV, and the k-point sampling grids for different structures were tested to be dense enough. The atomic structure and the lattice constants a = b = 4.78(4) Å and c = 10.22(5) Å were adapted in our calculations (22), which are very close to those determined by our powder XRD data. The KHgSb layers were stacked along the c axis, which is consistent with our experimental observations. The surface Green’s function method was used to calculate the surface states based on the maximally localized Wannier functions (28) of Hg 6s and Sb 5p orbitals obtained from ab initio calculations.
Supplementary Material
Acknowledgments
We acknowledge W. Yi, S.-F. Jin, and Z.-L. Li for refinements of the powder XRD data, as well as C. Fang, X. Dai, T.-T. Zhang, and D. Chen for valuable discussions. Funding: This work was supported by the Ministry of Science and Technology of China (2016YFA0300600, 2016YFA0401000, 2015CB921300, and 2013CB921700), the National Natural Science Foundation of China (11622435, 11474340, 11422428, 11274367, 11474330, 11504117, 11234014, 11274362, and 11674371), and the Chinese Academy of Sciences (CAS) (XDB07000000). Z.W. and B.A.B. were also supported by the Department of Energy (DE-SC0016239), NSF Early Concept Grants for Exploratory Research Award (NOA-AWD1004957), Simons Investigator Award (ONR-N00014-14-1-0330), Army Research Office Multidisciplinary University Research Initiative (W911NF-12-1-0461), NSF Materials Research Science and Engineering Center (DMR-1420541), Packard Foundation, and Schmidt Fund for Innovative Research. Y.H. acknowledges funding from the CAS Pioneer Hundred Talents Program (type C). Author contributions: H.D. and T.Q. conceived the ARPES experiments. J.M., B.L., P.Z., and T.Q. performed the ARPES measurements with the assistance of L.K., K.Y., K.K., Y.H., and S.S. Z.W., S.N., and H.W. performed ab initio calculations. C.Y., Y.S., and L.W. synthesized the single crystals. J.M., T.Q., and H.D. analyzed the experimental data. J.M., B.L., Z.W., and T.Q. plotted the figures. T.Q., H.D., B.A.B., J.M., Z.W., and P.R. wrote the manuscript. Competing interests: The authors declare that they have no competing interests. Data and materials availability: All data needed to evaluate the conclusions in the paper are present in the paper and/or the Supplementary Materials. Additional data related to this paper may be requested from the authors.
SUPPLEMENTARY MATERIALS
Supplementary material for this article is available at http://advances.sciencemag.org/cgi/content/full/3/5/e1602415/DC1
Crystal structure of KHgSb determined from powder XRD data
fig. S1. Refinements of powder XRD data of KHgSb.
fig. S2. Band inversion confirmed by HSE06.
REFERENCES AND NOTES
- 1.Hasan M. Z., Kane C. L., Colloquium: Topological insulators. Rev. Mod. Phys. 82, 3045–3065 (2010). [Google Scholar]
- 2.Qi X.-L., Zhang S.-C., Topological insulators and superconductors. Rev. Mod. Phys. 83, 1058–1105 (2011). [Google Scholar]
- 3.Wan X. G., Turner A. M., Vishwanath A., Savrasov S. Y., Topological semimetal and Fermi-arc surface states in the electronic structure of pyrochlore iridates. Phys. Rev. B 83, 205101 (2011). [Google Scholar]
- 4.Wang Z., Sun Y., Chen X.-Q., Franchini C., Xu G., Weng H. M., Dai X., Fang Z., Dirac semimetal and topological phase transitions in A3Bi (A = Na, K, Rb). Phys. Rev. B 85, 195320 (2012). [Google Scholar]
- 5.Liu Z. K., Zhou B., Zhang Y., Wang Z. J., Weng H. M., Prabhakaran D., Mo S.-K., Shen Z. X., Fang Z., Dai X., Hussain Z., Chen Y. L., Discovery of a three-dimensional topological Dirac semimetal, Na3Bi. Science 343, 864–867 (2014). [DOI] [PubMed] [Google Scholar]
- 6.Wang Z., Weng H. M., Wu Q. S., Dai X., Fang Z., Three-dimensional Dirac semimetal and quantum transport in Cd3As2. Phys. Rev. B 88, 125427 (2013). [Google Scholar]
- 7.Weng H. M., Fang C., Fang Z., Bernervig B. A., Dai X., Weyl semimetal phase in noncentrosymmetric transition-metal monophosphides. Phys. Rev. X 5, 011029 (2015). [Google Scholar]
- 8.Huang S.-M., Xu S.-Y., Belopolski I., Lee C.-C., Chang G., Wang B. K., Alidoust N., Bian G., Neupane M., Zhang C., Jia S., Bansil A., Lin H., Hasan M. Z., A Weyl fermion semimetal with surface Fermi arcs in the transition metal monopnictide TaAs class. Nat. Commun. 6, 7373 (2015). [DOI] [PMC free article] [PubMed] [Google Scholar]
- 9.Soluyanov A. A., Cresch D., Wang Z., Wu Q. S., Troyer M., Dai X., Bernevig B. A., Type-II Weyl semimetals. Nature 527, 495–498 (2015). [DOI] [PubMed] [Google Scholar]
- 10.Chen Y. L., Analytis J. G., Chu J.-H., Liu Z. K., Mo S.-K., Qi X. L., Zhang H. J., Lu D. H., Dai X., Fang Z., Zhang S. C., Fisher I. R., Hussain Z., Shen Z.-X., Experimental realization of a three-dimensional topological insulator, Bi2Te3. Science 325, 178–181 (2016). [DOI] [PubMed] [Google Scholar]
- 11.Qi X.-L., Hughes T. L., Raghu S., Zhang S.-C., Time-reversal-invariant topological superconductors and superfluids in two and three dimensions. Phys. Rev. Lett. 102, 187001 (2009). [DOI] [PubMed] [Google Scholar]
- 12.Mong R. S. K., Essin A. M., Moore J. E., Antiferromagnetic topological insulators. Phys. Rev. B 81, 245209 (2010). [Google Scholar]
- 13.Fu L., Topological crystalline insulators. Phys. Rev. Lett. 106, 106806 (2011). [DOI] [PubMed] [Google Scholar]
- 14.Shiozaki K., Sato M., Topology of crystalline insulators and superconductors. Phys. Rev. B 90, 165114 (2014). [Google Scholar]
- 15.Varjas D., de Juan F., Lu Y.-M., Space group constraints on weak indices in topological insulators arXiv:1603.04450v1 (2016). [Google Scholar]
- 16.Jadaun P., Xiao D., Niu Q., Banerjee S. K., Topological classification of crystalline insulators with space group symmetry. Phys. Rev. B 88, 085110 (2013). [Google Scholar]
- 17.Slager R.-J., Mesaros A., Juričić V., Zaanen J., The space group classification of topological band-insulators. Nat. Phys. 9, 98–102 (2013). [Google Scholar]
- 18.Lu L., Fang C., Fu L., Johnson S. G., Joannopoulos J. D., Soljačić M., Symmetry-protected topological photonic crystal in three dimensions. Nat. Phys. 12, 337–340 (2016). [Google Scholar]
- 19.Tanaka Y., Ren Z., Sato T., Nakayama K., Souma S., Takahashi T., Segawa K., Ando Y., Experimental realization of a topological crystalline insulator in SnTe. Nat. Phys. 8, 800–803 (2012). [Google Scholar]
- 20.Fang C., Fu L., New classes of three-dimensional topological crystalline insulators: Nonsymmorphic and magnetic. Phys. Rev. B 91, 161105(R) (2015). [Google Scholar]
- 21.Young S. M., Kane C. L., Dirac semimetals in two dimensions. Phys. Rev. Lett. 115, 126803 (2015). [DOI] [PubMed] [Google Scholar]
- 22.Wang Z., Alexandradinata A., Cava R. J., Bernevig B. A., Hourglass fermions. Nature 532, 189–194 (2016). [DOI] [PubMed] [Google Scholar]
- 23.Alexandradinata A., Wang Z., Bernevig B. A., Topological insulators from group cohomology. Phys. Rev. X 6, 021008 (2016). [Google Scholar]
- 24.Yan B. H., Müchler L., Felser C., Prediction of weak topological insulators in layered semiconductors. Phys. Rev. Lett. 109, 116406 (2012). [DOI] [PubMed] [Google Scholar]
- 25.Bradlyn B., Cano J., Wang Z., Vergniory M. G., Felser C., Cava R. J., Bernevig B. A., Beyond Dirac and Weyl fermions: Unconventional quasiparticles in conventional crystals. Science 353, aaf5037 (2016). [DOI] [PubMed] [Google Scholar]
- 26.Kresse G., Hafner J., Ab initio molecular dynamics for open-shell transition metals. Phys. Rev. B 48, 13115 (1993). [DOI] [PubMed] [Google Scholar]
- 27.Perdew J. P., Burke K., Ernzerhof M., Generalized gradient approximation made simple. Phys. Rev. Lett. 77, 3865 (1996). [DOI] [PubMed] [Google Scholar]
- 28.Souza I., Marzari N., Vanderbilt D., Maximally localized Wannier functions for entangled energy bands. Phys. Rev. B 65, 035109 (2001). [Google Scholar]
- 29.Vogel R., Schuster H.-U., KHgAs (Sb) und KZnAs-Ternäre Verbindungen mit modifizierter Ni2In-Struktur/KHgAs (Sb) and KZnAs-Ternary compounds in a modified Ni2In-structure. Z. Naturforsch. B 35, 114–116 (1980). [Google Scholar]
- 30.Heyd J., Scuseria G. E., Ernzerhof M., Erratum: “Hybrid functionals based on a screened Coulomb potential”. J. Chem. Phys. 124, 219906 (2006). [Google Scholar]
Associated Data
This section collects any data citations, data availability statements, or supplementary materials included in this article.
Supplementary Materials
Supplementary material for this article is available at http://advances.sciencemag.org/cgi/content/full/3/5/e1602415/DC1
Crystal structure of KHgSb determined from powder XRD data
fig. S1. Refinements of powder XRD data of KHgSb.
fig. S2. Band inversion confirmed by HSE06.