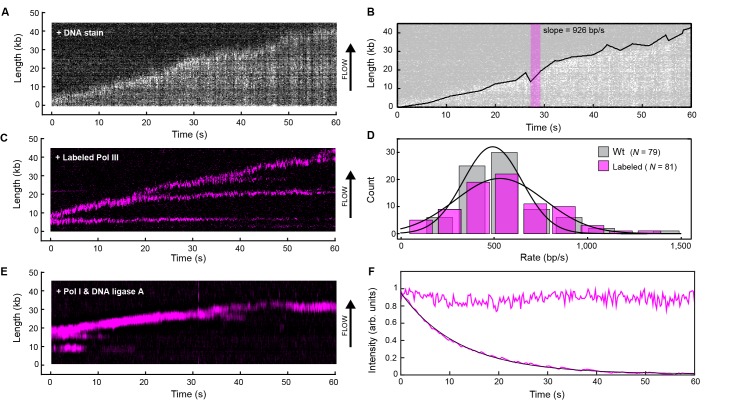
Figure 2. Real-time fluorescence imaging of coupled DNA replication.
(A) Kymograph of an individual DNA molecule undergoing coupled leading and lagging strand replication. The gray scale indicates the fluorescence intensity of stained DNA. (B) Single-molecule trajectory obtained from the kymograph in (A), used to quantify the rates and processivities of replication events. The magenta box represents an example line segment used to determine rates. (C) Kymograph of the dynamics of red-labeled Pol IIIs on an individual DNA molecule. The Pol III moves with the replisome in the direction of flow as it elongates the DNA, visible as a bright magenta spot moving away from the surface anchor point. Additional Pol IIIs are left behind the moving replisome, seen as horizontal lines on the kymograph. (D) Histograms of the rate of replication for wild-type Pol III (492 ± 23 bp/s) and red Pol III (561 ± 27 bp/s) fit to Gaussian distributions. (E) Kymograph of the distribution of red Pol III on an individual DNA molecule in the presence of 150 nM Pol I and 100 nM DNA ligase. Prolonged Pol III spots behind the replisome are no longer observed due to the action of Pol I in Okazaki fragment processing. (F) Fluorescence intensity as a function of time of individual red Pol IIIs immobilized on the surface of a coverslip (lower trace; black line is an exponential fit with lifetime = 14.1 ± 0.4 s), and of the replisomal spot in (C) (upper trace). The fluorescence lifetime of red Pol III at the replisome is much longer than the photobleaching lifetime of the dye. The errors represent the standard errors of the mean.
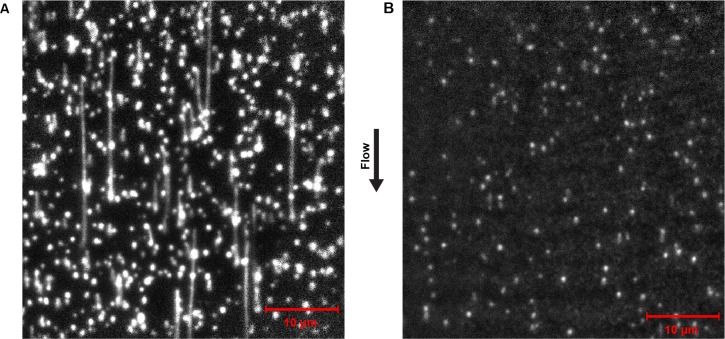
Figure 2—figure supplement 1. Representative field of view of SYTOX orange-stained dsDNA from the single-molecule rolling-circle DNA replication assay.
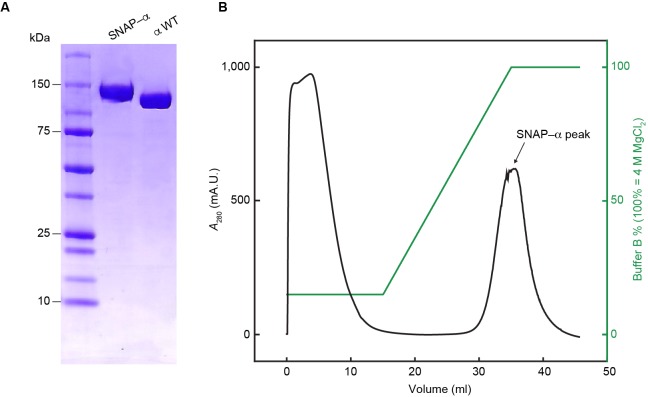
Figure 2—figure supplement 2. Separation of proteolytic fragments of SNAP-α from full-length SNAP-α.
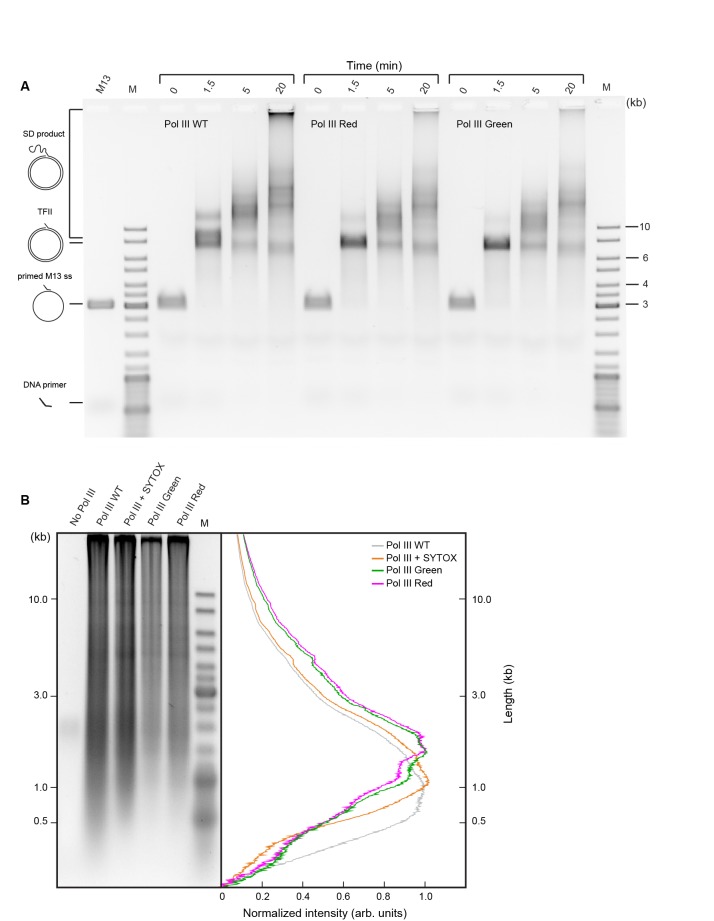
Figure 2—figure supplement 3. Comparison of activities of wild-type and SNAP-labeled Pol III cores.
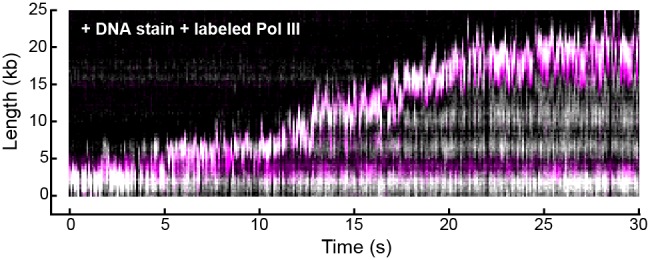
Figure 2—figure supplement 4. Representative kymograph of simultaneous staining of double-stranded DNA and fluorescence imaging of Pol III in real time.
